Transcription
2022INSIDER’S GUIDETO SUCCESSFULTRADING1MARKET 1market.com
DisclaimerThis material is considered marketing communication and does not contain and should not be construedas containing investment advice or an investment recommendation, or an offer of or solicitation for anytransactions in financial instruments. The Company makes no representation and assumes no liabilityfor the accuracy or completeness of the information provided nor any loss arising from any investmentbased on this material, forecast, or other information supplied. All expressions of opinion are subject tochange without notice. Any opinions made may be personal to the author and may not reflect theopinions of the Company. This communication must not be reproduced or further distributed withoutprior permission from the Company.RISK WARNING - TRADE RESPONSIBLY: CFDs are leveraged products that incur a high level of risk andcan result in the loss of all your capital and may therefore not be suitable for all investors. You should notrisk more than you are prepared to lose, and before deciding to trade, please ensure you understand therisks involved, take the level of your experience into consideration and seek independent advice ifnecessary. We strictly do not provide trading advice.1Market is a tradename of Exelcius Prime Ltd., authorised and regulated by the Cyprus Securities andExchange Commission with licence number 366/18, and registered office at 254 ArchiepiskopouLeontiou A, MAXIMOS COURT A, Floor 7, Office 73 & 74, 3020 Limassol, Cyprus.1MARKET Insider’s Guide to Successful Trading
Table of contents contents01. INTRODUCTION TO ONLINE TRADINGWhat is Online TradingForexAdvantages of the Financial Markets02. 1NSIGHT1Market’s Advanced 1nsight Algorithm TrendSpottingTrend ReversalMoving FastSurge in OpeningsGrowth in TradingGoing UpGoing Down03. INTRODUCTION TO CONDITIONSPipsSpreadLeverageMargin04. INTRODUCTION TO CHARTSLine ChartsBar OHLC (Open, High, Low, Close) ChartsCandlestick ChartsReading Candlesticks05. INTRODUCTION TO FUNDAMENTAL ANALYSISFundamental Factors Influencing Price MovementsInterest RatesUnemployment RateGeopolitical ScenarioUsing Fundamental Analysis to Trade Major Currency Pairs06. INTRODUCTION TO TECHNICAL ANALYSISTechnical Factors Influencing Price MovementsUsing Technical Analysis to Trade Major Currency PairsResistance and SupportRange TradingDrawbacks of Range TradingMomentum MarketsOscillatorsRelative Strength Index (RSI)Different Ways of Using the RSIMoving AverageExponential Moving AverageUsing Exponential Moving AverageThe Moving Average Convergence Divergence (MACD)Fibonacci RetracementsRisk Management - Using Stop Loss and Take Profit OrdersThe Psychology of the TraderTrading Philosophies and Market NoiseTrading Strategies1MARKET Insider’s Guide to Successful Trading
01 INTRODUCTION TO ONLINE TRADINGWhat is Online Trading?Since the computer revolution, many activities that once required physicalpresence can now be conducted online. This includes trading financial assets – those things a person canown that are generally traded in financial markets, whether these are exchanges or “over-the-counter”.In online trading, a client (trader, speculator, investor) usually subscribes to the services of an onlinebroker. As opposed to a traditional trader, who accepts verbal/written orders and then executes them,an online trader provides access to an online platform that enables the client to execute orders in themarketplace, in addition to other services.Generally, platforms provide access to shares, Forex, commodity and index futures, ETFs, and otherderivatives, including CFDs and vanilla options. Amongst these, CFDs (Contracts for Difference) havebecome one of the most popular in recent years. Contracts for Difference are derivatives that covernearly all other assets (including some futures contracts but at present, not options1).ForexForex Trading refers to the investment in the evolution of the relative value between two currency pairsusing an online trading platform2. Forex can be traded on the spot market (directly with a liquidityprovider such as a bank or currency exchange, for example), using futures contracts or as a CFD. In ForexCFD trading, assets are quoted in pairs.For example, USD/JPY refers to the US Dollar and Japanese Yen pair. Some of the major currencies being tradedon the market are the Swiss Franc (CHF), the Euro (EUR), the British Pound (GBP) and the Japanese Yen (JPY). Allof these currencies are traded against the US Dollar (USD).Within the pair itself, the first currency is known as the base currency, while the second currency isknown as the quote or counter currency. All quotes are made in terms of the base currency. This meansthat one unit of the currency pair is worth one unit of the base currency. Its value equals the amount ofcounter currency one would get in exchange for that one unit.When you ask for a currency quote, you will be given two prices, the Bid price and the Ask price. The Bidprice is the price you will get for selling a currency pair, while the Ask price is the price you will get forbuying a currency pair. Both of these prices are expressed in terms of the base currency. Let’s say the buyrate for the USD/CHF currency pair is 0.9595. This means that one US Dollar is equivalent to 0.9595 SwissFrancs.1MARKET Insider’s Guide to Successful Trading
Advantages of the Financial MarketsHighly Liquid MarketThe daily Forex market is estimated to be worth over 6 trillion. This means that the market is too largefor any single individual or institution smaller than a central bank to influence.24-Hour MarketBecause the currency market is not tied to a single physical location, 24-hour trading is possible. Themarket operates from Monday morning in Sydney (GMT 10) to Friday evening in New York (EST).No Fees or CommissionsMost brokers in the online market do not charge retail traders commissions when buying or selling acurrency. Instead, what you pay is the “spread.” This is the difference between the Bid price and the Askprice. In the example above, the buy price of the USDCHF is 0.9595, and the sell price is 0.9491.Therefore, the spread is 3 pips, which equals 3/100th of a Swiss Centime, or 3/10,000th of a Swiss Franc.In addition to currency pairs, online CFD trading also offers derivatives trading on commodities (Oil,Gold, Silver, and others), stocks (Google, Apple, Amazon) and indices (DAX, NASDAQ, etc.) – all tradedagainst a currency, usually the US Dollar.A trader may profit from the market situation depending on whether he undertakes a “short” or “long”position. When you take a “short position”, you assume that the price of the traded asset will fall. Whenyou take a “long position”, you assume that the price will rise.CommoditiesCommodities are physical products that fulfil a physical need. Society requires oil and other energyproducts, agricultural produce, metals, and mined products. These products are traded throughcommodity exchanges that standardise the quality and measurement units whereby they can be tradedto enable easy exchange of one unit for the other.For example, a single contract of coffee as exchanged through the ICE exchange in the US includes 27,500pounds of pure Arabica (KC) or Robusta (RC) coffee beans. Oil comes in three main types – WTI for the USproduced West Texas Crude, European Brent from the Brent oil fields in the North Sea, and Dubai Crude– each priced differently and traded at different exchanges3.Most online retail traders do not buy or sell commodities but trade CFDs that track the current value ofcommodity futures contracts.Commodities can be agricultural, livestock, precious metals, energy and – most recently – eveninclude pollution units. In general terms, we distinguish between hard commodities, which are extractedor mined from the earth, and soft commodities, which are grown or cultivated4.IndicesThe Starting in the late 19th Century, Henry Varnum Poor initiated a listing of railway companies layingtracks throughout the US. This evolved, developed, and soon transformed into a regular averaging of thetop stocks of the New York Stock Exchange – first published by Charles Dow as a service to readers ofhis newspaper, the Wall Street Journal.Today, nearly every stock exchange has an index that thus measures its performance – either publishedby the exchange (NASDAQ) or an external agent (FTSE – the Financial Times5).Clearly, being a measured average, an index cannot be directly invested in; however, one may invest in afutures contract, an ETF or other derivative that tracks the index.SharesShares are as old as commerce, nearly. Purportedly they first appeared in the Roman Empire as a meansto finance public works, then made their auspicious entry with the birth of European- Indian trade in the17th Century, when the expense of trading expeditions was covered by businessmen who would thenreceive in return a share in the profits upon the return of the vessels.1MARKET Insider’s Guide to Successful Trading
Today, companies sell parts of themselves to shareholders to finance their operations. Shareholdersthen receive regular payments as dividends if the company chooses to share its profits with them.However, not all do, and – indeed – those whose shares gain the most value often do not, preferring toredirect their profits into development.Shares can be private (not sold through an exchange) or public – the result of an initial or subsequentpublic offering through an exchange’s primary market, usually through the services of a large bank orinvestment house acting as an underwriter.BondsLike shares, bonds have a face value (what they are worth) and usually pay a coupon (like a dividend).Also, like shares, they are offered through public offerings, usually through an underwriter using a majorexchange. However, here the similarity ends.For if shares represent a share in a company, bonds represent debt.Companies and governments (national and local) often sell bonds, i.e. debt. And as in any loan, theloan-giver receives a regular interest payment. Another difference is that governments will often offerbonds directly to the public (this notwithstanding the NASDAQ’s recent application to offer sharesdirectly, without the services of an underwriter).Government bonds are usually considered the safest of all investments – subject to the country’s creditrating supplied by major rating agencies – and often make up the bulk of retirement fund portfolios.Bonds can be sold at a premium (above their face value) or a discount (below their face value). The sumof coupon payments plus the face value the lender receives when the bond matures equals a bond’syield.And some brokers offer CFDs that track a bond’s yield.As with commodity futures, CFD traders should be aware that if they hold a position on a contract that isabout to expire or a bond that is about to mature, the CFD will expire with it, whether at a loss or a profit.ETFsLike shares and bonds, Exchange-Traded Funds are – as their name implies – traded on an exchange6. Inrecent years, they have become the most popular asset for fund managers – retirement, mutual, etc.,since they cover asset groups - be these sectors, asset classes, national almost any kind of groupingone could think of - and include different kinds of assets, related to that grouping. Thus, they make forexcellent diversification or hedging and long-term investments.Unlike mutual funds, which are more actively managed, ETFs cannot be altered as easily and requirenotification to all fund members.Again, for now, most online brokers do not offer direct trading of ETFs but rather CFDs that track theirperformance.Visit 1Market’s Education Centre to learn more about trading1MARKET Insider’s Guide to Successful Trading
02 CROWDTRADING1Market is not your average online broker. The 1Market trading platform truly leverages the concept ofthe Wisdom of the Crowd with its revolutionary technology, called 1nsight.In the Modern Era, the Wisdom of the Crowd was identified a century ago by a renowned statistician, SirFrancis Galton. He demonstrated that the average estimate of a large group of people is in many casesmore accurate than those of even the smartest individuals in the group.With this philosophy as our foundation, 1Market, assisted by a team of market experts and ITdevelopers, has developed an advanced trading environment designed to assist traders of all levels ofexperience in making important trading decisions.Known as 1nsight trading, this approach enables you to leverage the power of the Crowd - a group oftraders whose collective knowledge is harnessed to your advantage when buying andselling financial assets.CrowdTrading, unlike social trading, is about you, the individual, and your relationship with theCrowd. It’s about you making your own decisions on what to do with your investment, with the Crowd asyour focus group.1Market’s Advanced 1nsight AlgorithmWe offer you 6 main 1nsight trading features. Our advanced algorithm is constantly working in thebackground, examining trader activity, spotting sharp changes on specific assets and highlighting them,thus helping you make better trading decisions.Each 1nsight tool is specifically designed to identify different trading patterns across a large sample ofactive traders.Trend Spotting1Market’s Trend Spotting feature is designed to display Buying or Selling trends on specific assets.Let’s say, for example, the word on the market is that BMW Motors is launching a new super-safe familycar. Consequently, 70% of traders opened BUY positions in the last 20 minutes. This would indicate thatthe Crowd noticed the opportunity to buy in, creating a trend on the asset. The platform spots the trendand highlights it accordingly. 70% of traders chose SELL, marking a downtrend. However, in the past 16minutes, 55% of new positions were BUY. The platform recognises this new trend and highlights it.1MARKET Insider’s Guide to Successful Trading
Trend ReversalA Trend Reversal is when an asset abruptly changes its direction.For example, Apple just launched a new Apple Watch. 82%of the Crowd took note and opened Buy positions, creatingan upward trend. However, the latest news is that Samsungwill launch a rival to Apple Watch tomorrow. Now thefigures reflect the Crowd’s decision is to sell Apple sharesinstead of following the Buying momentum a minute ago.This change creates a Trend Reversal.Moving FastMoving Fast is a feature that recognises rapid Buy/Sell activity on a specific asset. Moving Fast is basedupon the number of quotes on a certain asset within a certain time frame. An asset that moves fast ismore volatile, seeing bigger and sharper movements in its price.For example, Crude Oil is currently trading at 47 a barrel. Depending on the US Oil Reserves Report outcome,if a large deficit needs to be compensated for, there will be a fast movement towards Buy. If the report confirmsthere are more than enough reserves to keep the country moving, there will be a large movement towards Sell.Surge in OpeningsA Surge in Openings is when more traders than usual choose to open positions on a specific asset, nomatter the direction.For example, the UK’s Monthly Unemployment Rate isreported as higher than expected. This significantly affectsthe value of the British Pound against other majorcurrencies, especially the US Dollar. The subsequentdowntrend causes extreme Buy/Sell activity on the GBP. The1nsight Feed recognises this movement and displays it.Growth in Trading1Market’s Growth in Trading tool allows you to view the volume being traded on a specific asset.For example, when Yahoo! announced they would be selling their interest in Chinese mega-company Alibabato buy into AOL. With Alibaba’s IPO still fresh in traders’ minds, it was considered a Hot Asset. The 1nsight Feednoticed a 3,000% increase in the volume traded in Alibaba stock over the past 30 minutes. As a result, 70% ofCrowdTraders chose to open larger positions on the asset.1MARKET Insider’s Guide to Successful Trading
Going UpGoing Up is a feature that shows an uptrend on a specific asset.For example, in the last 2 hours, the rumour on the market is that Walmart has just completed negotiationswith the Tesco Group to buy 200 underperforming retail locations. No press release has been announced yet,but the Crowd sees this and recommends keeping an eye on the asset. As a result of increased interest from theCrowd, the asset’s rate goes UP, creating a possible uptrend.Learn more about 1Market’s 1nsight Live Feed on our website1MARKET Insider’s Guide to Successful Trading
03 INTRODUCTION TO TRADING CONDITIONSPipsIn Forex trading, any reference to fluctuations in the rates is made in “Pips”. For currency pairsdisplayed to four decimal places, 1 pip is equal to 0.0001.An exception to this rule is Yen-based currency pairs, which are displayed to only 2 decimal places (0.01).Fractional pips are also offered to provide an extra digit of precision for certain currency pairs.A fractional pip is equivalent to 0.0001.For example, if the EUR/USD Bid price moves to 1.26502, this means that the rate will have moved by 5.2 pips– from 1.26554 to 1.26502. The value of a pip depends on the size of the contract (or “Lot”) that you aretrading with.SpreadIn most online trades, 2 rates are applicable, depending on whether the trader buys or sells a currencypair. If he is selling a currency pair, he will request the “Bid” price of the currency pair. Conversely, if hebuys a currency pair, he will look at the “Ask” price. The Ask price will always be higher than the Bidprice.When opening a “long” position (which assumes that the asset’s value will increase), the trader opens hisposition (buys the asset) at the higher ASK price and closes it (sells the asset) at the lower BID price.When he opens a “short” position (assuming the value drops), he will open (sell the asset) at the lowerBID price and close (buy the asset) at the higher ASK price.In other words, the spread is a round turn transaction cost. In our previous example of the EUR/USD1.2650/52 quote, the spread is equivalent to 2 pips. For the trader, it means that any starting positionbegins at a loss until he accumulates enough profits to cover the spread of the transaction. Thus, if atrader takes a long market position at the Buy price and immediately closes his market position at theSell price, he will incur a loss exactly equal to that of the spread.LeverageThe majority of brokers provide margin trading accounts for their clients. This allows traders to leveragetheir trading by much higher ratios.For example, your broker offers leverage of 100:1. With just 1,000, you can, theoretically, trade up to 100,000 worth of contracts.Traders require only a small amount of capital to take a larger position in the market. If the marketposition taken by the trader happens to incur heavy losses, and his losses reach the total balance of histrading account, his broker will close his market positions.In online trading, the concept of leverage refers to the situation where a trader borrows money from thebrokerage firm and uses that money specifically for trading in the market. Because of leverage, a traderwith just a small amount of capital can invest in contracts of significantly higher value.Higher leverage means higher profit potential and also higher risk.MarginBefore a trader can capitalise on the leveraging factor in online trading, he first needs to put up amargin. This is, in effect, a deposit of good faith or a performance bond. Only after fulfilling the marginrequirement of the brokerage firm can the trader place an order much larger than the funds in theirtrading account would typically allow.1MARKET Insider’s Guide to Successful Trading
In the event of losses, where the funds in the trading account fall below the margin requirements, thebroker will close some or all of the trader’s positions to make up for the shortfall. The 1Market platformalso has automated negative balance protections in place, so no trader will ever reach a negativeaccount balance. According to margin-close, all open positions will automatically close when the requiredmargin reaches 50% if the positions have not already been closed on a per-account basis.For example, an account’s equity balance is 10,000. The trader decided to open a trade using the maximumleverage, 1:400, opening a 4,000,000 deal ( 10,000 x 400). The trader’s account open P&L drops to - 5,000,dropping the margin requirement to 5,000, which in 50%. According to ESMA intervention measures, all openpositions will be closed since the margin requirement balance has reached 50% of the margin requirementamount.A chart is a graphical representation of numeric data. There are 2 fundamental elements within the chart:price and time. There are several types of charts that a trader can use.1MARKET Insider’s Guide to Successful Trading
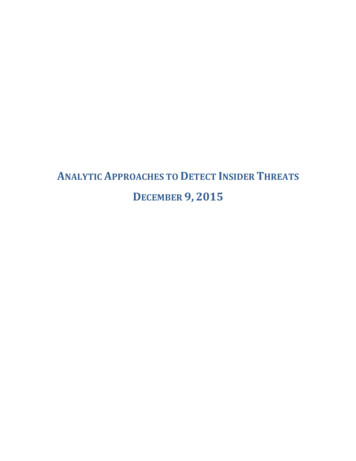
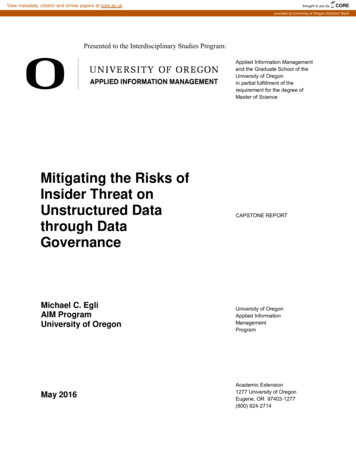
03 INTRODUCTION TO CHARTSLine ChartsLine charts can present an overall view of the fluctuations within a specific timeframe. They are not asdetailed as “Bar Charts” or “Candlestick Charts”, but they are simple and easy to decipher. In essence,line charts are just simple lines that connect all the closing prices of a currency pair for specific timeintervals. An example of a line chart is illustrated:Bar OHLC Charts (Open, High, Low, Close)These are more detailed charts. The span of the bar depicts the spread of prices within a specifictimeframe. If there is a significant difference between the low and high price levels, this will be shownby an extended bar on the chart. Opening prices are shown on the left tab, while the right tab indicatesthe closing price. Thus, you can see how the prices move and how big the movements are. Because thesecharts are relatively detailed, they can be quite difficult to interpret when printed out on paper. Thefollowing chart shows what a bar OHLC chart looks like:1MARKET Insider’s Guide to Successful Trading
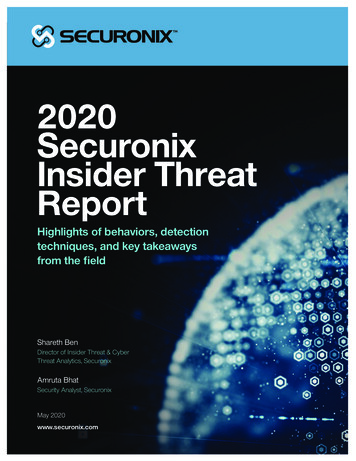
Candlestick ChartsThese charts bear a resemblance to bar charts but also show the prices of the Open and Closetimeframes, Highs, and Lows. When compared to bar charts, they’re easier to interpret because they’reused to indicate price movements. The Green colour shows prices on the upswing, while the Redindicates the opposite price movement. An example of a candlestick chart is shown:Reading CandlesticksA candlestick displays the high, low, open, and close for a security over a specified period of time.For example, in a 30-minute chart, each candlestick represents 30 minutes. The open rate is received at thebeginning of the period, and the close is the last rate. If the open rate is lower than the close rate, it means therate has increased during the candle, and the candle will be green. If the rate decreases, the candle will be red.The upper wick shows the highest rate during the candlestick. The lower wick shows the lowest rate during theperiod1MARKET Insider’s Guide to Successful Trading
05 INTRODUCTION TO FUNDAMENTAL ANALYSISFundamental Factors Influencing Price MovementsTo profit from trading on the financial markets, traders should be able to predict price movements asaccurately as possible. To do this, they can resort to “Fundamental Analysis” or “Technical Analysis” tohelp formulate predictions about price movements. Fundamental Analysis looks at the macroeconomicfactors that can affect a currency exchange rate, such as news, economic events and economicindicators. Here are some examples:Interest RatesIn each country, the Central Bank will determine the overnight lending rate for commercial banks.Control of interest rates is essential for any Central Bank to implement its monetary policies. Theinterest rates can also be used as a tool to expand or contract the money supply. Generally, a lowerinterest rate will cause a country’s currency to depreciate due to traders indulging in Carry Trades.Carry Trading is a trading strategy where a trader exchanges a currency that yields low interest foranother currency earning a higher interest rate. This is because currencies with higher interest rateswill normally rise in value. In addition, with trading rollovers, traders can also earn interest daily.Unemployment RateThis is one of the primary indicators of how well a certain country’s economy is doing. A highunemployment rate will indicate that the economy performs poorly, typically leading to currencydepreciation.Geopolitical ScenarioSignificant global political events affect the financial markets, not just one specific market.Using Fundamental Analysis to Trade Major Currency PairsFundamental Analysis is particularly useful in predicting the long-term trend of a currency and itscorresponding pair. By concentrating on those long-term factors affecting a country’s economicgrowth, traders may be able to predict which way a currency pair will move in the long term.For example, a trader believes that the Bank of England will intervene in the financial markets by lowering theinterest rate. If this happens, it will result in the value of the British Pound decreasing against the US Dollar.The trader will take a “short” market position for the GBP/USD in such a situation. He will then proceed to getthe “Bid” price for the GBP/USD pair with the intent to sell this currency pair. Conversely, if the trader believesthat the value of the British Pound will rise in relation to the US Dollar, he will get the “Ask” price for theGBP/USD currency pair to buy this currency pair.EUR/USDTypically, when the US Dollar weakens, the Euro rises in relation to it. Conversely, when the US Dollarstrengthens, the Euro’s value declines against the US currency.For example, when the US economy faces an increasingly high unemployment rate, it will weaken the Dollar.Therefore, a trader will buy (Ask) the Euro to expect it to appreciate against the US Dollar. Similarly, if there isa surge in demand for US financial instruments like Treasury Bonds or Equities, it will help push the value of theUS Dollar up against the Euro. In this case, a trader will want to sell (Bid) the Euro as the value of the US Dollarappreciates.1MARKET Insider’s Guide to Successful Trading
USD/JPYIf the Japanese government wishes to boost demand for their exports, they’ll try to weaken the JapaneseYen against the US Dollar. When that happens, the USD/JPY will rise in price. Traders wishing to benefitfrom this scenario could choose to buy (Ask) the USD/JPY in anticipation of an increased US Dollar value.Similarly, when the level of Foreign Direct Investment (FDI) increases in Japan, it will help push up theYen's value compared to the USD. If that is the case, traders could sell (Bid) the USD/JPY, hoping to profitfrom the appreciation in the Yen.GBP/USDIf the UK’s monetary supply increases, it will result in supply exceeding demand for money. This will meanthat the banks will have more money to lend, resulting in lower interest rates. These factors will likelydepreciate the value of the British Pound against the US Dollar, and a trader may want to sell (Bid) theGBP/ USD currency pair. Conversely, if due to careful monetary policies, the UK’s economy enjoys robustgrowth as reflected in the increasing growth rate of its Gross Domestic Product (GDP), this will result inthe value of the British Pound appreciating in relation to the US Dollar. Therefore, traders may want tobuy (Ask) the GBP/USD currency pair.USD/CHFThe Swiss Franc is normally seen as a safe-haven currency. Thus, during times of global instability, theSwiss Franc becomes a highly demanded currency and usually appreciates in relation to the USD.Therefore, traders could sell (Bid) the USD/CHF in shaky economic times. On the other hand, duringperiods of stability, the demand for the US Dollar usually increases as people see less need for placingtheir money in Swiss Francs as a safe-haven currency. In this situation, traders could buy (Ask) theUSD/CHF as the US Dollar strengthens against the Swiss Franc.AUD/USDOne of the biggest export earners for Australia comes from the mining sector. Hence, any increase incommodities prices boosts the export earnings of Australia, which can benefit the value of theAustralian Dollar. Traders could react by buying (Ask) the AUD/USD currency pair since the AustralianDollar could strengthen against the US Dollar.Another major export earner for Australia comes from the agricultural sector. Therefore, if Australiafaces widespread drought, it will most likely cause the agricultural sector to decrease its contribution toexport earnings for the Australian economy. As a result, the Australian Dollar may depreciate againstthe US Dollar. Traders may choose to sell (Bid) the AUD/USD currency pair, as the Australian Dollar mayslide in value against the US Dollar.USD/CADHigh unemployment rates suffered by the Canadian economy may result in the Canadian Dollardepreciating against the US Dollar. To take advantage of this scenario, traders may consider buying (Ask)the USD/CAD currency pair.Conversely, if the Canadian economy rebounds due to lower unemployment rates, it will most likelyresult in the Canadian Dollar appreciating against the US Dollar. For traders to profit from this, theycould consider selling (Bid) the USD/CAD currency pair.1MARKET Insider’s Guide to Successful Trading
NZD/USDNew Zealand controls 1/3 of the global trade in dairy and meat products. In essence, this country’seconomy is centred on its agricultural sector. Therefore, any factors that affect this sector’s exportearnings will likely affect the value of its currency. So, a decline in dairy output in the US resulting from anatural disaster could increase demand for New Zealand dairy exports. This will likely cause the NewZealand Dollar to appreciate in relation to the US Dollar. To benefit from this, traders could buy (Ask)the NZD/ USD currency pair.On the other hand, if there happens to be an outbreak of Foot & Mouth disease in New Zealand, this maycause a decline in dairy and meat product
Forex Forex Trading refers to the investment in the evolution of the relative value between two currency pairs using an online trading platform2. Forex can be traded on the spot market (directly with a liquidity provider such as a bank or currency exchange, for example), using futures contracts or as a CFD. In Forex