Transcription
Planning, Conducting, and DocumentingData Analysis for Program ImprovementMarch 2015
The contents of this document were developed under a grant from the U.S. Department ofEducation, # H373Z120002, and a cooperative agreement, #H326P120002, from the Office ofSpecial Education Programs, U.S. Department of Education. However, those contents do notnecessarily represent the policy of the U.S. Department of Education, and you should notassume endorsement by the Federal Government. DaSy Center Project Officers, MeredithMiceli and Richelle Davis and ECTA Center Project Officer, Julia Martin Eile.March 2015Suggested citation:The Center for IDEA Early Childhood Data Systems, & The Early Childhood Technical AssistanceCenter. (2015). Planning, conducting, and documenting data analysis for programimprovement. Menlo Park, CA: SRI International.
AcknowledgmentsThis document was developed as part of the activities of the DaSy State Systemic ImprovementPlan (SSIP) workgroup through collaboration with the Early Childhood Technical AssistanceCenter (ECTA).Abby Winer, DaSy/ECTACornelia Taylor, DaSy/ECTATaletha Derrington, DaSyAnne Lucas, DaSy/ECTASpecial thanks is extended to a number of colleagues who reviewed and contributed to thedevelopment of this resource:Kathleen Hebbeler, DaSy/ECTASarika S. Gupta, DaSyRobin Nelson, DaSy/IDCSharon Walsh, DaSy/ECTARobert A. Ruggiero, DaSy/IDC
ContentsIntroduction .1The Data Analysis for Program Improvement Proceeds through Several Stages.1Discussion prompts for in-depth analysis.2Discussion prompts for summarizing findings.3Essential Elements of a Data Analysis Plan and Documentation .3Examples of Different Ways to Plan and Document Data Analyses .4Example 1 – Planning Data Analyses and Additional Data Collection.5Example 2 – Data Analysis Plan and Documentation in Table Format.7Example 3 – In-Depth Data Analysis Plan and Documentation. 13v
PLANNING, CONDUCTING, AND DOCUMENTING DATA ANALYSIS FOR PROGRAM IMPROVEMENTIntroductionThis document was developed to help technical assistance (TA) providers and state staff in planning,conducting, and documenting data analysis for program improvement. The intended audiences includestate staff and national, state, and local TA providers who are involved in the data analysis for programimprovement, using the State Systemic Improvement Plan (SSIP) as an example.This tool is designed to help states:Define and limit the scope of data analysis for program improvement efforts, including the SSIP. Some states have many options for data analysis. The development of a plan for data analysiswill help identify and limit the analyses to those most relevant to the critical questions in thestate related to child and/or family results, and to identify data quality issues with those data.Develop a plan for data analysis. A plan for data analysis is a roadmap for generating data tables and relating the state’sfindings to the development of improvement plans, including the SSIP.Document alternative hypotheses and additional analyses as they are generated. States might identify a need for additional analyses as they examine the first set of findings.When this happens, they will need to add them to the analysis plan and document theadditional findings. With documentation in hand, it will be much easier to describe the dataanalysis process and results to others.Summarize the findings and document the results and location of the output from completedanalyses.The Data Analysis for Program Improvement Proceeds through Several Stages1. Plan and conduct broad data analysis. In the broad data analysis stage, states can review theirexisting aggregated data across a number of potential child or family outcomes, for the SSIPknown as State-Identified Measureable Results (SIMRs). The findings from the broad dataanalysis can be considered along with what was learned from the infrastructure analysis todetermine what result or cluster of results would be most justifiable as the focus for programimprovement. More information about the broad data analysis and discussion prompts can befound athttp://ectacenter.org/eco/assets/docs/SSIP child outcomes broad data analysis template FINAL.docx2. Plan and conduct in-depth data analysis. After completing the broad data analysis andconsidering the potential impact and feasibility of potential child or family outcomes (e.g.,SIMRs), the state can plan additional in-depth analyses to limit the breadth of their programimprovement data analysis efforts and intensify the detail of results. Developing a plan for dataanalysis is beneficial for structuring and guiding all levels of data analysis. Developing a plan fordrilling down into the relevant findings from the broad data analysis before starting in-depth dataanalysis and disaggregating the data will further ensure the state’s efforts are focused and result inthe information needed to develop a high-quality program improvement plan (e.g., SSIP). Seebelow for a list of discussion prompts to help think through questions and priorities related to thein-depth analysis, including gathering information on root causes or root cause analysis. Thesequestions need not be asked in this order, nor are they all always required or relevant foreveryone.March 20151
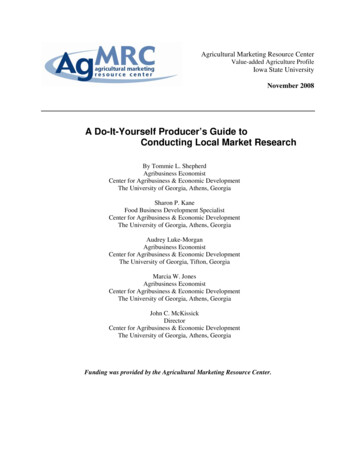
PLANNING, CONDUCTING, AND DOCUMENTING DATA ANALYSIS FOR PROGRAM IMPROVEMENTDiscussion prompts for in-depth analysisBased on the broad analysis, what child or family outcome(s) is the state considering for in-depthanalysis? Focus the questions below on this outcome(s).Does the state have concerns about data quality that may limit the state’s ability to interpretthe data?What factors might be related to performance on the child or family outcome(s)? Considercharacteristics of the:a. Childb. Familyc. Providerd. ProgramWere there changes over time in thecharacteristics and factors above that might berelated to state performance on the child orfamily outcome over time (e.g., an increase inthe percentage of families that speak onlySpanish participating in early intervention)?Is any information already known about thefactors identified above?Would looking at additional information aboutthese factors help to identify one or more rootcauses that could be addressed within the timeframe of the program improvement plan (e.g.,SSIP)?What are the state’s hypotheses about what isdriving differences in the child and/or familyoutcomes across various dimensions, includingcharacteristics of the child, family, orprogram?a. What data are available in the state datasystem to answer questions about any ofthese hypothesized relationships?Root cause analysis is a type of more indepth analysis that is conducted to identifycontributing factors that help answer thequestion of why low performance isoccurring. The objective is to determinewhat is happening, why it is happening,and what can be done to reduce thelikelihood that it will continue. Thesecontributing factors explain the problemand suggest how it can be addressed. 3. Summarize Findings. After conducting theplanned analyses, the state should summarize thefindings to share with stakeholders and otheraudiences. The summary should include:Root cause analysis may identify oneor more contributing factors, whichmay be interrelated.The analysis should identifysomething that the state can influenceand control, that is, a factor that isactionable.The analysis might identify somethingthat the state cannot influence orcontrol but should be aware of toincrease the chances of success inaddressing root causes that areactionable.The questions and problem statements addressedHypotheses about questions and problem statementsAnalyses completed and results that address the questions and problem statementsPossible root causes that are suggested by analyses2March 2015
PLANNING, CONDUCTING, AND DOCUMENTING DATA ANALYSIS FOR PROGRAM IMPROVEMENTHere is a list of discussion prompts to think about in summarizing the findings. These questions neednot be asked in this order, nor are they all always required or relevant for everyone.Discussion prompts for summarizing findingsWhat was learned from the data analyses about each of the state’s questions?Which questions could or could not be answered?Were the findings unexpected? If so, what alternative hypotheses were suggested to explainthem?Could poor data quality have contributed to unexpected findings?Where can the state get more information to answer initial questions or ask additionalquestions that might help in identifying a child or family outcome or measureable result ofthe program improvement efforts (e.g., SIMR)?Essential Elements of a Data Analysis Plan and DocumentationA data analysis plan provides descriptive information about the analyses a state is planning toconduct. The following elements should be included in the plan, keeping in mind the order may vary andshould be tailored to fit proposed questions and resources.Purpose of the intended analyses, including examination of Data quality Overall outcomes (aggregated data or broad data analysis) Specific factors hypothesized to relate to outcomes (disaggregated data or in-depth analysis)Description of the general topic of analysisDetails for planning and conducting the analysis that specify What – the specific topic that is being analyzed Why – the hypotheses or rationales driving the analyses How – the specific variables that will be used, the types of analyses to be conducted (e.g.,descriptive percentages and numbers, meaningful difference comparisons, chi squaredcomparisons), and the order in which the analyses will be completedDocumentation of decisions and results of the analysisFor additional ideas, see ldOutcomesDataGuidanceTable.pdfThree examples below should assist states in planning, conducting, and documenting their dataanalysis findings and analytic decisions. Each example presents a different format, demonstrating thatthere are multiple ways to document and to capture the key findings of a planned analysis.March 20153
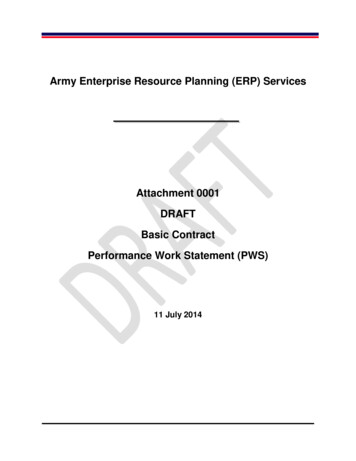
PLANNING, CONDUCTING, AND DOCUMENTING DATA ANALYSIS FOR PROGRAM IMPROVEMENTExamples of Different Ways to Plan and Document Data AnalysesThere are several ways to plan and document the data analysis, but in all cases, the goal is to structureanalytic activities to create an efficient, organized process for planning, analyzing, and documenting thedata to facilitate writing the SSIP. This section presents three examples of documentation of data analysis,each specifying what was planned, what was analyzed, and what was found. The table below summarizessome of the key differences between the examples to help guide which example may serve as the bestmodel for you.FeaturesFormatHighlights data quality concernsExample 1Example 2Example 3OutlineTableOutlinexIncludes broad data analysis (aggregated data)Includes more in-depth data analysis (disaggregated data)xxIncludes additional or follow-up analyses to be conductedIncludes plans for additional data collectionxxxxxExample 1 presents an approach for planning and documenting data analysis. It is written in outlineform and includes the purpose of the analysis; a description of the broad topic of analysis; the generalrationale behind the analysis; details for the in-depth analyses that include what (variables), why(hypothesized), and how (compare percentages) the analyses will be conducted; and the plan fordocumenting findings and decisions. In addition, it includes a section that articulates the benefits andchallenges of a new planned data collection to gather information on root causes, including theestimated effort required. It also discusses data quality considerations and activities to address them.Example 2 is a template that incorporates steps and information involved in planning anddocumenting the data analyses. It is a working document that is organized into two sections, one for thebroad data analyses and one for the in-depth data analyses. Each section includes (1) the purpose of theanalysis; a description of the topic of analysis; (2) the rationale behind the analysis; details on the onadditional analyses and specific factors (e.g., child outcomes, positive social relationships, data quality,child/provider/program characteristics); (3) why these factors will be analyzed (hypotheses aboutrelationships and drivers of differences); (4) how the analyses will be conducted (compare percentages);and (5) documentation of the analyses, results and interpretation. This example presents a template tomodel analysis planning, including steps to develop hypotheses, describe the analysis, record results,organize files, and track status.Example 3 provides a template for in-depth data analysis. It is written in outline form and includesthe purpose of the analysis, the question to be answered or addressed by the analysis, and the subgroupsand factors to be examined. For each subgroup, the following information is documented: (1) data andcomparison to be made, (2) hypothesis or expectation, (3) documentation of the result of the analysis, and(4) when indicated, additional analyses to be conducted based on the findings from the initial analyses(including data and comparison(s) to be made, hypotheses/expectations, and results).These three examples illustrate different ways to go about planning, conducting, and documentingdata analyses that lead to the same end – writing the a program improvement plan (e.g., SSIP Phase Iplan). Analyses documented in this initial stage may also be used to inform the development andevaluation of program improvement activities (e.g., SSIP Phase II and III).4March 2015
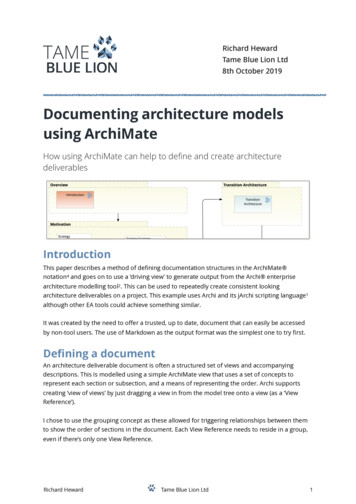
PLANNING, CONDUCTING, AND DOCUMENTING DATA ANALYSIS FOR PROGRAM IMPROVEMENTExample 1 – Planning Data Analyses and Additional Data CollectionArea of focus: Improving capacity of families and providers to support infants’ social emotionaldevelopmentI.II.III.IV.Child Outcome – Positive Social Emotional SkillsRationale – Fifty-five percent of children who are younger than age 1 when they enter earlyintervention (EI) and are identified as having positive social emotional skills that are at or aboveage expectations. At exit, 10% of these children are found to be below age expectations inpositive social emotional skills.Additional drill down analyses that can be completed with the information currently in the DataManagement Systema. Examine the percentages of children who make greater than expected gains in positive socialemotional skills byi.Size of program – hypothesis: More children will make greater than expected gains insmaller programs than in larger programs.ii.Length of time in program AND age at entry – hypothesis: Children who enter theprogram younger than age 1 and stay in the program for 6 months to 1 year will be lesslikely to make greater than expected gains than those who enter the program youngerthan age 1 and stay in the program longer than 1 year.b. Examine the percentage of children who enter at age expectations in positive social emotionalskills (Child Outcome Summary (COS) rating 6 COS rating 7/total with a rating) by:i.Disability AND age at entry – hypothesis: Children with disabilities with lower levelsof impairment (e.g., low birth weight) are expected to be more likely to enter theprogram functioning at age expectations than those with higher levels of impairment.Additional collection of information not currently in the Data Management System needed toanalyze root causesa. Question additional data will be used to examine: How well has each program supported thefamily’s ability to support their child’s social emotional development?i.Questions to drive data collection on potential root causes:1. What practices are providers using to assess social emotional skills?2. What strategies are providers using to improve social emotional skills?3. What do families perceive or experience in the program related to supporting theirchild’s social emotional development?4. What strategies do families report as most helpful in supporting their child’s socialemotional skills?ii.Data collection method – Collect data through interview or survey of a small sample ofproviders and families.iii.Benefits of data collection – Collecting information not yet known about:1. The practices that providers use to help families in supporting their child’s socialemotional skill2. Family perceptions of provider-implemented strategies to support their child’ssocial-emotional skillsiv.Challenges of data collection:1. Developing an interview protocol that would be useful in capturing the aboveinformation.2. Collecting the data would add an additional burden to state staff responsible forensuring that the data are collected.March 20155
PLANNING, CONDUCTING, AND DOCUMENTING DATA ANALYSIS FOR PROGRAM IMPROVEMENTV.VI.63. The interviews may also add an additional burden on families.v.Estimated effort required –1. Develop interview protocol – this would require putting together a team thatincludes families and at least one topical expert. The draft interview protocolwould need to be piloted and revised.2. Administer interview – Staff may need to be assigned to conduct the interviewsand enter the responses into a database. The database would need to be developed.3. Analyze interview responses – At least one staff member will need to read throughall of the interviews to identify themes. Data will need to be cleaned and preparedfor analysis, then placed into tables that state and program staff can easily review.b. Review the frequency and quality of social emotional outcomes in the IFSPs.i.Questions that may be answered by this data collection –1. What percentage of children served have social emotional outcomes included onthe IFSP?2. Are teams writing high-quality social emotional outcomes?ii.Data collection method – record review of a sample of IFSPs pulled from the DataManagement System.iii.Benefits of data collection –1. Will provide information on the frequency and quality of IFSP outcomes aroundsocial emotional development.2. If social emotional outcomes on the IFSP are not high quality, it might point to anarea for improving practice.iv.Challenges of the data collection –1. State staff time will be required to complete the task.v.Estimated effort required –1. Develop a record review protocol. Depending on available resources this might bea simple adaptation of another tool or could be more time intensive if the tool isdeveloped from scratch.2. Use of staff resources to sample and pull the IFSPs for review.3. Use of staff time to complete the record review protocol for the selected records.4. Use of staff time to summarize and table the results of the review.Data quality considerations and potential solutionsa. The data currently collected on child disability are not complete, have not been updated as thechild moved through the program, and are inconsistently coded across regions. One activityin place to improve the quality of these data is sharing the reports of child outcomes bydisability with the local programs.b. Some of the assessments used to estimate children’s social emotional functioning are notsensitive to delays in this area, particularly in very young children. The state is working withprograms to identify and recommend assessments that are more appropriate.Documentation of the analysesa. Results of the analyses will be documented in separate files, with filenames inserted at theend of each hypothesis/question in this document.b. Decisions made to change the planned data analysis will be documented in the plan, includingthe date the change was made and the rationale behind it.March 2015
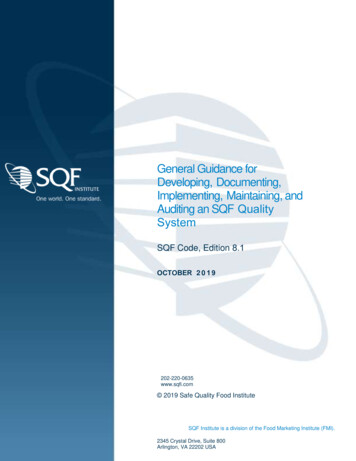
PLANNING, CONDUCTING, AND DOCUMENTING DATA ANALYSIS FOR PROGRAM IMPROVEMENTExample 2 – Data Analysis Plan and Documentation in Table FormatI.Broad data analysis of child outcomes (positive social skills and relationships; knowledge and skills; actions to meet needs)a. Purpose: used in conjunction with the infrastructure analysis to determine what result or cluster of results would be most justifiable asthe focus of the State Systemic Improvement Plan (SSIP).b. Objectives:i.Determine whether state results differ compared to national results for summary statement 1 (SS1) andsummary statement 2 (SS2).ii.Determine whether there are upward or downward trends in SS1 and SS2 for the state over the years for which data areavailable.iii.Determine whether children exhibit poorer performance on one of the outcomes as compared to the others on SS1 and SS2.iv.Note: If one of the child outcomes in the state differs from national results more than the others, shows a more notabledownward trend, and/or indicates poorer performance, that outcome could be a candidate for the State-Identified MeasurableResult (SIMR).c. Analysis planning and documentationAnalysis Description1. Compare state to nationalpercentages on SS1 & SS2for child outcomes (1 socialemotional, 2 knowledge &skills, 3 actions to meetneeds)2. Compare state to nationalpercentages for SS1 & SS2broken down by moderate andnarrow eligibility categories(i.e., ITCA eligibilitycategories; the state is closestto B-moderate & C-narrow)Results/Notes (include filenames)See [filename of data document/graphs/etc.].StatusCompletedFFY13/SFY14 Data indicate that the state is below the nation on all 3 outcomes for both SS1& SS2. Percentage point differences are as e [filename of data document/graphs/etc.].CompletedCategory B: FFY11/SFY12 data indicate the state is below ITCA eligibility category B statesfor SS1 OC1-SE, and higher for the other 2 outcomes. For SS2, the state is below ITCAeligibility category B states on all 3 outcomes. Percentage point differences are as follows:OC1-SE:OC2-KS:OC3-AN:SS1-3 2 3SS2-9-6-6Category C: FFY11/SFY12 data indicate the state is below ITCA eligibility category C statesfor SS1 OC1-SE, and higher for the other 2 outcomes. For SS2, the state is below ITCAeligibility category C states on all 3 areas. Percentage point differences are as follows:March 20157
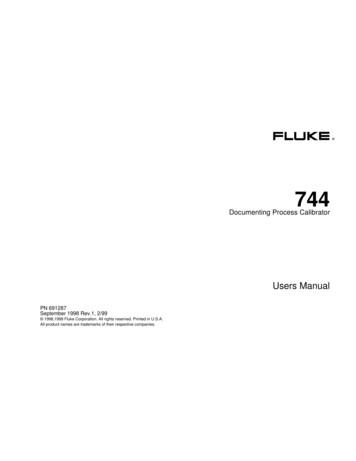
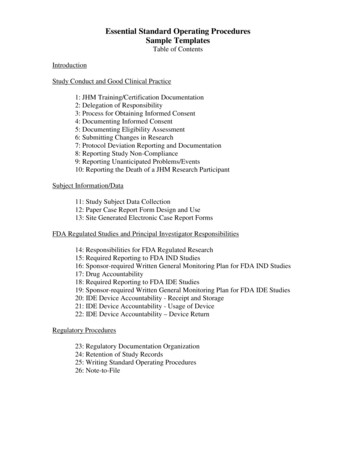
PLANNING, CONDUCTING, AND DOCUMENTING DATA ANALYSIS FOR PROGRAM IMPROVEMENTAnalysis Description3. Examine state trends fromFFY08-FFY12 in SS1 andSS2 for all 3 outcomesResults/Notes (include filenames)SS1SS2OC1-SE:-1-6OC2-KS: 3-3OC3-AN: 4-5See [filename of data document/graphs/etc.].StatusCompletedFor SS1, OC1 is below the other 2 outcomes for all 5 years, with FFY12 being slightly lowerthan FFY08. The only significant yearly difference was a drop from FY10-FY11 on OC2, andthe overall difference from FY08-FY12 was significantly lower for OC2. In the last 2 years,OC1 increased by 4 percentage points, while OC2 increased by 3, and OC3 decreased by 4.For SS2, OC1 is above the other 2 outcomes for all 5 years, and all 3 outcomes were lowerin FFY12 than in FFY08. The only significant yearly difference was a drop from FY10-FY11on OC2, and the overall difference from FY08-FY12 was significantly lower for OC2. In thelast 2 years, OC1 has increased by 5 percentage points, OC2 has remained steady, andOC3 has decreased by 2 percentage points.4. Determine whetherdifferences between years,across the entire FFY09FFY12 period, and over thelast 2 years were statisticallymeaningful at the p .10 level.II.8Qualitative information from providers suggests that SS2 might be inflated due to providerreluctance to give lower ratings if parents do not share the provider’s concern in that area.Used the meaningful differences calculator, results stored in [filename of datadocument/graphs/etc.].CompletedNote that the N for SS1 should be smaller than the N for SS2 given that the denominator forSS1 only includes OSEP progress categories a, b, c, & d, while the denominator for SS2 alsoincludes category e.d. Interpretation of data and SIMR decisioni.[include description about the ongoing statewide initiative focusing on social emotional development here]ii.[add in key points from above here]iii.State selected OC1, positive social relationships, as the broad focus of the SIMR.In-depth data analysis of positive social relationshipsa. Purpose: identify characteristics or subgroups that demonstrate better or poorer performance on OC1 that may suggest ways to refinethe SIMR, root causes for poor performance, and/or ideas for improvement strategies.b. Rationale: narrow the universe of child, provider, and program factors/characteristics to be analyzed to those that establish a morefocused SIMR and/or suggest root causes and/or improvement strategies.c. Analyses planning:i.Ask questionsMarch 2015
PLANNING, CONDUCTING, AND DOCUMENTING DATA ANALYSIS FOR PROGRAM IMPROVEMENTii.IssueData qualityMarch 20151. Are there concerns about data quality that limit our ability to interpret the data?2. What characteristics and other factors might be related to performance on the child outcome?a. Childb. Familyc. Providerd. Program3. What trends in the characteristics/factors above might be related to state performance on the child outcome?4. Is any information already known about the relationships between these characteristics/factors and child outcomes, ortrends in characteristics/factors that could influence state performance?5. Would additional information about these factors possibly identify one or more root causes that could be addressed withinthe time frame of the SSIP?6. What are the state’s hypotheses about what is driving differences in the child outcome across child, family, or programcharacteristics?7. What data are available in the state data system to answer questions about any of these hypothesized relationships?Develop hypothesesBrainstorm Implementation of COSprocess Rating done by single rateror team? Who are theraters?TrendsNo dataWhat is alreadyknown?No method forongoingrefreshers/newstaff.Anecdotally, SE(OC1) is the areapeople are leastcomfortablerating; “selfdoubt” in havingknowledge andexperience torate this area anddiscuss withfamilies(recognizingfamily cues;questions to ask).Data availableor additionalinfo needed? Need to collectdata on COSimplementationand training –programsurvey? Inter-raterreliability toolsfrom Part C in[STATENAME]Hypothesizedrelation to SEoutcomes?Data qualityvaries acrossprograms;depends on toolsused andproviderbackground andexpertise inrating thatparticular area.Hypothesizeddrivers ofdifferences?Uneven dataquality may drivedifferencesbetweensubgroups ofchildren.9
PLANNING, CONDUCTING, AND DOCUMENTING DATA ANALYSIS FOR PROGRAM IMPROVEMENTIssueCharacteristics/factorsBrainstorm Child– CAPTA vs non-CAPTA– Level/frequency ofservices (# of homevisits)– IFSP service types– Rural/urban– Age– Gender– Reason for eligibility– Reason for referral– Length of time enrolled– Who child lives with Provider– Service providerdiscipline– Training in SEdevelopment Program– Training on COS process– Assessment tools– Region– % of CAPTA kids inregionTrendsWhat is alreadyknown?Data availableor additionalinfo needed?Hypothesizedrelation to SEoutcomes?Hypothesizeddrivers ofdifferences?iii.III.From the hypotheses generated regarding the issues above, select those that 1) we think are most likely to be true and/or yieldactionable findings; 2) we have or can get the data needed to answer the questions; and 3) are most likely to identify one ormore root causes that could be addressed within the time frame of the SSIP.Analyses planning and documentationAnalysis Description1. Data quality:a. Completenessb. Compare the “out of rangevalues” of data for OC1 toOC2 & OC3 (i.e., 10% in10Results/Notes (include filenames)a. There is no variation in completeness of data across the 3outcomes in all 5 years of available data.b. See [filename of data document/graphs/etc., OSEPCategories worksheet]. Graph of OSEP categories indicatesno out of range data, but category e for SE is 36%,compared to 15% for action to meet needs and 10% forStatusa. Completeb. Complete – consider for qualitative datacollectionc. Consider which analyses to conductMarch 2015
PLANNING, CONDUCTING, AND DOCUMENTING DATA ANALYSIS FOR PROGRAM IMPROVEMENTAnalysis Descriptioncategory a; 65% in OSEPcategory e)c. Look at ratings of childrenbelow age 1 compared toolder children(completeness, out of rangevalues, and categorydistributions)Results/Notes (include filenames)knowledge and skills. This doesn’t reflect the anecdotalinformation that people have the most concerns aboutchildren in this area and don’t feel as well-prepared toaddress this area. Might be something to include in furtherdata gathering (program survey and/or conversations).c. Other states have shared that this is a struggle (accuratelyrating children age 1 in the SE area; see [STATE NAME]power point for potential analyses).Status2. Look at SS1 & SS2 stratifiedbya. Programb. Regionc. Program factorsd. Program comparison to state: see [filename of datadocument/graphs/etc., Program Level SS1 & SS2worksheet]. For OC1, 15 of the 43 programs are too small(N 10) for comparison to the state on SS1, and 14 are toosmall for SS2. For programs with N 10, 9 programs differedsignificantly from the state on SS1 (4 lower, 5 higher), and12 programs differed significantly from the state on SS2 (5lower, 7 higher). Six of the programs differed significantlyfrom the state on both SS1 and SS2 (all higher).e. Region:In process3. Look at OSEP ProgressCategories stratified by (e.g.,child, family, provider factors):March 201511
PLANNING, CONDUCTING, AND DOCUMENTING DATA ANALYSIS FOR PROGRAM IMPROVEMENTExample 3 – In
A data analysis plan provides descriptive information about the analyses a state is planning to conduct. The following elements should be included in the plan, keeping in mind the order may vary and . GuidanceTable.pdf Three examples below should assist states in planning, conducting, and documenting their data analysis findings and analytic .