Transcription
Texas Christian UniversityFall 2005 Fact BookPrepared by:Office of Institutional ResearchIR 05-50-1 (9/9/05)
OFFICE OFINSTITUTIONAL RESEARCHMISSION STATEMENTTo serve the Texas Christian Universitycommunity by providing higher orderresearch and timely, accurate data to supportinformed decision-making and campusassessment efforts in order to enhanceinstitutional effectiveness.
TEXAS CHRISTIAN UNIVERSITYQUICK REFERENCEFALL 2005 8,74941%59%84%16%14%4%Undergraduate me453995MinorityNonresident284F.T.E.6,825 7,17140%60%94%6%14%4%Graduate sidentF.T.E. Total sidentF.T.E.Entering freshmenMaleFemaleMinorityNonresidentTop 20% HS classEntering %51%39%61%14%6%1,61039%61%15%3%53%63098024147 1392487028388 38% 64% 10% 7%Geographic origin of undergraduatesTexas5,441 76%Out-of-state1,446 20%Foreign284 4%Geographic origin of entering freshmenTexas1,178 73%Out-of-state385 24%Foreign47 3%Undergraduates living on campus 46%Institutional Research 05-50-1 (9/9/05)Fall 2004 entering freshmenRetained Fall 200584%Total headcount by college/schoolHumanities & Social SciencesBusinessCommunicationEducationFine ArtsNursing & Health SciencesScience & EngineeringRanch ManagementExtended EducationGraduateBriteCredit hour productionUndergraduateGraduate 8,74919%17%12%4%5%10%13%1%1%14%4%114,212102,369 90%11,843 10%2003-2004 degrees ge faculty salariesProfessorsAssociatesAssistants1,987 77% 22% 1% 94,549 71,390 63,355Full-time facultyFemaleMinorityTenuredTerminal degreesEndowment - FY 5832046518859260418 40%13%56%90%950.0 million67.0 millionTotal operating revenues - Audit 2005216.9 millionT.C.U Brite 7.5 millionCost of attending T.C.U. - 2005-06Tuition and FeesRoom and BoardAverage annual cost 21,320 6,980 29,110(Includes Books; Excludes Travel/Miscellaneous Expenses)
This summary of material was compiled by the Office of Institutional Researchwith the assistance and input of various other offices. The purpose of this document isto serve as a ready reference which provides a point-in-time picture of Texas ChristianUniversity.The information included in this document is organized into seven major dataareas:Student Right-to-Know, Entering Freshman, Student, Academic Program,Faculty and Staff, Financial Resource, and Physical Facilities. Data based on theFall 2002 statistics have been combined and supplemented with historical data in eacharea. While most summaries are based on Fall statistics, some are based on the fiscalyear ended May 31, 2004.All data are compiled on the twelfth class day and are comparable from year-toyear; however, changes in methods of calculation may have occurred. Footnotes onspecific tables call attention to significant differences.Should you have questions or recommendations, contact the Office ofInstitutional Research, 204 Sadler, TCU Box 297020, Ext. 7793.DISTRIBUTION:ChancellorProvostVice ChancellorsAssociate Vice ChancellorsAssistant Vice ChancellorsDeansDirectorsAcademic Departments
Classification and Accreditations
TEXAS CHRISTIAN UNIVERSITYPEER COMPARISONSINSTITUTIONAL CHARACTERISTICSFALL 2005DateFounded2005 Basic esearch UniversityDisciples of ch University(high research activity)Master's Colleges and Universities(medium programs)Master's Colleges and Universities(larger programs)Research University(very high research activity)Research University(very high research activity)Research University(high research activity)Research University(high research activity)Research University(very high research activity)PEPPERDINE1937Doctoral/Research UniversityRICE1891SMU1911TULANE1834U of NOTRE DAME1842VANDERBILT1873WAKE FOREST1834Research University(very high research activity)Doctoral/Research UniversityResearch University(very high research activity)Research University(very high research activity)Research University(very high research activity)Research University(high research activity)InstitutionalAccreditationUS NewsRankingAssessmentScale 1 - 5Southern Association (SACS)972.7BaptistSouthern Association (SACS)783.2Roman CatholicNorth Central Association (NCA)14.1NoneNorth Central Association (NCA)43.9MethodistSouthern Association (SACS)54.6MethodistSouthern Association (SACS)204.0NoneMiddle States Association (MSA)323.2Roman CatholicNorth Central Association (NCA)852.9NoneNorth Central Association (NCA)124.4Church of ChristWestern Association (WASC)553.1NoneSouthern Association (SACS)174MethodistSouthern Association (SACS)713.1NoneSouthern Association (SACS)433.5Roman CatholicNorth Central Association (NCA)183.9NoneSouthern Association (SACS)184NoneSouthern Association (SACS)273.5Sources: "US News and World Report, America's Best Colleges 2006 " and "2002 Higher Education Directory" and Carnegie Classificationof Institutes of Higher Education 2005. For additional information, please visit the Carnegie Classification website athttp://www.carnegieclassification-preview.org .* "Ranking" and "Reputation score" for all but Creighton and Drake are cited from "National Universities - Doctoral" while "Ranking"and "Reputation scores" are cited from "Midwestern Universities - Master's" for Creighton and Drake.1Institutional Research 05-50-1 (9/9/05)
2TEXAS CHRISTIAN UNIVERSITYBASIC CARNEGIE CLASSIFICATIONTexas Christian University has a 2005 Basic Carnegie Classification ofDoctoral/Research University. This is the result of a new classificationsystem developed by the Carnegie Foundation, and the classifications arebased on data from 2003 and 2004.For additional, more detailedinformation on the new Carnegie Classification system, please visit theCarnegie Classification website at http://carnegieclassification-preview.org.IR 05-50-1 (9/9/05)
3TEXAS CHRISTIAN UNIVERSITYACCREDITATIONSFALL 2005UNIVERSITY:Southern Association of Colleges and SchoolsCOLLEGE/SCHOOL:Humanities &Social SciencesFoundation for Interior Design Education and Research (Interior DesignProgram in the Department of Design, Merchandising, and Textiles)BusinessAssociation to Advance Collegiate Schools of Business (School of Business atthe undergraduate and graduate levels, and the Department of Accounting)CommunicationAccrediting Council on Education in Journalism and Mass Communication(Journalism, Broadcast Journalism)EducationSouthern Association of Independent Schools (Starpoint School)Fine ArtsNational Association of Schools of Music (School of Music)Nursing & HealthSciencesASHA Council on Academic Accreditation (Department of CommunicationSciences and Disorders)Board of Nurse Examiners for the State of Texas (BNE)Commission on Accreditation for Allied Health Education Programs (AthleticTraining Program)Commission on Collegiate Nursing Education (CCNE)Council on Accreditation of Nurse Anesthesia Educational Programs (COA)Council on Social Work Education (CSWE)Science & EngineeringUniversity Programs:Master of Liberal ArtsBriteAccreditation Board for Engineering and Technology (Engineering)American Chemical Society (Chemistry)Commission on Accreditation for Dietetics Education of The American DieteticAssociation (Coordinated Program in Dietetics, Didactic Program in Dietetics)Computing Accreditation Commission of the Accreditation Board forEngineering and Technology (B. S. in Computer Science)Association of Graduate Liberal Studies ProgramsAmerican Association of Pastoral Counselors (Pastoral Care and TrainingCenter)The Association of Theological Schools in the United States and Canada (BriteDivinity School)Institutional Research 05-50-1 (9/9/05)
Student Right-to-Know Data
4TEXAS CHRISTIAN UNIVERSITYCRIME STATISTICSJANUARY 1, 2004 - DECEMBER 31, 2004(With Comparative Data for January 1, 2002 - December 31, 2003)TYPE OF CRIME200220032004NUMBER OF ON-CAMPUS INCIDENTSOFFENSESMurder/Non-negligent Manslaughter---Forcible Sex Offenses1-2Non-forcible Sex Offenses---Robbery---Aggravated Assault2-1231616Motor Vehicle Theft7913 **Arson1-2Negligent Manslaughter---Murder/Non-negligent Manslaughter---Forcible Sex Offenses---Non-forcible Sex Offenses---Robbery---Aggravated Assault---Burglary---Motor Vehicle Theft---Arson---Negligent Manslaughter---BurglaryHATE OFFENSESOTHER OFFENSES*Liquor Law Violations*Drug Law Violations25124437661117Weapons Law Violations* Represents judicial referrals for alcohol-related incidents including arrests.** 7 of the 13 reported motor vehicle thefts were golf carts.SOURCE: Campus Security Information and Crime StatisticsInstitutional Research 05-50-1 (9/9/05)-
TEXAS CHRISTIAN UNIVERSITYGRADUATION RATES WITHIN 150% OF NORMAL TIME*ENTERING FRESHMAN CLASSFALL 1995(As reported to NCAA in compliance with the Student Right-to-Know Act)AMERICAN INDIANORALASKAN NATIVEASIAN NICHISPANICMFMFMFMFTOTAL ENTERING FRESHMAN 91053%271659%341235%553360%42826662%TOTAL ENTERING FRESHMAN CLASSATHLETES RECEIVING FINANCIAL 2150%000%BY CK/CROSS COUNTRY:EnrolledGraduatedRateMFTOTAL ALL 50%OTHER SPORTS (GOLF, SWIMMING, aduation within 150% of normal time for the 1995 entering freshman class defined as all who graduated as of August 2001.5Institutional Research 05-50-1 (9/9/05)
TEXAS CHRISTIAN UNIVERSITYGRADUATION RATES WITHIN 150% OF NORMAL TIME*ENTERING FRESHMAN CLASSFALL 1996(As reported to NCAA in compliance with the Student Right-to-Know Act)AMERICAN INDIANORALASKAN NATIVEMTOTAL ENTERING FRESHMAN CLASSEnrolledGraduatedRateTOTAL ENTERING FRESHMAN CLASSATHLETES RECEIVING FINANCIAL AIDEnrolledGraduatedRateFASIAN NICHISPANICOTHERTOTAL ALL ROSS 00100%OTHER SPORTS (GOLF, SWIMMING, 00%77100%BY A161275%*Graduation within 150% of normal time for the 1996 entering freshman class defined as all who graduated as of August 2002.6Institutional Research 05-50-1 (9/9/05)
TEXAS CHRISTIAN UNIVERSITYGRADUATION RATES WITHIN 150% OF NORMAL TIME*ENTERING FRESHMAN CLASSFALL 1997(As reported to NCAA in compliance with the Student Right-to-Know Act)AMERICAN INDIANORALASKAN NATIVEMTOTAL ENTERING FRESHMAN CLASSEnrolledGraduatedRateTOTAL ENTERING FRESHMAN CLASSATHLETES RECEIVING FINANCIAL AIDEnrolledGraduatedRateFASIAN NICHISPANICTOTAL ALL 11100% 100%TOTALBY dRate000%TRACK/CROSS 00%000%000%000%100%000%000%100%100%200%OTHER SPORTS (GOLF, SWIMMING, 00%000%*Graduation within 150% of normal time for the 1997 entering freshman class defined as all who graduated as of August 2003.7Institutional Research 05-50-1 (9/9/05)
TEXAS CHRISTIAN UNIVERSITYGRADUATION RATES WITHIN 150% OF NORMAL TIME*ENTERING FRESHMAN CLASSFALL 1998(As reported to NCAA in compliance with the Student Right-to-Know Act)AMERICAN INDIANORALASKAN NATIVETOTAL ENTERING FRESHMAN CLASSEnrolledGraduatedRateTOTAL ENTERING FRESHMAN CLASSATHLETES RECEIVING FINANCIAL AIDEnrolledGraduatedRateASIAN %100%000%000%000%000%TOTAL ALL 2074%BY ed0Rate0%TRACK/CROSS COUNTRY:Enrolled0Graduated0Rate0%OTHER SPORTS (GOLF, SWIMMING, TENNIS):Enrolled0Graduated0Rate0%*Graduation within 150% of normal time for the 1998 entering freshman class defined as all who graduated as of August 2004.8Institutional Research 05-50-1 (9/9/05)
Entering Freshman Data
9TEXAS CHRISTIAN UNIVERSITYPEER COMPARISONSENTERING FRESHMAN DATAFALL 2004HighSchoolRankingTop ETTENORTHWESTERNPEPPERDINERICESMUTULANEU of NOTRE DAMEVANDERBILTWAKE -14401240-1410Source: "US News and World Report, America's Best Colleges 2006 "U. S. Department of Education, National Center for Educators Statistics,Integrated Postsecondary Education Data System (IPEDS), Fall 2004*Creighton & Drake report percentage in top 25% of high school class.Institutional Research 05-50-1 (9/9/05)25th-75thPercentileSAT/ACT
TEXAS CHRISTIAN UNIVERSITYFRESHMAN ADMISSIONSFALL 2001 - FALL D20042005ENROLLED10Institutional Research 05-50-1 (9/9/05)2003
TEXAS CHRISTIAN UNIVERSITYADMISSIONS STATISTICSFALL 2005(With Comparative Data for Fall 2001 - Fall 1,8313,1404,9711,9403,2135,1532,0463,425ENTERING FRESHMEN% Accepted71.9%YieldEnrolled 7.1%31.2%29.2% ed ConditionalTOTAL ENROLLEDFRESHMENENTERING TRANSFERS792% .7%51.2%49.1% *TOTAL 411139249388NOTES: 1. Students admitted during the Summer are included in the Fall headcount.2. Transfer student headcount includes students who changed status from nondegree to degree-seeking.3. The yield is based on the number of enrolled freshmen or transfer students compared to the number of accepted freshmen or transfer students.* The yield perecentages for freshmen and transfers for Fall 2005 exclude the hurricane Katrina students (14 freshmen and 28 transfers).11Institutional Research 05-50-1 (9/9/05)
TEXAS CHRISTIAN UNIVERSITYPERCENTILE RANKINGS OF FRESHMEN FROMPUBLIC AND PRIVATE HIGH SCHOOLSFALL 2005(With Comparative Data for Fall 2001 - Fall 2004)415450400350304262300250200150591002950881 - 10%11 - 20%120PRIVATEBelow 50%PUBLIC12Institutional Research 05-50-1 (9/9/05)21 - 50%
TEXAS CHRISTIAN UNIVERSITYPERCENTILE RANKINGS OF FRESHMEN FROMPUBLIC AND PRIVATE HIGH SCHOOLSFALL 2005(With Comparative Data for Fall 2001 - Fall 2004)High School ClassPercentile RankingFALL 2001MFTFALL 2002MFTFALL 2003MFTFALL 2004MFTFALL 2005MFT1 - 10%PublicPrivate104 266100 26244370 32%362894 21791 21235311 28%3038108 278104 27147386 33%37511101 27397 27043374 32%367786 22683 22135312 28%304811 - 20%PublicPrivate97 19490 1837 11291 25%2731899 18996 18039288 26%2761285 20480 1905 14289 24%2701993 21893 207- 11311 26%3001185 18584 17817270 25%262821 - 50%PublicPrivate207 228197 20910 19435 39%40629187 264178 2479 17451 41%42526192 257181 23411 23449 38%41534211 229195 21216 17440 37%40733201 243188 22713 16444 41%41529Below 50%PublicPrivateTotal PublicTotal PrivateTOTALNot Computed/Foreign39318871418 66129473894%1,079 94%3564447 6961,1436%37122184399 657226352115%1,056 95%3557421 6921,1133385%4236619172401 71226615385%1,113 94%4672427 7581,1854116%3432223176417 70622574985%1,123 95%3759439 7431,1824255%3833533267388 652227159126%1040 95%3557410 68710975%51313Institutional Research 05-50-1 (9/9/05)41347
14TEXAS CHRISTIAN UNIVERSITYTEST SCORE RANGES FOR ENTERING FRESHMENFALL 2005(With Comparative Data for Fall 2001 - Fall 2004)20012002200320042005N 933N 937N 1,08325th Percentile52051052053052075th Percentile62062062063063025th Percentile53052054055054075th Percentile64063064064064025th Percentile1060105010801080108075th Percentile12401240125012601260N 537N 511N 511N 481N 49525th Percentile232123232375th Percentile2827282828N 1,121 N 1,107SAT-VerbalSAT-MathSAT CompositeACT CompositeNOTE: Score ranges are based on admitted test scores for each student.International students are required to report eitherTOEFL, SAT, or ACT. Those who reported SAT or ACTare included; those who reported TOEFL are not.Institutional Research 05-50-1 (9/9/05)
15TEXAS CHRISTIAN UNIVERSITYDISTRIBUTION OF FRESHMEN BY COLLEGE/SCHOOLFALL 2005SE17%AS27%HS10%FA7%ED5%MHUMANITIES & SOCIAL SCIENCESFALL 2003FT168348% of TotalBUSINESS17612137113964% of Total35682971507310316122138213136169% of Total31937Institutional Research 05-50-1 911010691713103675992 8024%5%3642827%10%20%1,005 1,005FALL 2005FT22%9%150483M30%6%% of TotalTOTAL3135%% of TotalSCIENCE & ENGINEERING1709%EDUCATIONNURSING & HEALTH SCIENCESFALL 2004FT19%% of TotalFINE ARTS516M32%% of TotalCOMMUNICATIONBU24%CO10%15328217%630980 1,610
Student Data
16TEXAS CHRISTIAN UNIVERSITYPEER COMPARISONSUNDERGRADUATE DATAFALL SMUTULANEU of NOTRE DAMEVANDERBILTWAKE emalePercentOut ofStatePercentLiving OnCampusPercentFrom PublicHigh School40% 51%Source: US News and World Reports, America's Best Colleges 2006, Princeton Review, variousunviersity administrative offices, and U.S. Department of Education, National Center for EducationStatistics, Integrated Postsecondary Education Data System (IPEDS), Fall 2004.Institutional Research 05-50-1 (9/9/05)
17TEXAS CHRISTIAN UNIVERSITYENROLLMENT HISTORYFALL 2005(With Comparative Data for Fall 1995 - Fall 2004)TOTAL 66647491,4138,141Institutional Research 05-50-1 (9/9/05)TOTAL2003
18TEXAS CHRISTIAN UNIVERSITYENROLLMENT HISTORYFALL 2005(With Comparative Data for Fall 1995 - Fall 84537,171Institutional Research 05-50-1 (9/9/05)
19TEXAS CHRISTIAN UNIVERSITYHEADCOUNT ENROLLMENT BY COLLEGE/SCHOOLFALL 2005(With Comparative Data for Fall 2003 - Fall 2004)200320042005ADDRAN COLLEGE OFHUMANITIES & SOCIALSCIENCES1,72521%1,73120%1,62819%M.J. NEELEYSCHOOL OF BUSINESS1,46818%1,47717%1,53818%COLLEGE OFCOMMUNICATION87110%95011%1,02312%SCHOOL OFEDUCATION3905%3975%3924%COLLEGE OFFINE ARTS4636%4625%4695%HARRIS COLLEGE OFNURSING & HEALTHSCIENCES7629%84210%88810%COLLEGE OF SCIENCE& ENGINEERING1,09513%1,16513%1,11813%RANCH 1,25814%2813%3003%3204%EXTENDED EDUCATIONGRADUATEBRITEUNIVERSITY TOTAL7,994* - less than 1%Institutional Research 05-50-1 (9/9/05)8,6328,749
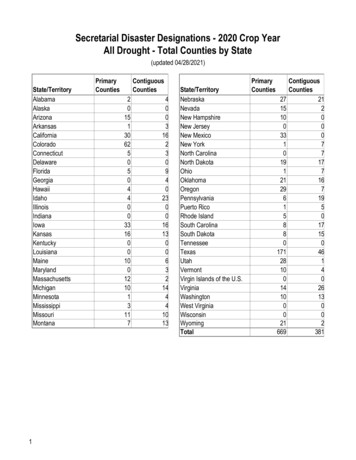
20TEXAS CHRISTIAN UNIVERSITYETHNIC DISTRIBUTION OF STUDENT HEADCOUNTFALL 2005(With Comparative Data for Fall 2001 - Fall 6.3%20012002200320042005% of Total480.6%370.5%410.5%450.5%500.6%% of Total1471.8%1582.0%1642.0%1702.0%1762.0%% of Total3924.9%4165.2%4555.5%4705.4%4535.2%% of Total4545.6%4725.8%5066.1%5256.1%5436.2%% of 76.3%% of Total3374.2%3083.8%3694.5%3944.6%4775.4%% of Total4375.4%4055.0%3934.7%3894.5%3764.3%AMERICAN AL ENROLLMENTInstitutional Research 05-50-1 (9/9/05)8,0548,0748,2758,6328,749
21TEXAS CHRISTIAN UNIVERSITYETHNIC UNDERGRADUATE/GRADUATE DISTRIBUTIONOF STUDENT HEADCOUNTFALL HITE73%UNDERGRADUATEAMERICAN 3HISPANIC46083543TOTAL 764.3%TOTAL ENROLLMENTInstitutional Research 05-50-1 (9/9/05)7,1711,5788,749
TEXAS CHRISTIAN UNIVERSITYAGE DISTRIBUTION OF HEADCOUNT ENROLLMENTFALL 2005UndergraduateDegreeSeekingAGE CATEGORYUnder 1818 - 1920 - 2122 - 24#112,5302,8231,308%TOTAL UNDER 2525 - 2930 - 3435 - 3940 - 4950 - 6465 6,67219264455724-95%38225%*TOTAL 25 1151,25832021333239AVERAGE AGETOTALBrite s than 1%.22Institutional Research 05-50-1 (9/9/05)
TEXAS CHRISTIAN UNIVERSITYDISTRIBUTION OF HEADCOUNTBY RELIGIOUS AFFILIATIONFALL 2005Unknown13%Roman Catholic13%Methodist12%No Preference17%Baptist12%Christian 25Baptist1,005Christian 46No al Research 05-50-1 (9/9/05)Presbyterian4%Roman Catholic
TEXAS CHRISTIAN UNIVERSITYGEOGRAPHIC SOURCE OF UNDERGRADUATE STUDENTSFALL 151 51 - 1000 - 5024Institutional Research 05-50-1 (9/9/05)101 - 150
25TEXAS CHRISTIAN UNIVERSITYGEOGRAPHIC SOURCE OF UNDERGRADUATE STUDENTSFALL 2005(With Comparative Data for Fall 2001 - Fall OCONNECTICUTDELAWAREDISTRICT OF KANEVADANEW 471333815857381Institutional Research 05-50-1 3710739122312611943141011223115374121
26TEXAS CHRISTIAN UNIVERSITYGEOGRAPHIC SOURCE OF UNDERGRADUATE STUDENTSFALL 2005(With Comparative Data for Fall 2001 - Fall 2004)(continued)NEW JERSEYNEW MEXICONEW YORKNORTH CAROLINANORTH DAKOTAOHIOOKLAHOMAOREGONPENNSYLVANIARHODE ISLANDSOUTH CAROLINASOUTH EST 42305,0088122275398OTHER TERRITORIESPUERTO RICOVIRGIN ISLANDSSUBTOTALFOREIGN STUDENTSTOTAL ENROLLMENTTEXAS AS % OF TOTALFOREIGN AS % OF 0%74.0%75.7%75.9%4.5%4.3%4.1%4.0%4.0%Institutional Research 05-50-1 (9/9/05)
TEXAS CHRISTIAN UNIVERSITYHOUSING OCCUPANCY TOTALSFALL 2005(With Comparative Data for Fall 2001 - Fall 2004)Actual Occupancy. . . . . .MALE. . . . . . .TotalGeneral Greek. . . . . .FEMALE. . . . . . .GeneralGreekTotalTOTAL% OFUNDERGRADUATESLIVING ON TE:Percent of undergraduates living on campus based on those taking 9 or more hours.SOURCE: Office of Residential Services, Fall 2005 Occupancy Report27Institutional Research 05-50-1 (9/9/05)
TEXAS CHRISTIAN UNIVERSITYINTERCOLLEGIATE AND RECREATIONAL SPORTSFALL 2005. . INTERCOLLEGIATE SPORTS. occerSwimming/DivingTennisTrack & FieldVolleyballMALESSSSSSSS. . . . . . . . . . . . . . . RECREATIONAL SPORTS PROGRAMS. . . . . . . . . . . . . . .FEMALE INTRAMURAL SPORTSFlag FootballSIndoor VolleyballSPunt, Pass & KickRacquetballSSoccer (indoor)STable TennisSTeam TennisSBasketball - 5 on 5SNFL Fantasy FootballSNFL Pick'emS"No-Limit Texas Hold'em"Thursday Night Poker LeagueSoftballSPORTS CLUBSBaseballGymnasticsInline HockeyLacrosse - MenLacrosse - WomenPaintballPolo ClubRugbySoccer - MenUltimate FrisbeeVolleyball - MenWrestlingSPECIAL PROGRAMAquaticsChallenge CourseClimbing WallCamping Equiment RentalsFITNESS & WELLNESSUnity Wellness ProgramMetobolic AnalystNutrition ConsultationWeight Room OrientationFitness AssessmentMassage TherapyPersonal TrainingTOURNAMENTS/MEETSBasketball - 3 on 3BowlingDodgeballFlag FootballTable TennisTrack MeetNo-Limit Texas Hold'em Poker TournamentS Scholarship offered in sportSOURCES: 1. Intercollegiate information from Department of Athletics.2. Recreational sports information from Office of Recreational Sports.28Institutional Research 05-50-1 (9/9/05)
Academic Program Data
29TEXAS CHRISTIAN UNIVERSITYPEER COMPARISONSACADEMIC PROGRAM DATAFALL ENORTHWESTERNPEPPERDINERICESMUTULANEU of NOTRE DAMEVANDERBILTWAKE aduateEnrollmentClasses %86%2004Classes 50Grad RateSources: "US News and World Report, America's Best Colleges 2006 "U.S. Department of Education, National Center for Education Statistics,Integrated Postsecondary Education Data System (IPEDS), Fall 2004.* Reported as "Average Graduation Rate" rather than "2004 Actual Graduation Rate".Institutional Research 05-50-1 (9/9/05)**
30TEXAS CHRISTIAN UNIVERSITYSECTION SIZE AND AVERAGE CLASS SIZEFALL 2005AVERAGECLASSTOTALSIZE. . . . . . . . ENROLLMENT. . . . . . . . .COURSE LEVEL1-1011-2021-3031 1000026103751773813520
TEXAS CHRISTIAN UNIVERSITY PEER COMPARISONS INSTITUTIONAL CHARACTERISTICS FALL 2005 Date US News Founded Ranking TCU 1873 Disciples of Christ Southern Association (SACS) 97 2.7 BAYLOR 1845 Baptist Southern Association (SACS) 78 3.2 CREIGHTON 1878 Roman Catholic North Central Association (NCA) 1 4.1 DRAKE 1881 None North Central Association (NCA) 4 3.9 DUKE 1838 Methodist Southern Association .