Transcription
CMT LEVEL I2020 ExamInformation and SamplesStanley Dash, CMTCMT Program Director
Level I. An Introduction to Technical AnalysisThe following sample CMT Level I questions offer a glimpse into the style and scope of theexam. Each of the sample questions is followed by a relevant excerpt and citation fromthe 2020 CMT Level I curriculum. These 15 samples are by no means a study guide;instead, consider them a taste of what a Level I candidate will learn to master thissegment of the body of knowledge.Important points to note The CMT Level I exam tests on introductory concepts and definitions in technicalanalysis. The actual exam consists of 132 multiple-choice questions of which 120 are scoreditems. The remaining 12 questions are under trial for future use. Candidates have two hours to complete the 132 questions on the exam. The exam is delivered on a computer in Prometric testing facilities. Please be sureto schedule your exam well in advance. Questions on the Code of Ethics and Standards of Professional Conduct appear onall three levels of the CMT exams. The Standards of Practice Handbook is avaluable study guide for the Code and Standards. Please use those documents asethics are not otherwise included in the CMT Program textbooks. The CMT Association maintains a discussion forum for CMT candidates.Candidates are encouraged to utilize this resource to discuss and clarify theirunderstanding of the subject matter. 2020 CMT Association, Inc.
Knowledge Domain: Theory and History1. According to the work of Charles Dow and his successors, now referred to as DowTheory, which of the following is NOT a hypothesis for the nature of markets andtechnical analysis?A.B.C.D.The primary trend is inviolate.The averages discount everything.Dow Theory is not infallible.Prices move at random.“Rhea presented three hypotheses:1. The primary trend is inviolate.2. The averages discount everything.3. Dow Theory is not infallible.-- Kirkpatrick and DahlquistCMT Level I Curriculum (2020), Chapter 2, page 17Learning Objective: Discuss the basic principles of Dow TheoryD. Prices move at random.2. In relation to the principles of technical analysis, the phrase “patterns are fractal”refers to the assumption thatA.B.C.D.patterns tend to break existing trends.Mandelbrot originated the concept of chart patterns.pattern analysis is universal and independent of time.chart patterns found in an intraday chart can generate signals in a daily chart.“This ability for trends to act similarly over different periods is called their fractalnature. Fractal patterns or trends exist in nature along shorelines, in snowflakes, andelsewhere. For example, a snowflake is always six-sided—having six branches, if youwill. The trading markets are similar in that any period we look at—long, medium, orvery short—produces trends with the same characteristics and patterns as each other.Thus, for analysis purposes, the length of the trend is irrelevant because the technicalprinciples are applicable to all of them. The trend length of interest is determinedsolely by the investor’s or trader’s period of interest.”-- Kirkpatrick and DahlquistCMT Level I Curriculum (2020), Chapter 1, page 9Learning Objective: Define “fractal” as used in describing price actionC. pattern analysis is universal and independent of time. 2020 CMT Association, Inc.
Knowledge Domain: Market Indicators3. The TRIN, or Arms Index, is calculated byA. dividing total specialist short sales by total short sales.B. subtracting the 26-day simple moving average from the 12-day simple movingaverage.C. subtracting the advance/decline ratio by the ratio of advancing volume todeclining volume.D. dividing the advance/decline ratio by the ratio of advancing volume to decliningvolume.“One of the most popular up and down volume indicators is the Arms Index, created byRichard W. Arms, Jr. (winner of the MTA 1995 Annual Award). The Arms Index (Arms,1989), also known by its quote machine symbols of TRIN and MKDS, measures therelative volume in advancing stocks versus declining stocks. When a large amount ofvolume in declining stock occurs, the market is likely at or close to a bottom.Conversely, heavy volume in advancing stocks is usually healthy for the market. TheArms Index is actually a ratio of two ratios, as follows:Arms Index (Advances / Declines) / (UpVolume / DownVolume)The numerator is the ratio of the advances to declines, and the denominator is the ratioof the up volume to the down volume.”-- Kirkpatrick and DahlquistCMT Level I Curriculum (2020), Chapter 14, page 331Learning Objective: Describe other measures of internal stock-market strengthsuch as McClellan’s calculationsD. dividing the advance/decline ratio by the ratio of advancing volume todeclining volume. 2020 CMT Association, Inc.
4. If the VIX is quoted at 20, it indicates the market is expecting a movement of aboutpercent over the next 30 days.A.B.C.D.3.775.773.335.07“To determine the anticipated 30-day movement of the stock market as defined by theVIX involves dividing the VIX by the square root of 12. The square root of 12 is aconvenient number as 30 days is the average month and there are 12 months in theyear. In a similar manner to breaking down what implied volatility was indicating aboutmovement in Amazon stock, the VIX may be used to determine the anticipated 30-daymove for the S&P 500. If the VIX is quoted at 20, the result would be the marketexpecting movement of about 5.77 percent over the next 30 days. Following theformula for determining 30-day market movement, the math would be:5.77% 20/3.46”-- RhoadsCMT Level I Curriculum (2020), Chapter 26, page 443Learning Objective: State how to calculate expected 30-day market movementB. 5.77 2020 CMT Association, Inc.
Knowledge Domain: Construction5. When analyzing long term price movements, it could be helpful to use chart.A.B.C.D.a logarithmica candlestickan EquiVolumea point and figure“Although the arithmetic scale is the scale most often used, sometimes adjustmentsneed to be made, especially when observing long-term price movements. On thearithmetic scale a 10 price movement is visually the same whether it is a move from 50 to 60 or a move from 100 to 110. This type of scale can be somewhatdeceptive; a 10 move is much more significant to an investor if the price of a securityis 50 than if the price of the security is 100. The logarithmic scale addresses thisissue. On the logarithmic scale, the vertical distance represents the same percentagechange in price. The rule of thumb for when to use an arithmetic or logarithmic scaleis that when the security’s price range over the period being investigated is greaterthan 20%, a logarithmic scale is more accurate and useful. As a rule, the truly longterm charts (more than a few years) should always be plotted on logarithmic scales.”-- Kirkpatrick and DahlquistCMT Level I Curriculum (2020), Chapter 3, page 42Learning Objective: Explain the differences between arithmeticand logarithmic scales and their usesA. a logarithmic 2020 CMT Association, Inc.
Knowledge Domain: Trend Analysis6. An exponential moving averageA.B.C.D.gives more weight to the most recent observation.gives less weight to the most recent observation.gives equal weight to all observations.does not suffer from any lag.“ in certain situations, the most recent stock price may have more bearing on thefuture direction of the stock than the ten-day old stock price does. If observations thatare more recent contain more relevant information than earlier observations, we wantto weight data in favor of the most recent observation. By calculating a weightedmoving average, the most recent day’s information is weighted more heavily. Thisweighting scheme gives the most recent observation more importance in the movingaverage calculation.”-- Kirkpatrick and DahlquistCMT Level I Curriculum (2020), Chapter 6, page 105Learning Objective: Explain how to calculate simple, linearly weightedand exponentially smoothed moving averagesA. gives more weight to the most recent observation. 2020 CMT Association, Inc.
7. Violated support levels typicallyA.B.C.D.lose importance after three weeks.indicate an imminent price reversal.lose importance after three months.become resistance.“The concept of support and resistance presumes that in the future prices will stop atthese recorded levels or zones and that they represent a remembered psychologicalbarrier for prices. The zones will carry through time and become barriers to futureprice action. Not only will the zones carry through time, but once they are brokenthrough, they will switch functions. Previous support will become resistance, andprevious resistance will become support.”-- Kirkpatrick and DahlquistCMT Level I Curriculum (2020), Chapter 4, page 54Learning Objective: Describe the concept of support and resistance,and the underlying psychologyD. become resistance. 2020 CMT Association, Inc.
8. A narrowing of Bollinger Bands normally indicates thatA.B.C.D.a stock is ready for a rally.a stock is ready for a decline.a stock’s volatility has increased.a stock’s volatility has decreased.“Bands are also envelopes around a moving average but, rather than being fixed insize, are calculated to adjust for the price volatility around the moving average. They,thus, shrink when prices become calm and expand when prices become volatile. Themost widely used band is the Bollinger Band, named after John Bollinger (2002).”-- Kirkpatrick and DahlquistCMT Level I Curriculum (2020), Chapter 6, page 118Learning Objective: List common envelope, channel, andband indicators and their characteristicsD. a stock’s volatility has decreased. 2020 CMT Association, Inc.
Knowledge Domain: Chart and Patterns9. A breakaway gap usuallyA.B.C.D.provides a major divergence signal.signals the beginning of a new trend.occurs at the end of an important price move.occurs during the accumulation phase of the market cycle.“ prices suddenly break through a formation boundary and a major change in trenddirection begins. Breakaway gaps signal that a pattern is completed and a boundarypenetrated.”-- Kirkpatrick and DahlquistCMT Level I Curriculum (2020), Chapter 8, page 163Learning Objective: Describe the types of gaps that occuron price charts and their significanceB. signals the beginning of a new trend.10. A flag is generally formed by a in a bull market or a in a bear market.A.B.C.D.rally, pullbackrally, correctioncorrection, rallycorrection, throwback“Flags and pennants are really variations of the same formation. The flag is a shortchannel that usually slopes in the opposite direction from the trend.”-- Kirkpatrick and DahlquistCMT Level I Curriculum (2020), Chapter 7, page 153Learning Objective: Identify “half-mast” chart patterns such as flags and pennantsC. correction, rally 2020 CMT Association, Inc.
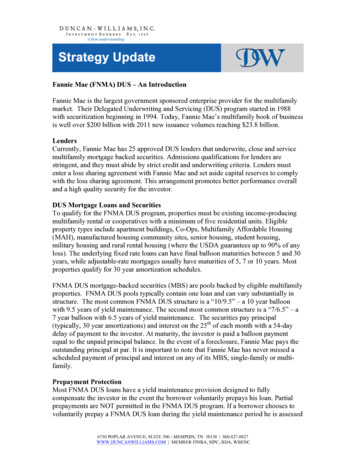
11. Identify the chart formation below.A.B.C.D.triple toprising wedgerounding tophead and shoulders top“The head-and-shoulders pattern is probably the most famous technical pattern. Itsname is often used when ridiculing technical analysis, yet its profitability is high,relative to other patterns, and it is one of the few that the Lo, Mamaysky, and Wang(2000) study showed had statistical significance.The head-and-shoulders top pattern is a series of three well-defined peaks, eithersharp or rounded. The second peak is higher than the first and third peak. This middle,higher peak is called the head. The first peak is called the left shoulder, and the thirdpeak is called the right shoulder. Both the left and right shoulders must be lower thanthe head, but the two shoulders do not have to be the same height.”-- Kirkpatrick and DahlquistCMT Level I Curriculum (2020), Chapter 7, page 150-151Learning Objective: Identify rounding chart patterns such as head-and-shouldersD. head and shoulders top 2020 CMT Association, Inc.
Knowledge Domain: Confirmation12. The basis of On-Balance-Volume (OBV) is the belief thatA.B.C.D.price precedes volume.volume precedes price.volume matters most during breakouts.volume and price are typically coincident indicators.“How can the OBV be used in prices that are in a consolidation pattern or tradingrange rather than trending? When prices are in a trading range and the OBV breaks itsown support or resistance, the break often indicates the direction in which the pricebreakout will occur. Therefore, it gives an early warning of breakout direction from aprice pattern.”-- Kirkpatrick and DahlquistCMT Level I Curriculum (2020), Chapter 9, page 211Learning Objective: List the major indexes and oscillatorsdesigned to use volume as confirmationB. volume precedes price.13. The stochastics indicator measuresA.B.C.D.where today’s typical price fits into the recent trading range.the distance in percentage between the first and last values over n-days.the relative position of the closing price within a past high-low range.the relative strength of the current price movement as it increases from 0 to 100.“The stochastic . looks at the most recent close price as a percentage of the pricerange (high to low) over a specified past “window” of time. This makes it sensitive torecent action.”-- Kirkpatrick and DahlquistCMT Level I Curriculum (2020), Chapter 9, page 232Learning Objective: Identify characteristics and applications of indexesand oscillators such as MACD, RSI, and stochasticsC. the relative position of the closing price within a past high-low range. 2020 CMT Association, Inc.
Knowledge Domain: Selection and Decision14. A rising relative strength line for a stock in a falling market indicates thatA.B.C.D.price and volume are diverging.the stock is performing worse than the market.the stock is performing better than the market.it may be moving into an overbought state.“By using ranks that measure relative strength, the co-movement of stocks is filteredout.”-- LevyCMT Level I Curriculum (2020), Chapter 41,
The CMT Level I exam tests on introductory concepts and definitions in technical analysis. The actual exam consists of 132 multiple-choice questions of which 120 are scored items. The remaining 12 questions are under trial for future use. Candidates have two hours to