Transcription
Fiduciary Management Small Cap Equity Q12022 Investment LetterApr. 15, 2022 10:41 PM ET AB, HOOD, NVT. 1 LikeFund Letters10.95K FollowersSummaryFiduciary Management, Inc. is an independent money management firm. FMI’sequity investing strategies apply a value discipline, with a focused approach firmlyrooted in fundamental research.Since the Russian invasion of Ukraine on February 24, the market has moved insomewhat of a barbell fashion.If higher interest rates and inflation characterize the landscape for the next severalyears, it likely spells the end of the era of unbridled speculation and high multiples.
katleho Seisa/E via Getty ImagesINVESTMENT STRATEGY OUTLOOK - SMALL CAP EQUITY
The FMI Small Cap portfolios declined approximately 4.4% (gross)/4.5% (NET) in theMarch quarter compared to a 7.53% drop in the Russell 2000 Index, and 2.40% loss inthe Russell 2000 Value Index. Areas where the portfolio had little exposure, such asEnergy Minerals & Utilities, accounted for the performance difference between theSmall Cap strategy and the Russell 2000 Value. Compared to the Russell 2000, sectorsthat helped performance included Commercial Services, Health Technology, andTechnology Services. Sectors that detracted included Energy Minerals, IndustrialServices, and Utilities. Henry Schein, Inc., Zions Bancorporation, N.A., and Robert HalfInternational, Inc. added to performance in the quarter while LCI Industries, GenpactLtd., and LGI Homes, Inc. detracted. Since the Russian invasion of Ukraine onFebruary 24, the market has moved in somewhat of a barbell fashion, with Energy/NonEnergy Minerals and Industrial Service companies tied to these segments driving thevalue trade, while many speculative growth names also moved up sharply.Quarterly investment letters across the land will be focused on the Russian invasionand what it means for geopolitical stability, supply chains, energy, inflation,globalization, economic growth, and interest rates. All of these elements were in playlong before the invasion. Although markets have largely ignored it, China and Russiasubstantially increased their belligerence toward the U.S. (and the "West") in recentyears. A new two-pronged cold war with China and Russia has been underway forsome time. Historically, sanctions have not been terribly effective, as authoritarianleaders (Mussolini, Castro, Kim Jung Un/IL, Chavez, Maduro, Khomeini) survived bycontrolling the narrative and crushing popular dissent. Maybe the coordinated effort of asurprisingly large number of Russian trading partners and central banks will prove to bethe exception. We don't expect Putin to change course because of sanctions orexposure of war atrocities, but perhaps Xi Jinping has taken notice and pauses anymoves on Taiwan. On a gross basis, China exported 577 billion to the U.S. and 701billion to the European Union in 2021. China can ill afford a trade war with the West,although the reverse is also true. The war has already had impacts on commodities,intermediate products, and the supply chain. Energy and mineral prices have blown out.Inflation, which started rising rapidly twelve months ago, remains at a 40-year high. Forat least three decades, the world's inflation picture has benefitted from a giant Chineselabor arbitrage that is now in the rearview mirror, as the Chinese working-agepopulation is no longer growing, and wages there have risen markedly. Additionally,both politically and strategically, the West will need to secure more productiondomestically or with friendly regimes -- whether it be in energy, materials, ormanufactured goods -- adding to inflation pressure in the short-to-intermediate term.
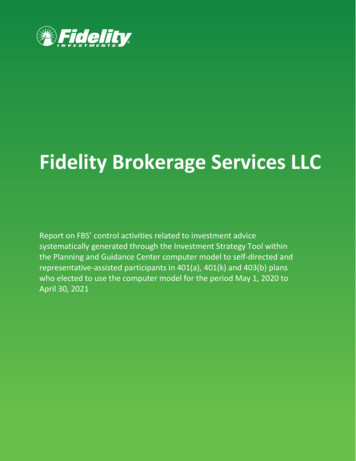
While the end of the pandemic and possible slowing of the economy may bring inflationdown somewhat, we cannot avoid the ramifications tied to years of quantitative easing,rapid money supply growth, and unprecedented fiscal expansion. The market hasn'tfigured this out yet, in fact, speculative activity has reemerged in recent weeks. Despitethis, if higher interest rates and inflation characterize the landscape for the next severalyears, it likely spells the end of the era of unbridled speculation and high multiples. Webelieve the portfolio is well- positioned to thrive in the tougher world that may be uponus.Interest Rates and InflationNearby is the latest illustration of the expected Fed Funds Rate to March 2023. If thesemoves come to pass, the recent 0% Fed Funds Rate would be 3%.Now observe the chart on the following page showing the Fed Funds Rate and theinflation rate over fifty years. Tracking the Federal Funds Target Rate back to 1971, theaverage inflation rate as measured by CPI from 1971 until today is 3.9%.
Inflation Episode 1The CPI went from 2.7% to 12.3% from the 3rd quarter of 1972 to the 4th quarter of1974. The Fed Funds rate went from 5% to 13% from the 3rd quarter of 1972 to the 2ndquarter of 1974. From the 4th quarter of 1974 to the 4th quarter of 1976, CPI went from12.3% to 4.9%.Inflation Episode 2CPI went from 4.9% to 14.8% from the 4th quarter of 1976 to the 1st quarter of 1980.Fed Funds went from 6% to 20% from the 4th quarter of 1976 to the 1st quarter of1980. Inflation finally got to a more normal level by the 4th quarter of 1982. From the 1stquarter of 1980 to the 4th quarter of 1982, CPI averaged 9.7% while the Fed Fundstarget averaged 13.6%.Inflation Episode 3CPI went from 1.1% to 6.2% from the 4th quarter of 1986 to the 3rd quarter of 1990.Fed Funds went from 6% to 9.75% from the 4th quarter of 1986 to the 1st quarter of1989. CPI from the 3rd quarter of 1990 to the 4th quarter of 1991 went from 6.2% to3.1%. CPI was under control from 1991 until the financial crisis in 2008, averaging 2.7%while the Fed Funds target rate averaged 3.95%.
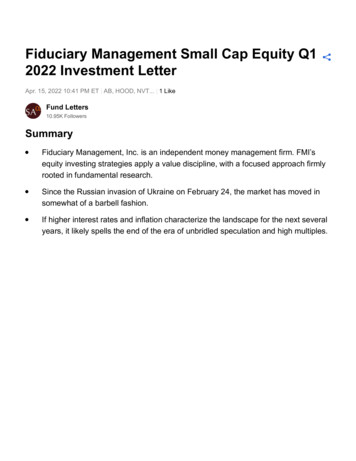
Virtually every time inflation spiked over the past fifty years, the Fed Funds Rate wenthigher than the inflation rate to tame it. How many investors today believe the FedFunds Rate is on a path toward 8%? Inflation is taking longer to stabilize than expectedand Chairman Powell is pointing toward short-term supply chain problems, or transientwar impacts. The stock and bond markets seem to agree it's a temporary challenge. Asof 3/31/22 the S&P 500 is only 5.2% off its high, and the bond market (using inflationadjusted Treasury securities) expects five-year inflation to drop dramatically. A recentstudy from AllianceBernstein (AB) concluded that only 1.5 percentage points of the7.9% inflation rate is likely due to one-time supply chain effects. More traditionalmonetary factors appear to be the culprit. In a recent piece from The Wall Street Journalby Hanke and Hanlon,1 titled, "Jerome Powell is Wrong. Printing Money CausesInflation," the authors point out that in two separate communications with Congress overthe past year, Powell said the connection between money supply growth and inflationended 40 years ago. The chart on the next page throws cold water on these assertions.Why is the market not yet buying the high inflation, higher rate thesis? One possibleexplanation gaining traction is the notion that we are headed for a recession, completewith demand destruction and falling prices, or at least a much slower growth rate in theCPI. Given the downward action in many stocks recently (aside from energy andcommodities), this seems plausible. Yield curves have flattened in recent weeks.Inverted yield curves (short-term rates exceeding long-term rates) have a better-thanaverage track record of predicting recessions. Talking to our companies, however, andobserving demand across many industries, it does not feel like a downturn is imminent.Perhaps stagflation is on the horizon. Whether underlying economic growth remainssolid or weakens enough to cause a recession, we do not see inflation returning to 2%anytime soon. Moreover, with quantitative easing ending, Fed Funds rising, and bondinvestors wanting more compensation for the risk of inflation, longer maturity interestrates may continue to normalize. As we indicated in our letter of December 31, 2021,the 10-Year Treasury's median yield since 1957 is 5.38% compared to 2.34% today (upfrom 1.51% as of 12/31/21).
It is hard to imagine P/E multiples remaining near all-time highs with the discount rateescalating.Market BehaviorThe value move in the market this year is mostly related to hydrocarbon exploration andproduction stocks, as well as other commodity- oriented equities. The Small Capportfolio has little-to-no exposure to these sectors, as over long periods of time, most ofthe companies in these sectors have proven unable to earn their cost of capital and arehighly volatile. These stocks periodically race higher, but elevated commodity pricesalmost always spur a supply response that typically ends the rally. Higher raw materialprices have temporarily affected a few of our stocks, but these companies have goodmarket power and are already raising prices aggressively. We expect within a fewquarters that margins will recover.
In the latter parts of last year and into the beginning of this year, the market wascorrecting a significant amount of excess, and it looked like the growth fever hadbroken. In our letter of December 31, 2021, we presented a table with a number ofnotable names down between 50-90% from their highs. Strangely, considering war,inflation, and rapidly rising rates, many meme stocks and other speculative issues haveonce again rallied. The same names are depicted on the left, with their performancesince the Russian invasion through 3/29/22. Based on EBIT, only four of thesecompanies have earnings.
Remarkably, the Nasdaq-100 and Russell 2000 indices are up 6.25% and 3.90%through 3/31/22, respectively, since the war started. Tesla, Inc. (TSLA) went up 57%from its low on February 24 ( 700) to the close on March 29th ( 1099), which equatesto an advance of 413 billion. To put that in perspective, the 24-trading day gain in Teslawas greater than the entire market value of Walmart, Inc.! Tesla trades for 120 timesestimated 2022 GAAP2 earnings, compared to Walmart's (WMT) 21.8 multiple (1/2023fiscal year). Robinhood Markets, Inc. (HOOD) gained 47% from February 24th to March29th, which gives another indication of how the speculative candle has reignited.Additionally, the high yield market has outperformed investment grade credits andtreasuries, both year-to-date and, inexplicably, post the Russian invasion. It is difficult tounderstand this; our only explanation is that after years of aggressive behavior beingrewarded, investors' muscle memory remains strong, kicking in whenever troublesurfaces, knowing the Fed has a long history of coming to the rescue (or losing itsnerve when it comes to interest rate hikes). Of course, the difference this time around isthat market interest rates are rising sharply, and inflation is proving to be sticky. It couldalso be that the market is anticipating the end of the war and are thus bidding up themost aggressive growth stocks; it is hard to know for sure. What does seem apparent isthat investor psychology has not been significantly tempered by rates, inflation, or awar.
Looking back over the years, we have been surprised by how long interest rates havestayed low. It has created many problems, which we have discussed at length inprevious letters and will not address here. One byproduct is high valuations that haverewarded speculative behavior.Throughout these years, our portfolio valuations have been considerably cheaper thanthe benchmark, and our balance sheets were better (and these conditions remaintoday). In hindsight, one could say we cared too much about risk. Data on price-toearnings (P/E) ratios for the Russell 2000 is very difficult to develop, owing to the factthat roughly 40% (as of 2/28/22) of the companies do not have earnings. But in the S&P500, contrary to decades of history, over the last 5 years, for all but one quintile, thehigher the trailing price-to-earnings ratio, the better the stock performance, as illustratedby the table above.In hindsight, almost every stock sold for valuation reasons looks like a mistake. We hada few problem stocks that, in retrospect, may have been too complicated, a couplewhere we misjudged the quality of the management, and a handful that were really hitby COVID. We've made some adjustments, are optimistic about the COVID-affectednames, and are confident in the lineup we have today. We make no apologies abouthaving a deep concern about downside risk and sticking with high-quality businessesand relatively low valuations. The portfolio trades at a 15-50% discount to the iSharesRussell 2000 based on an array of valuation metrics. These attributes should berewarded in time.As per usual in the March letter, we include a brief commentary on two portfolioholdings.Skechers U.S.A., Inc. (SKX)(Analyst: Matt Sullivan)DescriptionSkechers is the third largest footwear brand in the world. The company designs,manufactures, and distributes footwear for men, women, and children in U.S. andinternational markets. Its products cover a wide range of footwear categories includingcasuals, dress casuals, sandals, boots, work boots, performance footwear, and kidsfootwear. The company operates in three business segments: Domestic Wholesale(23% of sales), International Wholesale (48% of sales), and Direct-to-Consumer (29%of sales). In total, international sales account for approximately 60% of revenue.
Good BusinessExcluding net cash on the balance sheet, return on invested capital (ROIC) is inthe mid-teens, which easily exceeds the company's cost of capital.Skechers has established a brand over the past 30 years that customers associatewith comfortable, quality shoes at low prices, which we believe is an attractiveniche.This is a scaled player in the industry that can efficiently design, manufacture,market, and distribute shoes all over the world.The company has exposure to a wide range of domestic and internationaldistribution channels, including both third party and owned e-commerce websites.Consumers can find the company's products however they'd like to shop.Sketchers sells a broad assortment of shoes and uses a fast follower model, whichwe believe reduces fashion risk.The company is in a net cash position and the business is easy to understand.ValuationExcluding net cash on the balance sheet, Skechers trades for 12.3 times our next12-months earnings per share (EPS) estimate, which is below the company's 5year average and is a significant discount to the Russell 2000, as well as othercomparable companies serving similar end markets.The EV/sales multiple is 1.0 times, which is below the company's 5-year averageof 1.2 times.ManagementManagement and the board own 41 million shares of stock, which equates to 26% of the company.The company's founder, Robert Greenberg, is Chairman and CEO.Michael Greenberg, son of the founder, is President, and has been at Skechers for29 years.Investment Thesis
Skechers has built an impressive global business over many years. The growth andROIC track record of the company has been terrific. We believe the company cancontinue to grow nicely and with rising margins over the next number of years, as itkeeps expanding internationally and further develops its direct-to-consumer business,which includes fully owned stores and the Skechers.com website. These segmentssport accretive margins, meaning outsized growth in these channels will boostconsolidated company margins. Near- term supply chain challenges are weighing onthe stock's multiple and distracting from Skechers' attractive longer-term outlook. Thecompany has a fortress balance sheet, reports GAAP earnings, and doesn't engage inmergers and acquisitions activity. All in, this appears to be a rare value in a veryexpensive market.nVent Electric PLC (NVT) (Analyst: Dain Tofson)DescriptionnVent is a global provider of electrical connection and protection solutions. It was spunout of Pentair in 2018. The company is headquartered in Minneapolis, MN, although it'sincorporated in Ireland, and reports three segments: Enclosures (51% of sales and 40%of EBITA3), Electrical & Fastening Solutions (27% of sales and 36% of EBITA), andThermal Management (22% of sales and 24% of EBITA). By geography, sales are split63% U.S. and Canada, 23% Developed Europe, 11% Developing, and 3% OtherDeveloped. By vertical, sales are split 43% Industrial, 28% Commercial & Residential,21% Infrastructure, and 8% Energy.Good BusinessThe company has industry-leading positions and strong brands across itssegments. Key brands include Hoffman and Schroff in Enclosures, Raychem andTracer in Thermal Management, and Erico and Caddy in Electrical & FasteningSolutions.The cost of the products typically represents a small proportion of the total cost ofa customer's end systems.nVent operates in an attractive industry structure with relatively high barriers toentry.EBITA margin was 17.7% in 2021, which is better than the average industrialcompany.
nVent generates consistent free cash flow throughout an economic cycle, and hasattractive ROIC prospects.ValuationThe stock trades at 16.0 times 2022 consensus EPS versus industrial peers at 20.0 times.ManagementThe management team led by Beth Wozniak has executed well since the spinoutand has invested in new product launches, a digital transformation, and structuralcost reductions.Management has laid out sensible capital allocation priorities including (1)reinvesting in the company to drive organic growth, (2) maintaining a competitivedividend, and (3) pursuing bolt-on acquisitions and/or share repurchases with anobjective to allocate capital to the highest return, while appropriately managingliquidity and leverage.Randy Hogan, non-executive Chairman of the Board, was the CEO of Pentair from2001 until the spin. Pentair significantly outperformed the S&P 500 during histenure as CEO.Investment ThesisnVent has industry-leading positions, strong brands across its segments, leverage tomega-trends such as electrification, and consistent free cash flow generationthroughout an economic cycle. It's a better-than-average industrial business, in ouropinion; however, the stock trades at a discount to industrial peers. The opportunity toown an above-average industrial business at a below-average price is an attractiveproposition. Additionally, management's investments since the spinout should increasethe earnings power of the business, and subsequently, magnify the earnings gains in anupcycle. Finally, there is takeout optionality given nVent's size and business quality.Thank you for your confidence in Fiduciary Management, Inc.Fiduciary Management Inc. Small Cap Equity Composite 12/31/2011 ‐ 12/31/2021
*Benchmark: Russell 2000 Index Returns reflect the reinvestment of dividends and other earnings.The above table reflects past performance. Past performance does not guaranteefuture results. A client's investment return may be lower or higher than the performanceshown above. Clients may suffer an investment loss.Footnotes1Steve Hanke, professor, and Nicholas Hanlon, chief of staff, at the Johns HopkinsInstitute of Applied Economics.2Generally accepted accounting principles.3Earnings before interest, taxes, and amortization.Original PostDon’t say goodbye to growth just yetThe recent selloff in growth names has provided long-term investors with somevery exciting opportunities. But not all growth stocks are created equal!Alex King is a professional investor whose focus is on finding growth stocks withthe strongest financial fundamentals and the most compelling stock charts. Hisservice, Growth Investor Pro, combines extensive pro-grade fundamentalanalysis and multiple methods of technical analysis.If stocks are rated as ‘Buy’, they are owned by staff personal accounts. And ifyou’re interested in shorter-term trading, you can sign up for optional alertsthroughout the trading day. Don’t miss out!See what the pros are buying now »
Editor's Note: The summary bullets for this article were chosen by Seeking Alphaeditors.This article was written byFund Letters10.95K FollowersSelect quarterly fund letters.FollowAdditional disclosure: Fiduciary Management, Inc. claims compliance with the Global investmentPerformance Standards (GIPS ) and has prepared and presented this report in compliance withthe GIPS standards. Fiduciary Management, Inc. has been independently verified for the periods12/31/1993 ‐ 12/31/2021. A firm that claims compliance with the GIPS standards must establishpolicies and procedures for complying with all the applicable requirements of the GIPS standards.Verification provides assurance on whether the firm's policies and procedures related to compositeand pooled fund maintenance, as well as the calculation, presentation, and distribution ofperformance, have been designed in compliance with the GIPS standards and have beenimplemented on a firm‐wide basis. The Small Cap Equity Composite has had a performanceexamination for the periods 12/31/1993 ‐ 12/31/2021. The verification and performanceexamination reports are available upon request.FMI was founded in 1980 and is an independent investment counseling firm registered with theSEC and the State of Wisconsin. The firm manages over 17.1 billion in assets of pension andprofit-sharing trusts, mutual funds, Taft‐Hartley funds, insurance company portfolios, endowmentsand personal trusts. The firm includes both institutional and mutual fund business. Although thefirm has participated in wrap programs, it is a separate and distinct business, and is excluded fromfirm‐wide assets.The FMI Small Cap Equity Composite was created and incepted in January 1980. These accountsprimarily invest in small to medium capitalization US equities.The FMI Small Cap Equity Composite reflects time‐weighted and asset‐weighted returns for alldiscretionary accounts, with a market value greater than 500,000 as of month end. A smallpercentage of composite assets (typically ranging from 0‐5%) historically has been invested inunmanaged fixed income securities at the direction of account holders. From December 31, 1993through September 30, 2002 all accounts included were managed for at least one quarter, fromOctober 1, 2002 to present all accounts were managed for at least one month. All returns arecalculated using United States Dollars and are based on monthly valuations using trade dateaccounting. All accounts in this composite are fee paying. Gross of fees returns are calculated
gross of management fees, gross of custodial fees, gross of withholding taxes and net oftransaction costs. Net of fees returns are calculated net of actual management fees andtransaction costs and gross of custodial fees and withholding taxes. Dispersion is calculated usingthe equal weighted standard deviation of all accounts in the composite for the entire period. As of12/31/2011, the trailing three year annualized ex‐post standard deviation for the Composite andBenchmark are required to be stated per GIPS . FMI uses gross returns to calculate these.Currently, the advisory fee structure for the FMI Small Cap Equity Composite portfolios is asfollows:Up to 25,000,000 0.85% 25,000,001‐ 50,000,000 0.80% 50,000,001‐ 100,000,000 0.70% 100,000,001 and above 0.60%The firm generally requires a minimum of 3 million in assets to establish a discretionary account.High Net Worth individuals may establish an account with a minimum of 1,000,000, however, thefirm reserves the right to charge a minimum dollar fee for High-Net-Worth individuals depending onthe client servicing involved. The minimum account sizes do not apply to new accounts for whichthere is a corporate, family, or other substantial relationship to existing accounts. In addition, thefirm reserves the right to waive the minimum account size and minimum annual fee under certaincircumstances. A complete list and description of all firm composites and FMI distributed mutualfunds are available upon request. Policies for valuing portfolios, calculating performance, andpreparing compliant presentations are available upon request.The Russell 2000 Index measures the performance of the small‐cap segment of the U.S. equityuniverse. The Russell 2000 Index is a subset of the Russell 3000 Index representingapproximately 8% of the total market capitalization of that index. It includes approximately 2,000 ofthe smallest securities based on a combination of their market cap and current index membership.The Small Cap Equity composite uses the Russell 2000 Index as its primary index comparison.GIPS is a registered trademark of CFA Institute. The CFA Institute does not endorse or promotethis organization, nor does it warrant the accuracy or quality of the content contained herein.1 Like
by Hanke and Hanlon, titled, "Jerome Powell is Wrong. Printing Money Causes Inflation," the authors point out that in two separate communications with Congress over the past year, Powell said the connection between money supply growth and inflation ended 40 years ago. The chart on the next page throws cold water on these assertions. 1