Transcription
International Conference on Automation, Mechanical Control and Computational Engineering (AMCCE 2015)Prediction and Influencing Factors Analysis of Natural GasConsumption in China Based on SPSSGuang-jing He1, Rong-ge Xiao1 and Shuai Liang21School of Earth Sciences and Resources, China University of Geosciences, Beijing, 100000,China2School of Mining, Liaoning Technical University, Liaoning, 123000, ChinaKeywords: natural gas consumption, factor analysis, linear regression, prediction, SPSSAbstract. Natural gas is the third largest energy pillar in the world, the best energy that all countriesare scrambling to develop. Five main influencing factors of natural gas consumption are analyzedby collecting relevant information, including GDP, the gross industrial output value, the increasedvalue of the third industrial production, the urban population, and the proportion of natural gas inprimary energy. Then based on data from 2001 to 2011, factor analysis is taken by using the SPSSsoftware. Then a linear regression model is obtained to predict the natural gas consumption. At last,the natural gas consumption in 2011-2013 is predicted by the proposed model, and the result isanalyzed which shows that the model based on SPSS is reasonable and efficient.1. IntroductionIn 2013, the apparent consumption of natural gas in China has reached 167.6 billion cubic meters,increasing 13.9% on year-on-year basis. Nowadays, China has become the third largest natural gasconsumption country after America and Russia. The proportion of natural gas in primary energyconsumption structure of China has been increased from 2.4% in 2000 to 5.9% in 2013.At present, scholars have done a lot of researches on influencing factors of natural gasconsumption[1,2]. Zhao Xiaoqin et al[3] held the opinion that the influencing factors of natural gasconsumption contain national economy, energy policy, population and so on, on the basis of whichthey extracted GDP, per capita GDP, total population, industrial production and the output of thesecond industry as main factors of gray correlation analysis to extract long-term influence factors.Zhou Yuezhong et al[4] pointed that the stage of economic development, price of natural gas andalternative energy are the main factors of natural gas consumption. Yuan Shuming et al[5] tookcombination prediction on the natural gas consumption of Guangzhou by extracting GDP, theresident population, the output of the second and third industry. Yeqian[6] found four kinds offactors including economic factors, population, restricted factors and development factors. However,it is necessary to analyze the influencing factors more comprehensive and to realize the accurateforecasting of natural gas consumption, providing a basis for future energy planning.2. Analysis of Factors Influencing the Demand for Natural GasMain influencing factors of natural gas consumption are analyzed base on relevant documentsand studies.(1) Gross domestic production (GDP). Studies show that there is a casual relationship betweenthe consumption of natural gas and the economic development level of the whole country or aregion[7], which means that the faster the national economic development is, the greater the naturalgas consumption will be. For example, the annual GDP growth rate of China in 2004-2006 is 14.4%,and over the same period the one of natural gas consumption is 18.1%. Meantime, Sun Yanping[8]concluded that there is a long-term equilibrium between natural gas demand and GDP. Therefore,GDP is chosen as an important influencing factor of the natural gas consumption.(2) Gross industrial output value. Natural gas is important industrial raw material and fuel,whose consumption has a positive correlation with the gross industrial output value, that is to say, 2015. The authors - Published by Atlantis Press84
the greater output value is, the higher the consumption will be. Therefore, the gross industrial outputvalue should be regarded as a main factor of natural gas consumption.(3) The increased value of the third industrial production. Restaurants, hotels and othercommercial gas consumption as well as gas consumption from transport are embodied by theincreased value of the third industrial production. To some extent, the increased value of the thirdindustrial production stands for the increased natural gas consumption.(4) Urban population. At present, natural gas can be applied as city gas to the urban residentscooking or hot water healing in daily life. The population number directly affects the totalconsumption, per capita and use pattern of natural gas. In general, the more the urban population is,the more the natural gas demand will be. Therefore, urban population is selected as a main factor.(5) The proportion of natural gas in primary energy. With fast growing energy consumption,natural gas accounts for a greater proportion of primary energy, indicating that the greater amountof natural gas consumption. There is a clear positive correlation between them, as a result of whichthe proportion of natural gas in primary energy is regarded as a main factor.3. Factor Analyses of Influencing Factors about Natural Gas Consumption Based on SPSS3.1 Data SourcesIn order to analyze influencing factors of natural gas consumption, factor analysis is applied toextract the principle component, and the relationship between it and the natural gas consumption isanalyzed to predict future gas consumption based on the statistical package for social sciences(SPSS), combining with data from ”China Statistical Yearbook” in 2001 to 2013[9].3.2 Factor Analysis Steps of Natural Gas Consumption Influencing Factors Based on SPSSFirstly, correlation analysis is taken to get the correlation matrix, seeing in table 1, from whichwe know that there is great correlation among the five influencing factors, which means that iftaking direct analysis, there is a serious problem of colinearity. Therefore, it is necessary to take theprinciple component analysis.Table1: Correlation matrixx1x2x3x4x5correlatio x11.00 .999 .999 .982 .968n0x2.999 1.00 .998 .980 .9660x3.999 .998 1.00 .977 .9670x4.982 .980 .977 1.00 .9390x5.968 .966 .967 .939 1.000Secondly, SPSS is used to get the list of principle component, seeing in table 2, in which all ofinfluencing factors are arranged according to the characteristic root. The characteristic root of thefirst principle component is 4.911, accounting for 98.2% of the total variability.85
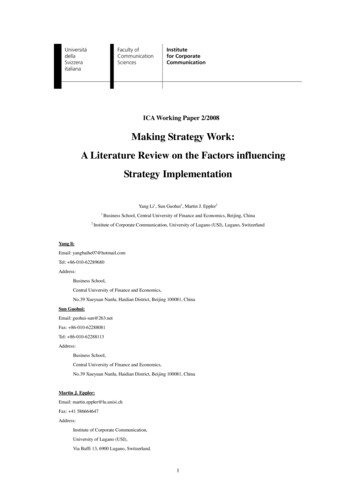
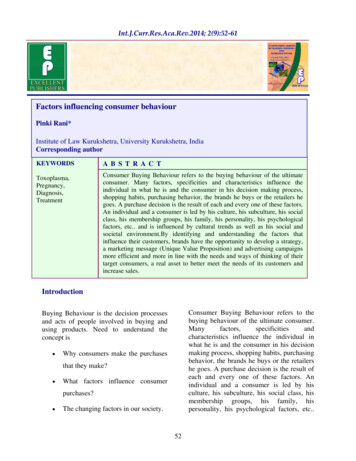
Table 2: List of principle componentinitial eigenvaluesextract and load quadratic sumcomponent grand variance% accumulation% grand variance% accumulation%totaltotal14.91198.21498.214 002.03999.9975.000.003100.000Extracting method: principle component analysis.Fig 1. The scree plotThen combined with the scree plot (seeing in figure 1), we can know that the characteristic valueof other main principles are low except the first main principle. Therefore, it is only necessary to getthe first principle component.Finally, we get the component matrix seeing in table 3, and then the first component can berepresented by the linear combination of all the variables, that is:(1)z 0.203 * zx1 0.203 * zx1 0.201 * zx 4 0.199 zx5Where zx i stands for the five influencing factors of natural gas consumption, i 1,2,3,4,5.Table 3: Component score matrixGDPthe gross industrial output valuethe increased value of the third industrialproductionthe urban populationthe proportion of natural gas in primary energyExtracting method: principle component analysis.Score of components.component1.203.203.203.201.1993.3 To establish a linear regression model by using SPSSBecause there exits significant linear correlation between natural gas consumption and the valueof the first component, so the linear regression analysis can be taken nextly. Based on the firstprinciple component in the above, we analyze the relationship between it and natural gasconsumption by using the linear regression model.86
(1) Standardize all the raw data by range standardization method. The first main component is alinear combination of normalize values of the five factors, and we should firstly standardize all thedata according to certain principles to get the value of the first principle component. In order tosimplify the calculation, we chose range standardization method to process data, the processingresult sees in table 4.Table 4: Data of main influencing factors after range standardization and natural gas consumptionNatural gasYearzx 3zx 5zx 2zx 4zx 94895.21069.41(2) Linear fitting is carried out on consumption of natural gas and the first principle component,with confidence interval being 95%. Then we can get the correlation coefficient R is equal to 0.995,which is the determination coefficient of regression analysis, representing the proximity of betweenscatters and regression curve. Meantime, the goodness of fit R 2 is equal to 0.990, the adjusted oneis equal to 0.989, and the error of standard estimation is 28.92043. After that, through analyzing thescatter diagram, we know the strong correlation between them, and then we get the result ofvariance analysis seeing in table 5.model1regressionTable 5: Variance analysisquadraticdfmeanFSigsumsquare683202.00 orgrand total 689893.1369a. Predictive variable: (constant), the first principle component z.b. Dependent variable: the natural gas consumption.Where Sig. in table 5 stands for the significance coefficient of regression relationship, which issmaller than 0.5, showing that the establishment of regression model is statistically significant.(3) Then, according to the coefficient table 6, a regression equation is obtained between naturalgas consumption and the first principle component to predict future of natural gas consumption, thatis:Y 754.681X 572.320.(2)87
model1Table 6: The coefficient rstprinciple754.68126.405component za. Dependent variable: the natural gas consumption.tSig62.542.000.995 28.581.000(4) At last, we predict the consumption of natural gas in 2011-2013 on the basis of the raw databy using the proposed model. The predicted consumption in 2011 is 115.23 billion cubic meter,132.5 billion in 2012 and 178.9 billion in 2013.(5) Compared with the real value of natural gas consumption (130.5, 147.1, 167.6 billion cubicmeter) in 2011-2013, we find that the predicted value has a little variance with the real one, but thevariance is reasonable, because it may result from government policies and other factors that wedidn’t consider.4. ConclusionFive influencing factors of natural gas consumption are concluded, including GDP, the grossindustrial output value, the increased value of the third industrial production, the urban population,and the proportion of natural gas in primary energy. And based on data in 2001-2011, factor analysisis taken by using SPSS to get a first principle component. Then a linear regression model isobtained to predict future natural gas consumption. At last, the natural gas consumption in 20112013 is predicted by the model. However, as a result of time limitation, factors such as price factor,infrastructure construction and government policies have not been taken into consideration, whichaffects the accuracy of the evaluation results.References[1] Hong Jianjun. Supply and demand situation of natural gas in world. Power and Energy, 2012,33(5): 467-470.[2] LI De-sheng, LI Bo-hua. Create a new and multielement era for energy sources development byintegration of petroleum geology with environmental geology. Xinjiang Petroleum Geology,2009, 30(4): 403-406.[3] Zhao Xiaoqin, Kang Zhengkun, Wu Fengrong. Influencing factors on piped natural gas marketand gray correlation analysis. Oil and Gas Storage and Transportation, 2008, 27(8): 5-8.[4] Zhou Yuezhong, Liting. Exploration on the influencing factors of natural gas consumptiondemand. Market Modernization, 2008, 15(10): 187-188.[5] Yuan Shuming, Lai Jianbo, Zhang Dekun, et al. Forecast on long term planning of gasconsumption of city gas pipeline network. Gas and Heat, 2009, 29(5): 24-27.[6] Yeqian. City nature gas demand forecast research and application. Chongqing: ChongqingUniversity, 2010:25-31.[7] Wang Lijuan. Research on forecasting methods of natural gas load based on particle swarmoptimization-least squares support vector machine. Shanghai: East China University of Scienceand Technology, 2012:36-40.[8] Sun Yanping. Research on cointegration analysis and error correction model of the relationshipbetween natural gas demand and GDP in China. Special Zone Economy, 2007, 12: 264-265.88
the proportion of natural gas in primary energy is regarded as a main factor. 3. Factor Analyses of Influencing Factors about Natural Gas Consumption Based on SPSS 3.1 Data Sources In order to analyzeinfluencing factors of natural gas consumption, factor analysis is applied to