Transcription
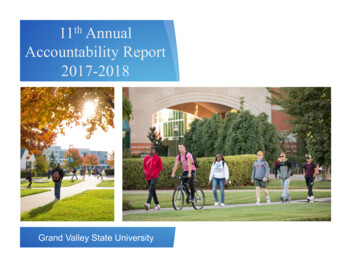
11th AnnualAccountability Report2017-2018Grand Valley State University
Principles of AccountabilityThis annual Accountability Report clearly illustratesGrand Valley’s proven results and outcomes as desiredby state leaders and as identified in the university’sstrategic plan. All the data in the report is sourced andshows how Grand Valley delivers on the promise of aquality, public education for the people of Michigan.Employers, families and individuals benefit and thatleads to societal strength in our communities.Grand Valley State University serves the people of thestate of Michigan. It is accountable to every taxpayerand citizen for its performance in educating students tocontribute to the state’s well-being. Grand Valley’sgraduates are contributing to the economic vitality andsocial fabric of every community in the state and takingtheir talents well beyond its borders to enrich our world.For the last several years, state lawmakers haveutilized a higher education funding plan that ties a smallportion of state support to performance. Grand Valley isagain a top performer in key areas, including providingaccess to students who might not otherwise be able toafford a college degree and keeping students on a pathto a timely graduation.The organization of this report correlates to seven corevalues within Grand Valley’s 2016-2021 strategic plan:Excellence Integrity Inquiry InclusivenessCommunity Sustainability InnovationAll seven values lead to the ultimate accountability –student success. Our students and alumni are creatingwhat is known as the Laker Effect.For more information on Grand Valley’s values, plansand performance please tegicplanning2
Measures of Student SuccessCore University Values: Excellence and Inquiry3
Comparative Academic Statistics for New StudentsEntering Michigan Public UniversitiesFall 2016Median Composite ACT ScoreU of M-Ann Arbor31Michigan Tech27Michigan State26U of M-Dearborn25Grand Valley24Wayne 22Saginaw Valley22Western22Lake Superior21U of M-Flint21Fall 2016Mid-50% ACT ScoreU of M-Ann Arbor29-33Michigan Tech25-30Michigan State24-29U of M-Dearborn22-27Grand Valley21-26Oakland20-27Wayne State20-27Central20-25Saginaw Valley20-25U of stern19-25Lake Superior19-24Source: 2018 Barron's College ProfilesSource: College Board Handbook 2018Source: College Board Handbook 20181 GVSU & LSSU - Fall 20153 LSSU - Fall 2004121Fall 2016GPA 3.0 or HigherU of M-Ann Arbor99%Michigan State97%Michigan Tech96%Grand Valley94%U of M-Dearborn91%Central82%Saginaw Valley78%Oakland77%Wayne State76%U of M-Flint74%Eastern71%Western71%Ferris68%Lake Superior56%Northern53%32 NMU - Fall 2013Measures of Student Success4
Freshman to Sophomore Retention RateUniversity of Michigan-Ann Arbor97%Michigan State University92%Grand Valley State University84%Michigan Technological University83%Wayne State University82%Western Michigan University79%Central Michigan University78%Northern Michigan University75%Oakland University75%Eastern Michigan University75%Ferris State University75%University of Michigan-Dearborn74%Lake Superior State University72%University of Michigan-Flint68%Saginaw Valley State University67%Source: IPEDSFall 2015 to Fall 2016Measures of Student Success5
Graduation RatesUniversity of Michigan-Ann Arbor91%Michigan State University79%Michigan Technological University67%Grand Valley State University66%Central Michigan University58%University of Michigan-Dearborn54%Western Michigan University53%Oakland University47%Northern Michigan University47%Ferris State University44%Lake Superior State University42%Eastern Michigan University41%Wayne State University39%Saginaw Valley State University38%University of Michigan-Flint37%Source: IPEDS2010 CohortMeasures of Student Success6
Pass Rates of Graduates on Licensure andCertification ExamsProgramPass RateFinance100%Nursing *100%Physical Therapy100%Police Academy100%Military Police Basic Training Program100%Speech and Language Pathology100%Occupational Therapy98%Physician Assistant98%Athletic Training96%Medical Laboratory Science94%National Benchmark64%83.6%Source: GVSU Institutional Analysis* Doctoral- Child/Adolescent NPMeasures of Student Success7
National Rankings and RecognitionONE OF “AMERICA’S 100 BEST COLLEGE BUYS”For 22 consecutive yearsInstitutional Research & EvaluationBEST IN THE MIDWESTPrinceton ReviewVETERAN-FRIENDLY SCHOOLGold RankMichigan Veterans Affairs AgencyONE OF “AMERICA’S TOP COLLEGES”ForbesMeasures of Student Success8
Meijer Honors CollegeThe Meijer Honors College is growing in numbers and significance. With nearly1,800 students, the college is close to optimal enrollment. The Honors Collegeboasts an impressive 92% retention rate from freshman to sophomore year.Honors total 0 2011 2012 2013 2014 2015 2016 2017Measures of Student Success9
Student Satisfaction“Overall Rating of Grand Valley.”97% respond “good”or “excellent”Source: GVSU Survey of Graduates, 2015-16 (Inst Analysis)Measures of Student Success 10
Employment and Placement After GraduationRecent graduates employed or in graduate school93%Employed in Michigan86%Source: 2015-2016 GVSU PostgraduateEmployment ReportMeasures of Student Success 11
Access and Affordability MeasuresCore University Value: Inclusiveness12
Enrollment Records More than 4,000 freshmenhave enrolled at theuniversity for six years ina row. A record number ofstudents of color isenrolled, 4,344 up from4,315 last fall. 4th year of enrolling morethan 25,000 students.Source: GVSU Institutional AnalysisAccess and Affordability Measures 13
2017 Fall HeadcountMichigan State49,042U of M-Ann Arbor45,846Wayne State27,089Grand 7Oakland19,333Ferris13,770U of M-Dearborn9,148Saginaw Valley8,662U of M-Flint7,916Northern7,750Michigan Tech7,313Lake Superior2,237Source: HEIDILSSU Fall 2016Access and Affordability Measures 14
Michigan Resident Undergraduate HeadcountMichigan State30,737Grand Valley20,313Central17,214Wayne State16,673U of M-Ann Ferris11,703Saginaw Valley7,248U of M-Dearborn6,755U of M-Flint6,150Northern6,151Michigan Tech4,726Lake Superior2,214Source: HEIDILSSU Fall 2016Access and Affordability Measures 15
Equivalent Full-Time EnrollmentMichigan State45,947U of M-Ann Arbor45,735Grand Valley22,871Wayne Eastern16,725Ferris11,636Saginaw Valley7,895U of M-Dearborn6,906Northern6,891Michigan Tech6,651U of M-Flint6,440Lake Superior1,930Source: FYES enrollment per HEIDI – 2016-2017WSU calculation estimate, CMU 2015-2016Access and Affordability Measures 16
Changes in EnrollmentGrand Valley93.2%Oakland71.9%Saginaw Valley46.9%Ferris35.7%U of M-Flint30.8%U of M-Dearborn23.1%U of M-Ann Arbor22.9%Michigan State18.9%Central17.4%Michigan Tech10.7%Northern4.1%Western-6.4%Eastern-6.7%Wayne State-7.3%Lake Superior-33.6%Source: HEIDI – FYES from 1997 to 2017WSU calculation estimate, CMU 1997-2016Access and Affordability Measures 17
Geographic OriginKeweenaw2Houghton10Ontonagon1Gogebic 5Luce13Baraga8Iron3Marquette39Dickinson24Alger Schoolcraft71637Presque Isle15Charlevoix81AlpenaAntrim Otsego Montmorency 5242750Mackinac 23Delta30LeelanauCrawford73AlconaGrand KalkaskaOscoda1413Benzie Traverse271748355IoscoRoscommonManistee Wexford Missaukee 24Ogemaw 2414665713Menominee10Geographic OriginFall Semester 2017Mason111Michigan ResidentsOther StatesOther Countries22,9411,680428Total25,049Top 6 Mecosta Isabella y95Saginaw148Tuscola38Sanilac46Genesee Lapeer St. Clair123264Shiawassee 502ClintonIonia84Macomb2222281177OaklandLivingston 2911BarryEaton Ingham670194254402Kent5127Van BurenKalamazoo507152Calhoun200Jackson Washtenaw228449Berrien Cass St. Joseph Branch Hillsdale Lenawee9334757309695Wayne1581Monroe101Access and Affordability Measures 18
First-time Student Annual TuitionMichigan TechU of M-Ann ArborMichigan StateWayne StateCentralU of M-DearbornOaklandWesternEasternFerrisGrand ValleyLake SuperiorU of M-FlintNorthernSaginaw Valley 15,074 14,826 14,460 12,729 12,510 12,472 12,420 12,243 12,219 12,180 11,994 11,622 11,334 10,490 9,819Source: University Budget OfficeAccess and Affordability Measures 19
Financial Aid Available To GVSU StudentsInstitutional Financial Aid CommitmentAmountIncrease2012-13 33,688,3338.18%2013-14 35,134,4774.29%2014-15 38,121,5178.50%2015-16 40,429,3036.05%2016-17 44,015,2878.86%2017-18 47,295,6517.45%Source: GVSU Office of Financial Aid & ScholarshipsTypes of Financial Aid Available 2016-2017Need-Based Grants 48,837,029Merit Scholarships 34,451,585LoansWork StudyTOTAL 181,077,212 1,403,913 265,769,739Source: GVSU Office of Financial Aid & ScholarshipsAccess and Affordability Measures 20
Net Cost of Tuition for Typical GVSU StudentTuition (2017-2018) 11,994Average Gift Aid 4,542Average Net Cost 7,452Source: Estimate from GVSU Officeof Financial Aid & ScholarshipAccess and Affordability Measures 21
The Grand FinishGrand Valley students are encouraged to graduate in four years.Qualifying seniors receive a tuition discount.More than 2,650 students receivedthe Grand Finish Grant in 2016-2017.Students who are on track to finishtheir degree in four years receive upto 1,000.Of the 2017 graduates who earneda degree in four years or less, 35%had no debt.Access and Affordability Measures 22
Student Loan Default RateUniversity of Michigan - Ann Arbor1.3%Michigan Technological University2.0%Michigan State University3.5%Grand Valley State University4.0%Oakland University4.8%Central Michigan University4.9%University of Michigan - Dearborn5.6%Western Michigan University6.2%University of Michigan - Flint6.3%Lake Superior State University6.8%Ferris State University7.3%Saginaw Valley State University7.5%Wayne State University7.7%Eastern Michigan University9.9%Northern Michigan University11.0%Source: Office of Federal Student Aid,U.S. Department of EducationAccess and Affordability Measures 23
Public Investment in Grand ValleyCore University Value: Integrity24
State Appropriation per StudentWayne StateMichigan TechU of M-Ann ArborLake SuperiorNorthernMichigan StateWesternState AverageFerrisEasternCentralU of M-DearbornSaginaw ValleyU of M-FlintGrand ,6153,1933,1642,9432,8312016-17 403,0872,8682,872Source: HEIDIPublic Investment in Grand Valley 25
Ratio of State Aid vs. Tuition at Grand 201717.9%State Appropriation PercentTuition Revenue PercentSource: HEIDI —1977-2017 ActualPublic Investment in Grand Valley 26
State Investment per DegreeWayne State 31,463Michigan Tech 27,438Northern 25,717U of M-Ann Arbor 22,881Lake Superior 22,423Michigan State 21,401Western 20,279State Average 19,030Median 16,855Saginaw Valley 16,855Eastern 15,030Central 13,258U of M-Dearborn 12,126Ferris 11,939U of M-Flint 11,760Grand Valley 11,698Oakland 11,133 - 5,000Source: HEIDI - FY 2016 appropriationsHEIDI - FY 2015-16 degreesBased on appropriations over 4 years 10,000 15,000 20,000 25,000 30,000 35,000Public Investment in Grand Valley 27
Efficiency MeasuresCore University Value: Sustainability28
Average Number of Students per FacultyU of M-Ann ArborWayne StateMichigan TechLake SuperiorWesternCentralU of M-DearbornEasternU of M-FlintFerrisMichigan StateGrand ValleyOaklandNorthernSaginaw Valley111212131415151515161617181920Source: HEIDIFall 2016Efficiency Measures 29
Academic vs. Administrative Expenses100%90%80%70%60%50%40%30%20%10%0%Acad as a % of totalAdmin as a % of totalSource: 1994-2017 HEIDIEfficiency Measures 30
Environmental SustainabilityRANKED 39TH OUT OF 227INSTITUTIONS AS ONE OF THECOUNTRY’S GREENEST UNIVERSITIESSierra Club There are more than 250 sustainability-related coursesoffered at Grand Valley (economic, social,environmental). During the past 15 years, Grand Valley has decreaseduse of water on a square-foot basis by 48.6%, naturalgas by 35.0% and electricity by 28.7%. Grand Valley was named a Bicycle Friendly Universityby the League of American Bicyclists, a nationalorganization that encourages the use of bicycles forhealth and well-being. Grand Valley received the 2017 APPA Effective andInnovative Practices Award for its partnership withConsumers Energy on the solar-panel project on theAllendale Campus.ONE OF AMERICA’S ENVIRONMENTALLYRESPONSIBLE COLLEGESPrinceton ReviewEfficiency Measures 31
Bus PartnershipGVSU Investment with The Rapid: 2,657,320GVSU Community Saves:2,490,337 Rides16,579,222 Vehicle Miles Avoided 8,869,884 Vehicle Operating Costs AvoidedNote: Calculations based on average tripdistance and 2017 IRS Standard Mileage RatesEfficiency Measures 32
Private-Public PartnershipCore University Value: Community33
Private Giving to Grand ValleyNearly 14,000 donors helped Grand ValleyUniversity Foundation raise 12.6 million. Thisincluded another record giving level for alumni.18%31INCREASE IN ANNUAL GIVINGNEW SCHOLARSHIPS54%FACULTY/STAFF GIVINGGifts to the University Endowmentexceeded goals for this year. The fund atthe end of the fiscal year was more than 118 million.For more information about giving atGrand Valley visit: www.gvsu.edu/giving/Private-Public Partnership 34
Economic DevelopmentCore University Value: Innovation35
Grand Valley Construction in 20172017 ProjectsKent County:Muskegon County: 55,518,160 74,000Ottawa County: 53,109,708Wayne County: 355,000Total: 109,056,868Total construction jobs supported: 2,295Source: GVSU Facilities PlanningEconomic Development 36
Community Impact of Grand Valley AlumniThe Laker EffectWhile Lakers live throughout the world, their impact is greatest in Kent, Ottawaand Muskegon counties, where nearly half of all graduates live or work.Top Employers of Grand Valley Alumni:AmwayHerman Miller, Inc.BDO USA, LLPKellogg CompanyDeloitteMeijer, Inc.Farmers Insurance GroupMercy HealthFiat Chrysler AutomobilesPine Rest Christian Mental Health ServicesGeneral MotorsQuicken LoansGentexSpectrum Health SystemGordon Food ServiceState of MichiganGrand Rapids Public SchoolsSteelcase, Inc.Haworth, Inc.StrykerSource: GVSU Career CenterEconomic Development 37
Economic Impact in Region 816 millionEconomic impact of GVSU’s 29,000 students, faculty and staff in Kent, Ottawaand Muskegon counties in fiscal year 2015-201650,195Alumni in Kent, Ottawa and Muskegon counties11,810Total estimated regional employment attributed to GVSUSource: GVSU- using model provided byW.E. Upjohn Institute for Employment ResearchEconomic Development 38
Grand Valley Ranks Best in ClassBest in Class Performance fromState of MichiganHigh Retention RatesHigh Graduation RatesDegrees Awarded in Critical SkillsIncrease in Pell-eligible StudentsAccessibility by Qualified Students39
The Future of Grand Valley2016-2021 Strategic PlanKey outcomes: Learning environment is personal, challenging and transformational.Supports excellent academic programs and co-curricularopportunities.Grand Valley: Is diverse and inclusive. Has mutually beneficial relationships, partnerships, collaborationsand connections in Michigan and around the world. Supports innovation, integrative scholarly and creative activity, andthe use of new technologies. Strategically allocates its fiscal, human and other institutionalresources.40
41
Meijer Honors College 9 The Meijer Honors College is growing in numbers and significance. With nearly 1,800 students, the college is close to optimal enrollment. The Honors College boasts an impressive 92% retention rate from freshman to sophomore year. Honors total enrollment Measures of Student Success 0 200 400 600 800 1000 1200 1400 1600 .
