Transcription
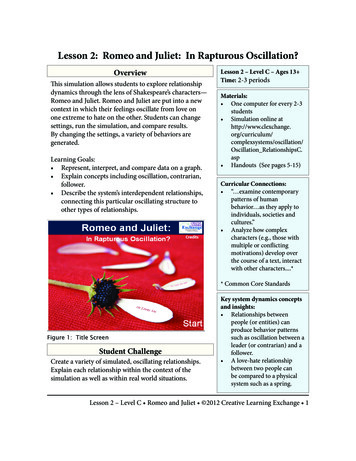
Lesson 2: Romeo and Juliet: In Rapturous Oscillation?OverviewThis simulation allows students to explore relationshipdynamics through the lens of Shakespeare’s characters—Romeo and Juliet. Romeo and Juliet are put into a newcontext in which their feelings oscillate from love onone extreme to hate on the other. Students can changesettings, run the simulation, and compare results.By changing the settings, a variety of behaviors aregenerated.Learning Goals: Represent, interpret, and compare data on a graph. Explain concepts including oscillation, contrarian,follower. Describe the system’s interdependent relationships,connecting this particular oscillating structure toother types of relationships.Lesson 2 – Level C – Ages 13 Time: 2-3 periodsMaterials: One computer for every 2-3students Simulation online ems/oscillation/Oscillation RelationshipsC.asp Handouts (See pages 5-15)Curricular Connections: “ examine contemporarypatterns of humanbehavior as they apply toindividuals, societies andcultures.” Analyze how complexcharacters (e.g., those withmultiple or conflictingmotivations) develop overthe course of a text, interactwith other characters.** Common Core StandardsFigure 1: Title ScreenStudent ChallengeCreate a variety of simulated, oscillating relationships.Explain each relationship within the context of thesimulation as well as within real world situations.Key system dynamics conceptsand insights: Relationships betweenpeople (or entities) canproduce behavior patternssuch as oscillation between aleader (or contrarian) and afollower. A love-hate relationshipbetween two people canbe compared to a physicalsystem such as a spring.Lesson 2 – Level C Romeo and Juliet 2012 Creative Learning Exchange 1
Lesson DetailsPreparation:1. Create groups of two to three students each.2. Check computers to make sure you can access the online simulation.3. Copy handouts for each student. See the chart below to determine how many copies ofeach handout you’ll need.# Page ional)If students have read Shakespeare’splay, The Tragedy of Romeo andJuliet, they can graph the characterdynamics throughout the story.Copy single-sided.1 copy per student26-8IntroductionStudents get started with thesimulation using step-by-stepdirections.Copy single-sided.1 copy per studentwithBaseline RunThey then set up and record theCopy double-sided.data from a baseline run for Romeo 1 copy per studentand JulietExperimentalRunStudents explore “What if?”questions, recording their data foreach run. A minimum of three runsis recommended.Copy double-sided.3 copies per student, dependingon how many runs you’d likestudents to do.39-10411-13 DebriefStudents step through the debriefand write their reflections.Copy double-sided.1 copy per student514-15 Assessment1Students summarize their learning.Copy double-sided.Students synthesize thesimulation results in order tomake connections to other typesof similar and different socialrelationships.Copy single-sided.616Assessment 2(Optional)4. Optional: You may want to read the background information about the underlyingstructure of the model. This can be useful as you guide students to understanding themodel behavior, as it relates to real world behaviors, and the limitations of the model.See, “RomeoJuliet Model Background Info,” available as a separate file for download.Lesson Sequence:1. (Optional) If students have read the play, The Tragedy of Romeo and Juliet, studentscan graph dynamics within the play using Handout 1. They can then compare thosetrends to the theoretical output of the simulation, which goes beyond the events ofShakespeare’s play.2 Lesson 2 – Level C Romeo and Juliet 2012 Creative Learning Exchange
Lesson Details2. Introduce key vocabulary (e.g., contrarian, fickleness,follower, fatigue, oscillation) as needed.3. Have students open the simulation and work throughthe simulation introduction, and experiments usingFigure 2: Control Panelthe guided handouts. Note that the handouts guidestudents through the simulation in a step-by-stepmanner. If you’d like to leave the exploration moreopen, then you may eliminate some of the handouts.Figure 2 shows the control panel screen.Debrief and Assessment:1. Have students use the debrief handouts to reflecton the simulation experience. You can also debriefthe simulation experience as a class, using ideas forbringing the lesson home. Assessment 1 on pages14-15 checks for basic understanding of conceptsembedded within the simulation and allows studentsto make connections to other systems that exhibitsimilar trends. Assessment 2 on page 16 asks studentsto compare the simulated results with other real-worldrelationships.2. See this and the following page for possible assessmentresponses. Possible responses for questions ‘a.’ and ‘b.’ onAssessment 1, page 14: Question ‘a.’—Example story of the graph: AsJuliet’s love for Romeo rises, Romeo, beingBringing the Lesson Home:Discuss these and any othertopics that have surfaced. What causes arelationship betweentwo people (or entities)to oscillate? Come to aresting point? What caused fasteroscillations? Slower? Analyze the simulation interms of a tempestuousrelationship between aman and a woman. Doesthe model make sense forthat type of relationship?Why or why not? Literature connection:Discuss whether youagree or disagree with thefollowing—Romeo andJuliet are kept apart, notby their families, but by“Romeo’s fickleness.” How does the simulationcompare to otherrelationships, e.g., a feudor a conflict between twocountries.Assessment Ideas: Have students use thedebrief and assessmenthandouts. The debrieftakes students step-bystep through the debriefscreens. The assessmentallows students to createa connection to anothersituation.Lesson 2 – Level C Romeo and Juliet 2012 Creative Learning Exchange 3
Lesson Details fickle, starts losing interest. His love falls toward hatred. Juliet also loses interestbecause Romeo is no longer following. Now, Romeo realizes that Juliet is driftingaway and reverses course, pursuing her in love once more. Juliet responds (as thefollower) and loves him once again. Eventually, all the graphs reach neutrality,because they grow tired of the ups and downs. In the end, they are ambivalenttoward one another.Question ‘b.’—In order to create this graph, we’d need a low fickle factor, lowtendency to follow, and some fatigue. The actual numbers used to produce thegraph are also included in the table below.Romeo’s Fickle FactorLow (0.3)Juliet’s Tendency to FollowLow (0.3)Romeo’s Fatigue FactorSome, but not too high (0.4)Juliet’s Fatigue FactorSome, but not too high (0.4)Possible responses for questions ‘d.’ and‘e.’ on Assessment 1, page 15: See Figure 3 for an example mapbased on transferring the Romeoand Juliet map to another context. One possible “story” for theexample map: My little sister andI love each other, but sometimesshe drives me nuts. She’s alwaysfollowing me around. When mysister wants to hang out with me, Iget annoyed, so I don’t really wantto be around her. She notices andthen goes away. When I see thatshe doesn’t want to be with meanymore, I get worried that shereally doesn’t like me. So, I startasking her to hang out again. Shedoes, and for awhile, it’s cool. Thenshe starts bugging me again, andFigure 3: Example Mapthe whole crazy thing repeats!4 Lesson 2 – Level C Romeo and Juliet 2012 Creative Learning Exchange
Lesson 2 - Handout 1Literature Connection to The Tragedy of Romeo and JulietChoose two variables from the list below or create your own variables. Create at least two linegraphs showing what happened over the course of the play, Romeo and Juliet.Possible variables to graph: Romeo’s Love for Juliet Juliet’s Love for Romeo Level of Violence Animosity between Montegues and Capulets Other?Describe your graph and justify usingevidence from the text.I.II.III.ActsIV.V.Describe your graph and justify usingevidence from the text.I.II.III.ActsIV.V.Lesson 2 – Level C Romeo and Juliet 2012 Creative Learning Exchange 5
Lesson 2 - Handout 2Romeo and Juliet: In Rapturous Oscillation?–IntroductionOpen web address: s/oscillation/Select the Romeo and Juliet: In Rapturous Oscillation? Level C simulation and click, “Start.”You’ll explore the sections (in bold) as indicated. Remember, you can always revisit a sectionanytime you like.1. Click Introduction – Love Dynamicsa. Define the term “dyad” in your own words and give at least two examples.b. What does it mean to be fickle in a relationship?c. What does it mean to be a follower in a relationship?Click Menu. Click Experiment with the Model. Click InstructionsClick on the “?” for each of the settings and then define these in your own words.Romeo’s Fickle Factor:Juliet’s Tendency to Follow:Romeo’s Fatigue Factor:Juliet’s Fatigue Factor:Use the following worksheets to predict and record your virtual experiments.6 Lesson 2 – Level C Romeo and Juliet 2012 Creative Learning Exchange
Lesson 2 - Handout 2Run # 1: Baseline Runs for Romeo and JulietInput the values shown below onto the simulation screen, but don’t run it just yet.Romeo’s Fickle Factor0.1Juliet’s Tendency to Follow0.1Romeo’s Fatigue Factor0Juliet’s Fatigue Factor0Predict: What do you think will happento Romeo and Juliet’s love for one anotherover time?Draw and label your general prediction astwo lines on the graph —one as Romeo’slove/hate for Juliet and the other asJuliet’s love/hate for Romeo. Note thatthey will both start at a level of 1, which isat the dot shown on the y-axis. Now click“Run.”Analysis: What actually happened? Using two colors, create a key, show the scale on they-axis, and draw the graphs for Romeo and Juliet. Note that you can see the two graphsindividually by clicking the tabat the bottom left corner of the graph.Lesson 2 – Level C Romeo and Juliet 2012 Creative Learning Exchange 7
Lesson 2 - Handout 2Baseline Run (continued)a. Columnist Clarence Peterson speculated that Romeo and Juliet are kept apart inShakespeare’s play, not by their families, but by “Romeo’s fickleness.” If this were true, isthis a good model of their relationship? Explain the trends on the graph in light of theconcept of “Romeo’s fickleness.” Does “fickleness” explain the behavior you see?b. Approximately how much time does it take for the relationship to go through one cycle?(Hint: Look at the time distance between two peaks for one of the lines on the graph. Youcan click and hold on a graph line to see the values.)c. Why does the relationship appear to oscillate (go up and down) forever?d. Given the graph on the previous page, what is your estimate as to the percent of time thatboth Romeo and Juliet are in love with one another “at the same time?” How could yourprove your answer?e. Continue your exploration, asking “What if ” questions. Ask one question at a time andthen record what happens on a new run sheet.Question 1: What might happen if Romeo was even more fickle and Juliet was even more of afollower?Question 2: What might happen if Juliet was more of a follower, but Romeo was less fickle?Question 3: What might happen if Romeo and Juliet became fatigued by “the game of upsand downs?”Question 4: What are some other questions you could explore? Write one or more questionsbelow and try them one at a time.8 Lesson 2 – Level C Romeo and Juliet 2012 Creative Learning Exchange
Lesson 2 - Handout 3Experimental RunRun #:Question:Make sure to change only one setting from the baseline values that relates to your question.Romeo’s Fickle Factor0.1Juliet’s Tendency to Follow0.1Romeo’s Fatigue Factor0Juliet’s Fatigue Factor0Predict: What do you think will happento Romeo and Juliet’s love for one anotherover time?Draw and label your general prediction astwo lines on the graph —one for Romeo’slove/hate for Juliet and the other forJuliet’s love/hate for Romeo. Note thatthey will both start at a level of 1, which isat the dot shown on the y-axis. Now click“Run.”Analysis: What actually happened? Using two colors, create a key, show the scale on the yaxis, and draw the two lines.Lesson 2 – Level C Romeo and Juliet 2012 Creative Learning Exchange 9
Lesson 2 - Handout 3Experimental Run (continued)a. Explain why you think the relationship changed as it did.b. Approximately how much time does it take for the relationship to go through one cycle?c. What do you think is impacting the speed of the oscillation cycle?d. How does this run compare to the baseline run?e. What’s similar?f. What’s different?g. What is causing the similarities and differences?10 Lesson 2 – Level C Romeo and Juliet 2012 Creative Learning Exchange
Lesson 2 - Handout 4DebriefClick Menu. Click 3. Debrief Central. You’ll go through each of these debrief sections tothink about what you experienced in the simulation.Click A. Behavior Patterns. Read and then click Explanation of the Graph.a. Discuss Romeo’s role as the contrarian in comparison to Juliet’s role as the follower. Lookup the term “contrarian” if needed.Click Continue.b. What causes faster vs. slower cycles within the relationship? Make sure to discuss specificsettings that generate these behaviors.Click Continue.c. What causes the cycling to stop? Discuss in terms of the settings and how these areconnected to real life examples.Click Continue.d. How do you explain this graph?e. Who is most “stable” and who is the most “dramatic?” Why?f. How do you think the fatigue factors are set in this run? How do you know?Lesson 2 – Level C Romeo and Juliet 2012 Creative Learning Exchange 11
Lesson 2 - Handout 4Debrief (continued)Click Next Section. Back at the Menu, click B. Explore the Model.Click and read through Tour the Model Structure and Tour the Loops.a. Look at the map below and use it to answer the questions on this and the next page.b. Explain the elements, connections, and loops within the map. Hint: follow the cause-andeffect arrows around describing the connections along the way. The three loops are B1(balancing loop 1) which causes the relationship to oscillate up and down, B2 (balancingloop 2) which causes the relationship to stop cycling up and down, and B3 (balancingloop 3) which also causes the relationship to stop cycling up and down.12 Lesson 2 – Level C Romeo and Juliet 2012 Creative Learning Exchange
Lesson 2 - Handout 4Debrief (continued)c. How did changing Juliet’s tendency to follow affect the relationship over time?d. How did changing Romeo’s fickle factor affect the relationship over time?e. How did changing either Romeo’s or Juliet’s fatigue factors affect the relationship over time?Click Next Section. Back at the Menu, click C. Connections.a. How are romantic relationships within the simulation and the interactions during the ColdWar similar and different in terms of their structure and behavior over time?Click Continue.b. How are romantic relationships within the simulation and fads similar and different interms of their structure and behavior over time?c. What are other systems that oscillate in a similar way? Identify and describe at least twoconnections.Lesson 2 – Level C Romeo and Juliet 2012 Creative Learning Exchange 13
Lesson 2 - Handout 5Assessment 1: Romeo and Juliet: In Rapturous Oscillation?a. Tell the story of the lines on the graph. Why are they going up and down, and thenstabilizing?b. What approximate settings would create the graphs above? You can fill in numerical valuesand/or qualifiers, such as high fickle factor, low fickle factor, no fatigue, some fatigue, etc.Romeo’s Fickle FactorJuliet’s Tendency to FollowRomeo’s Fatigue FactorJuliet’s Fatigue Factorc. How might the behaviors been different if the roles in the simulation were reversed, that is,if Juliet was fickle and Romeo was the follower?14 Lesson 2 – Level C Romeo and Juliet 2012 Creative Learning Exchange
Lesson 2 - Handout 5Assessment 1: Romeo and Juliet: In Rapturous Oscillation? (continued)d. Choose one of the connections you listed on the debrief handout or come up with anotherone. Using the map below, add labels to each of the elements to describe the interactions.You can use the map for Romeo and Juliet on Handout 4 to help you.e. Tell the story of your map.Lesson 2 – Level C Romeo and Juliet 2012 Creative Learning Exchange 15
Lesson 2 - Handout 6Assessment 2 (optional): Romeo and Juliet: In Rapturous Oscillation?Think of a relationship in your own life or of two people from a book or story. For example,instead of a contrarian (Romeo) and a follower (Juliet), what if both people are enthusiasticabout the relationship? What if one likes the other, but the feelings are never returned? Howwould love look between two shy, cautious people? What might feelings for a future spouse beover the course of a long marriage? If a friendship was once strong but went cold over time,what would that look like?Provide a short written description of the dynamics you see in this relationship. Who arethe people involved—friends, relatives, fictional characters? There is no need to includeidentifying information if you’re describing people from your own life. What happens in therelationship? Be sure to describe the time horizon; are the dynamics playing out over days,weeks or years? Try to describe the situation from both points of view.On the graph below, sketch the relationship dynamics you’ve described. Using two colors,create a key, show the scale on the y-axis, and draw a line for each person’s feelings of loveand/or hate over time.Finally, list some ideas for what might change the behavior of the relationship. If therelationship is positive, like friendship or love, what might cause it to sour, and vice versa?16 Lesson 2 – Level C Romeo and Juliet 2012 Creative Learning Exchange
Acknowledgements:Lesson 2 – Level CRomeo and Juliet: In Rapturous Oscillation? 2012 Creative Learning Exchangewww.clexchange.orgThis model is one in a series of models that explore the characteristics of complex systems.Model created with contributions fromJennifer AndersenAnne LaVigneMike RadzickiGeorge RichardsonLees Stuntzwith support from Jay Forrester and the Creative Learning Exchange.Image Sources and CreditsThe following images are in the public domain:Title page from play - Source: iet1597.jpgRomeo and Juliet painting - Source: oandJuliet.jpgNo love - Source: http://commons.wikimedia.org/wiki/File:No love.svgMensa connections - Source: http://commons.wikimedia.org/wiki/File:Mensa Connections.JPG; author FitzftzReagan and Gorbachev - Source: http://commons.wikimedia.org/wiki/File:Reagan and Gorbachev holddiscussions.jpgDuck and Cover - Source: aphic of nuclear stockpiles - Source: http://commons.wikimedia.org/wiki/File:US and USSR nuclearstockpiles.svgThe following images are used under the Creative Commons Attribution -ShareAlike 3.0 Unported 3.0/deed.en) on either Wikipedia.org or Wikimedia Commons:Red rose - Source: http://commons.wikimedia.org/wiki/File:Rosa Red Chateau01.jpg; author HamachidoriDried rose - Source: http://commons.wikimedia.org/wiki/File:DriedRose 063560.JPG; author Carolineee1991Earth - Source: http://commons.wikimedia.org/wiki/File:Earths.jpg; author Stephen Slade TienInterlinking hearts - Source: http://commons.wikimedia.org/wiki/File:Love Heart symbol rings.svg; authorNevit DilmenPlanking - Source: ; author J. de VlamingSilly Bands - Source: http://commons.wikimedia.org/wiki/File:Shaped Rubber Bands.JPG; author StilfehlerThe following image is used under the Creative Commons Attribution-Share Alike 2.5 Generic license d.en) from Wikimedia Commons:Internet sign - Source: gn.jpg; author cawi2001The following image is used under the Creative Commons Attribution 2.0 Generic license n) from Wikimedia Commons:Last petal - Source: http://commons.wikimedia.org/wiki/File:Last petal Loves me.jpg; author Louise Docker(title page image)Lesson 2 – Level C Romeo and Juliet 2012 Creative Learning Exchange 17
Lesson 2 - Level C Romeo and Juliet 2012 Creative Learning Exchange 5 Lesson 2 - Handout 1 Literature Connection to The Tragedy of Romeo and Juliet Choose two variables from the list below or create your own variables. Create at least two line graphs showing what happened over the course of the play, Romeo and Juliet.

