Transcription
Public Disclosure AuthorizedReport No. 54371-BYBelarusBelarus Economic Policy Notes: Note No.3June 25, 2010Poverty Reduction and Economic Management UnitEurope and Central Asia RegionPublic Disclosure AuthorizedPublic Disclosure AuthorizedPublic Disclosure AuthorizedTrends and Issues in the Services SectorDocument of the World Bank
CURRENCY AND EQUIVALENT UNITS(as of June 25, 2010)Currency Unit Belarusian Rubel (BYR)US 1.00 BYR 3,017GOVERNMENT FISCAL YEARJanuary 1 – December 31ABBREVIATIONSBEEPSBusiness Environment andEnterprise Performance SurveyBelstatNational Statistical Committee of theRepublic of BelarusBOPBalance of PaymentsBSBusiness ServicesCOMTRADE Commodity Trade Database,United Nations Statistical DivisionCPIConsumer Price IndexDBDoing BusinessDPLDevelopment Policy LoanEBRDEuropean Bank for Reconstructionand DevelopmentECAEurope and Central Asia RegionEurostatEuropean Statistical AgencyFDIForeign Direct InvestmentsFSUFormer Soviet UnionGDPGross Domestic ProductHICsHigh Income CountriesHRHuman SOEsTFPULCVAVATWITSWTOVice PresidentCountry DirectorSector DirectorSector ManagerTask Leaderii:::::International Bank forReconstruction and DevelopmentInternational Financial CorporationInternational Monetary FundLabor ProductivityMiddle Income CountriesNational Bank of BelarusNon-state enterprisesOrganization for EconomicCooperation and DevelopmentResearch and DevelopmentFederal State Statistics Service ofRussian FederationSmall and Medium EnterprisesState-owned EnterprisesTotal Factor ProductivityUnit Labor CostsValue AddedValue Added TaxWorld Integrated Trade SolutionWorld Trade OrganizationPhilippe H. Le HouerouMartin RaiserLuca BarboneBenu BidaniMarina Bakanova
ACKNOWLEDGEMENTSThis Policy Note was prepared by a team comprising Marina Bakanova (Task Team Leader,ECSP3), Alexander Gotovsky (Consultant), Olasupo Olusi, and Maryna Sidarenka (ECSP3).The team gratefully thanks the Government Interagency Working Group led by the DeputyMinister of Economy Ms. Tatiana Starchenko for guidance, cooperation, and support at all stagesof the preparation of this Note. The intensive efforts of the Ministry of Economy, the Ministry ofFinance, the Ministry of Industry, the National Bank of Belarus, and other agencies in helpingprepare this report are gratefully acknowledged. The team is particularly grateful to the FirstDeputy Chairman of the National Statistics Committee (Belstat) Ms. Irina Kostevich and otherstaff of the Belstat for the high quality and timely statistical support. In addition, the teambenefited greatly from discussions with representatives of the donor community in Belarus, localthink tanks, and independent experts. This Note reflects findings of the various missions during2008-2009 as well as feedback received during workshops in June and October 2008 and a highlevel seminar in March 2010. The team also benefited from the visits of the following enterprises:Atlant (main product – refrigerators), Zdravushka (dairy products), Belarus tractor plant,Belkommunmash (trams and trolleybuses), and Belaz (heavy trucks).Peer Reviewers were Celestin Mongaand Albert Zeufack. The Note was prepared under theguidance and advise of Luca Barbone, Benu Bidani and Asad Alam. Martin Raiser advised theteam and provided detailed comments on the draft Note. Valuable inputs and suggestions werealso received from Zeljko Bogetic, Pablo Saavedra, Chris Jarvis, Shuang Ding, Dmitry Kovtun aswell as other Bank and IMF colleagues.Liudmila Mazai and Larysa Hrebianchukpreparation process.provided excellent support during the entireiii
Table of ContentsMain messages . viTrends and Issues in the Services Sector . 1I. Services Sector in Belarus: General Trends . 1II. Business services . 6III. Trade in services . 13IV. Business environment and regulatory issues . 17V. Conclusions and policy implications . 22References . 24Annex A1. 25Annex A2. 29TablesTable 1.1: Sectoral GDP and employment shares and contributions to growth . 3Table 2.1: Use of business services by industrial enterprises . 7Table 3.1: Trade in services growth: Belarus and neighboring countries . 14Table A1.1: Business services outsourcing by ownership type of provider . 25Table A1.2: Factors of outsourcing . 26Table A1.3: Factors of provision of BS in-house . 27Table A1.4: Unsatisfied demand for business services . 28FiguresFigure 1.1: GDP per capita and share of services in GDP. . 2Figure 1.2: Structure of Value Added at factor cost, 2001, % total* . 2Figure 1.3: Structure of Value Added at factor cost, 2008, % total* . 2Figure 1.4: Sectoral shares in employment, percent total, 2001-08 . 3Figure 1.5: TFP growth in industry . 4Figure 1.6: TFP growth in services . 4Figure B 1.1: Employment structure, % total . 5Figure B 1.2: Value Added structure, % total . 5Figure B 2: Structure of VA: Belarus and comparative countries. . 5Figure 1.7: Labor productivity by sector (national-wide LP 1) . 6Figure 1.8: Growth in Labor Productivity (national-wide LP growth 1) . 6Figure 2.1: Choice of business services provider: logistics. 8Figure 2.2: Choice of business services provider: development of new products. 8Figure 2.3: Choice of business services provider: HR services, personnel selection and training . 8Figure 2.4: Choice of business services provider: servicing of technological equipment . 8Figure 2.5: Extent of business services use in the last 2-3 years . 10Figure 2.6: Changes in outsourcing in the last 2-3 years. 11Figure 2.7: Use of new product development services and sales during crisis . 12Figure 2.8: Use of HR services and export during crisis . 12Figure 3.1: Export, Import and Balance of trade in goods, US millions . 13Figure 3.2: Export, Import and Balance of trade in services, US millions . 13Figure 3.3: Structure of services export, 2001, % total . 14Figure 3.4: Structure of services export, 2008, % total . 14Figure 3.5: Services export growth by type of services and by period. 15Figure 3.6: Structure of services import, 2001, % total . 15Figure 3.7: Structure of services import, 2008, % total . 15iv
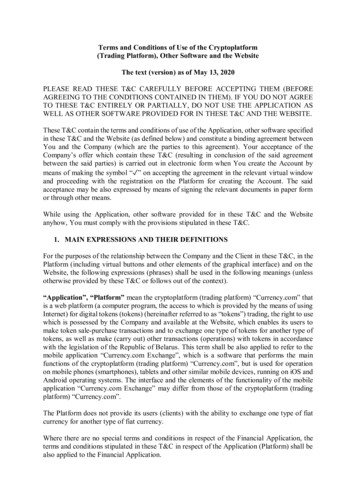
Figure 3.8: EBRD reform indices: Belarus and neighboring countries, 2009 . 16Figure 4.1: Percent of firms identifying issue as major constraint to growth. 17Figure 4.2: Percent of firms identifying issue as most serious obstacle to growth . 17Figure 4.3: Belarus: most severe obstacles for services firms growth as compared to neighboringcountries, percent of firms identifying issue as most serious obstacle to growth. 18Figure 4.4: Percent of firms indentifying labor skill levels as major or severe constraint for firmgrowth. 18Figure 4.5: Formal training: Belarus and selected countries . 19v
Main messagesThe overall state of the services sectorBelarus has pursued a deliberate policy of supporting industrial and agricultural growth at theexpense of services. Moreover, this policy has gone beyond ―benign neglect‖ of this importantsector while promoting other priority segments of the economy. In fact, the regulatoryenvironment and the quality of the business climate have additionally constrained thedevelopment of many labor intensive services. As a result, the size of the sector and itscontribution to growth and employment is low for the country’s level of development. This is aserious problem for Belarus’s long-term growth prospects as its favored sectors—industry,agriculture, and exports — are facing a loss of competitiveness even in their traditional markets,and the recovery of global and domestic demand is bound to be very gradual.If the regulatory and administrative barriers are reduced, growth in the services sector could act asa potent engine of growth, both through increased productivity and synergies with manufacturinggrowth.The focus on business services and trade in servicesThe underdevelopment of ―market services‖ and, especially, business support services may beholding back the supply and the growth of manufacturing and FDI. Excessive regulations prevententry and growth of the services sector, hampering competition, productivity, quality, availabilityand affordability of services for consumers (private and public, households and businesses).With gradual changes in the incentives structure from enterprises being forced to meetquantitative targets towards efficiency and innovation, the demand for high-quality specializedbusiness services is likely to increase. Moreover, a wide range of services is potentially attractivefor FDI should further liberalization and privatization progress, removing barriers to entry notonly for foreign suppliers, but also for new domestic (private) firms.Business climate for the services sectorThe services sector, home of many small and medium-size enterprises (SMEs) in Belarus, hasbeen a "foster child" of government's policy. Firms in this sector are facing major hurdles of theinvestment climate such as excessive tax and administrative burden, difficult access to resources,and skills shortages. Also, unresolved issues in ensuring intellectual property rights might becomea serious impediment for growth in the R&D and human-capital intensive business services.The lagging services sector reform impedes FDI inflow and further growth: reducing the barriersthat restrict FDI in services may help accelerate productivity growth in the manufacturing sector.Towards more balanced growth strategyBelarus’s economic structure has been highly distorted in favor of large state industrial andagricultural companies at the expense of SME and the private sector, especially in services. Whilethis structure was able to deliver high growth rates in the context of a favorable externalenvironment and underpriced energy supplies, this is much less likely to be the case goingforward. As a result, it might be prudent to adopt a more balanced growth strategy aimed atrebalancing growth in Belarus towards a more efficient economic structure in the medium term.Such a structure would be more open to entry, operation, and growth of the private sector ingeneral, and the services sector in particular. Importantly, services could play a greater role ingeneration of jobs and incomes. This strategy needs to be implemented through a set of policiesaddressing both across-the-board and sector-specific obstacles to private sector development andgrowth.vi
TRENDS AND ISSUES IN THE SERVICES SECTOR1.Policy-makers in many fast growing countries increasingly recognize the importance ofgrowth of the services sector, both export and domestic services.1 The services sector has been amajor growth area during the transition from socialism and a primary incubator of new jobs.22.The objective of this Policy Note is to analyze trends and issues in the developmentof the services sector in Belarus in order to understand its untapped growth potential,especially that of market services. To that end, the Note starts with an analysis of general trendscompared to the countries at a similar level of development, as well as compared to theneighboring transition economies. Next, it analyzes the development of business support servicesin Belarus as a crucial growth area with positive spillovers to the manufacturing sector and theeconomy as a whole. The Note continues with an overview of trends in trade in services as tradeopenness is one of the important channels for improving services sector performance. And,finally, the Note looks at the business environment in which the services sector operates vis-à-visthe manufacturing sector and other countries in the region. The Note concludes with a summaryof major findings and some policy implications.3.The analysis is complicated by the fact that services are a very heterogeneoussector, and there are coverage and statistical issues. In general, data on services (both fromnational and international sources) are weak. In addition, the analysis of the services sector and,especially, of the use of cross-country comparisons is complicated by the fact that Belarus usesold Soviet classification of branches of the national economy, while the new classification, whichis compatible with international classifications of economic activities, will be in effect only fromJanuary 1, 2011. Since new data series are still under construction and given that theirpreliminary use does not change major conclusions of the Note (as shown in Box 1), the analysisreported here is based on the data according to the old classification.4.The analysis is based on various sources, including official statistics, provided to theteam by the National Statistics Committee (Belstat) and the National Bank of Belarus(NBRB), as well as on international statistical sources (the World Bank, the IMF, the Eurostat,and the OECD). It uses extensively the results of the Business Environment and EnterprisePerformance Surveys (BEEPS), conducted jointly by the World Bank and the EBRD. Theanalysis of the development of business support services (BS) is based on the results of a surveyof 516 industrial enterprises in Belarus, specially commissioned for this Note.I.SERVICES SECTOR IN BELARUS: GENERAL TRENDS5.The share of services in GDP in Belarus is significantly lower than it what would beexpected, given its income level. Empirically, for most countries, the higher GDP per capita, thehigher the share of services in GDP; Belarus, however, is below the trend line of services to GDPcompared to the other growing economies (Figure 1.1). The underdevelopment of the servicessector may impede further country growth, especially in the context of competitivenesschallenges faced by industry and exports in the context of a much more constrained post-crisisenvironment.1Many countries could be a good example of this, for instance, Republic of Ireland, India, Philippines,South Korea, and Malaysia.2See, e.g. World Bank (2008).
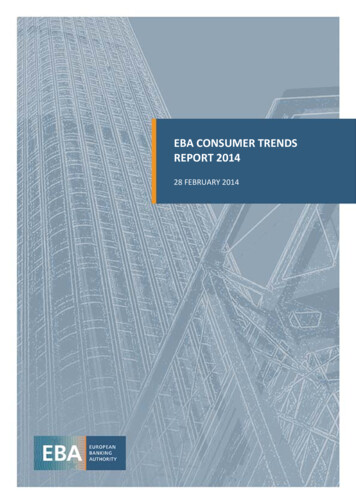
Figure 1.1: GDP per capita and share of services in GDP.9080Services to GDP, %70HUNPOL .0GDP per capita, 2005 PPP US Source: WB staff calculations on WDI data.6.The contribution of services to growth in Belarus has been relatively moderate anddeclining, especially since 2000. The services sector contributed over 50 percent to growth inmiddle-income countries (MICs) and almost 90 percent in high-income countries (HICs) between1995 and 2005, and the trend is expected to continue.3 In Belarus, at odds with the internationalexperience, the value-added structure has been shifting further away from services, andcontribution of the services sector to growth has fallen. Between 2001 and 2008, the share ofindustry and construction in the country’s value added increased by almost 11 percentage pointsand reached 46 percent, approaching the pre-independence level.4 The growth was increasinglydriven by industrial and construction growth: these sectors were responsible for 2/3 of overallGDP growth in 2008 as compared to 30 percent in 2001. The share of trade and catering increasedby 3 percentage points, but the share of ―other services‖ shrank by 12 percentage points. Evensuch traditional services as transport and communications played a smaller role in 2008 ascompared to 2001 (Figures 1.2-1.3 and Table 1.1).Figure 1.2: Structure of Value Added atfactor cost, 2001, % total*10.6Figure 1.3: Structure of Value Added atfactor cost, 2008, % ionTransport andcommunicationsTransport andcommunications12.9Trade and cateringTrade and catering9.946.212.3Other services10.3Other servicesSource: WB Staff calculations on Belstat data.*In 2005 constant prices.3McKinsey (2010).Among all FSU countries, Belarus (after Armenia) had the most severe structural distortions such as adegree of over-industrialization (measured by the difference between actual and predicted share of industryin GDP) (see, De Melo at al., 1997).42
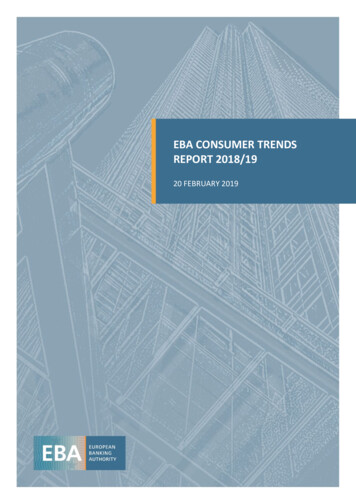
7.The services sector already provides half of employment in Belarus, but employmentgrowth become sluggish during the decade before the global crisis. Services were responsiblefor 54 percent of jobs in 2008 as compared to about 40 percent in 1991. However, much of theemployment growth in services took place during the earlier decade, in the 1990s. Since 2001, ithas slowed down substantially with the share of services in total employment increasing by lessthan 3 percentage points.5 Moreover, despite a high rate of economic growth during 2001-08,which brought Belarus to the club of upper middle-income countries (MICs), the structure ofemployment in Belarus was surprisingly stable (Figure 1.4). As in other MICs and transitioneconomies, there was further reduction in agricultural employment. At the same time, contrary tothe experience in many MICs, the share of industrial employment increased in Belarus, while theshare of all market services but trade and catering shrank. During 2005-08, compared to 2001-04,there was a redistribution of employment from agriculture to industry and trade and catering withno changes in other services (including transport and communication). Most remarkable was thedecline in the contribution of other services to GDP growth (Table 1.1). Between 1995 and 2005the services sector accounted for 85 percent of net job growth in MICS and for all net job growthin HICs.6 It is yet to happen in Belarus.Figure 1.4: Sectoral shares in employment, percent total, 2001-08100.090.0Other market services80.0Non-market services70.0Industry andconstructionTrade and catering60.050.0Transport andcommunicationsAgriculture 200620072008Source: WB Staff calculations on Belstat data.Table 1.1: Sectoral GDP and employment shares and contributions to growthShare in GDP, %2001200420052008Contribution to GDPgrowth2001200420052008Share inemployment, %2001200420052008Agriculture and forestry10.59.30.60.512.711.0Industry and construction36.743.53.35.734.935.8Transport and communication11.910.70.50.87.47.5Trade and catering10.311.91.11.79.09.7Other services30.624.51.20.636.236.1Source: WB Staff calculations on Belstat data.5But even in the 1990s, in spite of the decline in the share of industry in employment, Belarus was still farabove the market economy benchmark (as well as Russia and Ukraine); moreover, the adjustmentpractically halted (see, Raiser, M., Schaffer, M., and Schuchhardt, J. (2004)).6McKinsey (2010).3
8.Total factor productivity (TFP) growth in the services sector was relatively modest butalso relatively flat compared to industrial TFP growth. TFP growth in the services sectorduring 2003-07 was on average 6.2 percent per annum compared to 8.6 percent in industry duringthe same period. TFP growth in industry first almost doubled between 2003 and 2004 (to 18percent) but then decelerated sharply to the 2003 level during 2005; deceleration continued sincethen, and industrial TFP growth fell to less than 1 percent in 2007 (Figure 1.5). TFP growth inservices shows different dynamics: while there had been some deceleration since 2004, it was verygradual, so in 2007 TFP growth in services was still at a rather respectful level – 5.6 percent(Figure 1.6).Figure 1.5: TFP growth in industryFigure 1.6: TFP growth in servicesSource: WB Staff calculations on Belstat data.4
Box 1: Tracking trends in structural change: old versus new classificationAn analysis of time series on Value Added (VA) and employment based on a new classification of economicactivities (OKED) shows that the share of industry and construction in total employment remainedpractically unchanged since 2000, as did the share of non-market services. The share of employment inagriculture, forestry, and fishing fell, while the share of employed in market services increased, almostentirely due to an increase in employment in trade (wholesale and retail) (Figure B1.1).The new classification permits the separation of employment in trade from employment in ―hotels andrestaurants‖ (in OKONX, these two sectors were accounted together as ―trade and catering‖) and shows thatemployment in ―hotels and restaurants‖ declined over the period (this was disguised by an overall increase inemployment in ―trade and catering‖). This is a very unusual development, signaling serious issues withbusiness climate. Underdevelopment of this sector makes country less attractive for international business,investment, and leisure travelers. ―Hotels and restaurants‖ are also the sector potentially attractive forforeign investment: so far, only one hotel from an international chain has been opened in Belarus.The OKED breakdown shows an increase in the share of industry and construction (albeit to a smaller extentthan the breakdown by OKONX would suggest) and a reduction in the share of agriculture, forestry, andfishery. Shares of both market and non-market services increased, but the latter by a larger extent than theformer, mostly due to an increase in the share of ―public management‖, reflecting increasing governmentinvolvement into economic affairs (Figure B1.2).Figure B 1.1: Employment structure, % totalFigure B 1.2: Value Added structure, % et services (L-O)70.0%Non-market services (L-O)60.0%60.0%Market services (G-K)40.0%Industry and construction (C-F)40.0%30.0%Industry and construction (CF)30.0%Agriculture, forestry and fishing(A-B)20.0%Market services (G-K)50.0%50.0%Agriculture, forestry andfishing (A-B)20.0%10.0%10.0%0.0%0.0%2000 2001 2002 2003 2004 2005 2006 20072000 2001 2002 2003 2004 2005 2006 2007 2008Source: WB Staff calculations on Belstat data.Cross-country comparisons based on the compatible classification support the conclusion on Belarus’shighly distorted economic structure biased towards industry, construction, and agriculture with marketservices playing a significantly smaller role compared to their role in other transitional MICs (Figure B2).Figure B 2: Structure of VA: Belarus and comparative 10.0%5.0%0.0%Agriculture, forestry andfishing (A-B)Industry and construction(C-F)Market services (G-K)Non-market services (L-O)BelarusRussiaCzech Lithuania PolandRepSources: Belstat, Rosstat, Eurostat.5
9.There are no signs of catching up of labor productivity in industry and non-traditionalmarket services. Labor productivity in two traditional sectors of market services, transport andcommunication and trade and catering, was higher than the economy-average and laborproductivity in industry and construction across the two periods. However, in 2005-08 thedifference between industrial labor productivity and productivity in the transport andcommunication sector became smaller, while the trade and catering sector maintained itsproductivity advantage vis-à-vis industry and construction. As far as other market services areconcerned, these sectors were lagging behind other sectors of economy, both in terms of the laborproductivity level and the rate of labor productivity growth (Figures 1.7-1.8). Hence, there is apotential for improvement in productivity and efficiency of the sector that would contribute to anincrease in productivity and efficiency of the economy as a whole.Figure 1.7: Labor productivity by sector(national-wide LP 1)1.81.61.41.21.00.80.60.40.20.0Figure 1.8: Growth in Labor Productivity(national-wide LP growth 20.0Source: WB staff calculations on Belstat data.II.BUSINESS SERVICES10. Business services are mainly supplied to other enterprises, while the public sector andhouseholds can also use these services (especially legal, architectural and engineering, andtechnical testing activities). Many of these services could be provided in-house by enterprisesthemselves or purchased (outsourced) from service providers, which enables the client enterpriseto focus on its core activities. Rapid growth in business services is typically an outcome ofspecialization in a market economy. As companies focus increasingly on their core functions,they buy more non-core services from third parties (i.e. outsource). The business services industryhas been growing much faster than the market sector as a whole in MICs and HICs, and it hasbeen an important job-creating machine. Apart from its dynamism, the business services sector iswidely regarded as strategic because of its contribution to the modern knowledge economy.Availability of high quality and wide variety of business services may impact decisions about theFDI location. Access to high-quality business services has a positive effect on all sectors ofeconomy – users of these services. Many empirical studies have found a significant positiveproductivity effect of business services use.77For instance, an increase in the use of BS in 1988-90 by 1 percent resulted in VA growth by 2.6-4.2percent in four EU countries – Italy, France, Germany, and the UK. For more examples of empiricalfindings regarding a positive link between BS use and productivity see, Henk L.M.Kox (2004).6
11. This section draws on the results of the survey of 516 industrial enterprisesrepresenting eight major industrial sub-sectors, conducted in August 2009. The mainobjectives of the survey were to (i) look at the demand-side of market for business services inBelarus, i.e. to identify factors, affecting the use of different business services, and theiroutsourcing; (ii) access major constrains for business services development and a link betweenthe use of business services and enterprise performance.12. The intensity of business services outsourcing depends on the type of business services.The survey results suggest the following: (i) in Belarus, a rather small percentage of firms doesnot use business services at all – this is true in relation to all business services; (ii) Belarusianindustrial enterprises, as a rule, outsource marketing and advertising; logistics, transportation andfreight storage; after sales servicing of the information system (software, hardware, networks,etc.); and development and follow-up of design, technical and other types of documentationbusiness services; (iii) such business services as servicing of technological equipment (exceptwarranty servicing), managerial consulting, analytical and information support, and HR services,personnel selection and training are often outsourced but also frequently provided in-house; (iv)such business services as legal and accounting services and, development of new lines ofproducts are provided mostly in-house; and (v) ―other business services‖ are often or regularlyoutsourced. These business services include audit and the quality management system (50 percentof respondents), testing, control and technological-engineering maintenance of specificequipment and products, certification, privatization, patent services, and office cleaning (Table2.1).Table
The objective of this Policy Note is to analyze trends and issues in the development of the services sector in Belarus in order to understand its untapped growth potential, especially that of market services. To that end, the Note starts with an analysis of general trends