Transcription
150 5.SugarThis chapter describes the market situation and highlights the medium-termprojections for world sugar markets for the period 2020-29. Price,production, consumption and trade developments for sugar beet, sugarcane, sugar, molasses, and high-fructose corn syrup are discussed. Thechapter concludes with a discussion of important risks and uncertaintiesaffecting world sugar markets during the coming ten years.OECD-FAO AGRICULTURAL OUTLOOK 2020-2029 OECD/FAO 2020
1515.1. Market situationIn the current sugar marketing season (October 2019-September 2020), production is expected todecrease significantly, compared to the last two surplus seasons, which saw India surpassing Brazil as theworld’s leading sugar producer.1 However, Brazil should recover its leading position as India’s productionis affected by unfavourable weather conditions. Dry weather has also affected production in the EuropeanUnion and Thailand, both important sugar markets. The only marked increase in sugar output occurs inthe Russian Federation, where a bumper crop is expected to lead to an oversupplied market. Globally, theproduction level of the current season will be close to the average level of the last decade.Global per capita consumption for caloric sweeteners continues to rise, albeit with noticeable regionaldifferences. It has reached high levels in developed countries, South America and some Asian sugarproducing countries, where growth is low or even negative. In Africa and most of Asia (Figure 5.1),consumption levels are low and expected growth is strong. The COVID-19 pandemic is having a strongimpact on demand. Out-of-home consumption has decreased significantly as a result of the physicaldistancing measures and other restrictions imposed to reduce the spread of the virus. It is now widelyrecognised that high levels of sugar consumption can contribute to illnesses and health problems includingdiabetes, overweight and obesity. In response, countries with high sugar consumption are taking action toreduce sugar intake.Previous to the outbreak of the coronavirus, sugar inventories were shrinking, with nearly half of thedestocking taking place in India. Currently, with uncertain consumption and trade, the final state of globalstocks for the season is also uncertain.5.2. Projections highlightsIn real terms, raw and white sugar prices are expected to remain flat over the projection period, while innominal terms, prices are projected to trend slightly upward ( 2% p.a.). This is a result of a projected tighterworld market balance (supply closer to demand) than in the past decade. The relatively small white sugarpremium (the difference between white and raw sugar prices), USD 70/t during the base period (20172019), is projected to increase slightly in absolute terms to USD 83/t by 2029.Sugarcane and sugar beet production are both projected to grow, driven by both area expansion and yieldimprovements. Growth is expected to be greater for sugarcane due mainly to faster area expansion. Sugarbeet production and processing is more mechanised and will continue to benefit from productivity gains.Sugarcane, cultivated predominantly in tropical and sub-tropical countries of Asia, Latin America, andAfrica, will continue to be the main crop used to produce sugar.Global sugar production is projected to recover from the current dip and expand by 15%, from 176 Mt inthe base period to 203 Mt by 2029, with 96% of the projected increase originating from developingcountries. The economic assumptions underlying the projections, notably the depreciation of the Brazilianreal vis-à-vis the US dollar, will help towards a resumption of investment in the sector, with Brazil’s sugarexport prices attractive enough to boost its production for the international markets. Starting on 1 January2020, Renovabio, Brazil’s federal program to curb carbon emissions will increase the consumption ofethanol thereby benefit the sugarcane industry. Brazil is projected to maintain its position as the world'slargest sugar producer and to account for about 18% of the world's sugar output by 2029. India andThailand are expected to progressively recover from their current low production season, with Indiareaching levels close to those of Brazil by 2029. In absolute terms, and when compared to the base period,the major changes in global production are projected for Brazil ( 7.0 Mt), India ( 4.6 Mt), Thailand( 2.8 Mt), and the People’s Republic of China (hereafter “China”) ( 1.4 Mt). In response to the highernominal prices and the increasing global consumption, the average annual growth rate of sugar productionis expected to be slightly higher than that of the last decade.OECD-FAO AGRICULTURAL OUTLOOK 2020-2029 OECD/FAO 2020
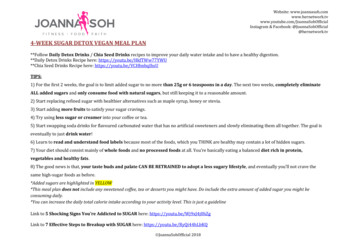
152 Driven by sustained economic expansion and moderate population growth, sugar demand in Asia isexpected to represent more than half of global consumption by 2029. In absolute terms, Africa willexperience a similar population increase to that of Asia, although the increase in its consumption of sugarshould be significantly lower. Sugar consumption growth in Africa (in absolute terms) is projected to beless than half that projected for Asia. In terms of per capita consumption, a slight slowdown in the growthrate is expected in both regions.In other parts of the world, especially in high-income countries, per capita consumption will continue todecline as a result of changing consumer habits regarding sugar intake. Consumption of the mainalternative caloric sweetener, high fructose corn syrup (HFCS), is projected to increase by 1.9 Mt to reach15 Mt in 2029, driven mainly by an increase in demand from China, where per capita consumption levelsare very low. Increasing awareness of the health effects of high levels of consumption of caloric sweetenersreinforced by policy actions will impact consumption trends. Sugar and HFCS will continue to representabout 90% of the sweetener market.Figure 5.1. Global caloric sweeteners: Production and per capita consumption in 2017-19and in 20292017-19 Production2029 Production2017-19 Consumption (right)2029 Consumption 10100North AmericaLatin AmericaEuropeOceaniaAsiaAfricaWorld0Note: Sweeteners include sugar and high fructose corn syrupSource: OECD/FAO (2020), “OECD-FAO Agricultural Outlook”, OECD Agriculture statistics -en.StatLink 2https://doi.org/10.1787/888934141665The projections are based on several assumptions, which include productivity trends, macro-economicconditions, and national domestic policies for the sugar subsector. In the short term, the COVID-19pandemic is the greatest source of uncertainty, affecting macroeconomic conditions, consumption andtrade. However, it could affect 2020/2021 production in the labour-intensive production systems of Indiaand Thailand. In addition to the pandemic, a main source of uncertainty for the Outlook relates to theallocation of the sugarcane between ethanol and sugar in Brazil. Crude oil price fluctuations and theRenovabio ethanol program could have significant effects on the international market for sugar by alteringthe export levels from Brazil. Production in India is characterised by frequent production swings and thesecould impact the international market, given that India is also the world’s largest consumer. India andThailand also have bioethanol projects that, if realised, could decrease the availability of cane for sugarproduction, strongly impacting markets as well. Heightened concerns over health issues associated withexcessive caloric sweetener consumption are also a source of uncertainty, as they can curtail growth indemand to levels lower than in this Outlook. Finally, the fact the sugar sector remain highly regulatedconstitutes a source of uncertainty for the projections.OECD-FAO AGRICULTURAL OUTLOOK 2020-2029 OECD/FAO 2020
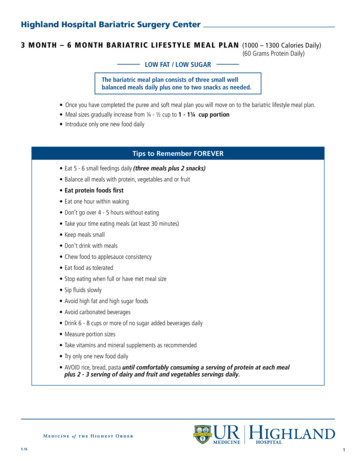
1535.3. PricesSugar prices decreased in recent years to levels not seen since the middle of the last decade. In nominalterms, they are projected to increase over the outlook period. With a return to higher profitability, the mainexporters (mainly Brazil) will resume their sugar exports. Assuming normal weather conditions, sugar cropyields, notably in India and Thailand, are expected to progressively come back to levels more in line withthe trend of previous years. Growth in world demand is foreseen to remain within the range of the growthobserved in the previous decade. This results in flat real sugar prices over the course of the outlook period.In absolute terms, global stocks are expected to replenish slowly. In relative terms, from 2022 on, theystabilise at a stock-to-use ratio of close to 44.7%.Over the medium term, real sugar prices are expected to remain at the levels of 2019 (Figure 5.2), i.e. lowerthan the average of the last 20 years, where prices experienced upward pressure through the competitionfrom biofuels (ethanol). By 2029, the nominal world price is projected to be USD 386/t (USD 17.5cts/lb) forraw sugar and USD 469/t (USD 21.3cts/lb) for white sugar. The white sugar premium is projected to growslightly to USD 83/t by the end of the outlook period, as a result of a slightly increasing demand.Figure 5.2. Evolution of world sugar pricesRaw sugarUSD/tWhite sugar1000900800700600500400300200Nominal 2009200401999100Real pricesNote: Raw sugar world price, Intercontinental Exchange contract No.11 nearby futures price; Refined sugar price, Euronext Liffe, FuturesContract No. 407, London. Real sugar prices are nominal world prices deflated by the US GDP deflator (2019 1).Source: OECD/FAO (2020), “OECD-FAO Agricultural Outlook”, OECD Agriculture statistics -en.StatLink 2https://doi.org/10.1787/8889341423305.4. ProductionSugar markets are expected to undergo a slow recovery as the sector is capital-intensive and someinvestments were postponed due to low prices. Sugar production is foreseen to expand due to, amongother things, the flexibility of sugar mills to shift between sugar and ethanol production, which reduces theinvestment risks. Sugarcane accounts for around 86% of the sugar crops and sugar beet makes up for theremainder. Sugarcane is a perennial crop that grows mainly in the tropical and sub-tropical regions. Thesame plants can be harvested for several years, although yields decline over time. In addition to sugar andethanol, sugarcane can also be used to produce derivatives such as electricity (through bagasse surplus)and bioplastics. However, it remains a water-intensive crop. Conversely, sugar beet is an annual crop,cultivated mostly in temperate zones. This crop is used to produce a wide range of products, including foodOECD-FAO AGRICULTURAL OUTLOOK 2020-2029 OECD/FAO 2020
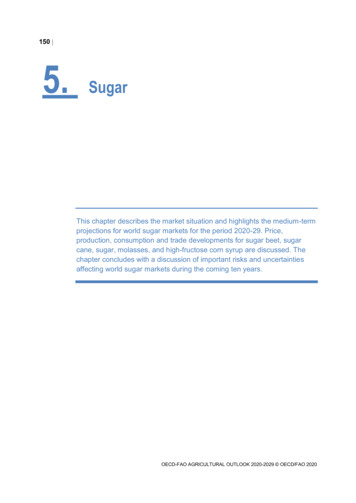
154 (sugar), feed, bio-based products for the industry (pharmaceuticals, plastics, textiles, and chemicals), andethanol.Over the outlook period, the increase in the production of sugarcane is foreseen to come from higher yieldsand area expansion. In the case of sugar beet, increases are expected to be due mainly from yields.Sugarcane production is projected to grow by 1.1% p.a., slightly higher than during the last decade, withBrazil, India, and Thailand anticipated to contribute to 74% of the change in global output volume (49%,18%, and 6% respectively). Prospects are less robust for sugar beet with an anticipated production growthof 0.7% p.a., compared to 2.1% p.a. over the last decade (Figure 5.3). Expansions are expected in Egypt( 6.9 Mt), Ukraine ( 3.3 Mt), Turkey ( 2.9 Mt) and China (2.9 Mt), while contractions are projected in theEuropean Union and the Russian Federation (-3.7 Mt and -1.1 Mt respectively), these two accounted formore than half of the global increase in sugar beet during the last decade.Production growth in the European Union (with respect to 2017-2019, the post-quota period that beganwith a record sugar crop year) is projected to be one of the lowest. In the Russian Federation, despite astrong national strategy for auto-sufficiency from the past few years, which led to a massive productionsurplus in 2019, production costs should remain high and the sugar output is not expected to surpass thelevels reached during the base period. In the US sugar sector, where both sugar crops are cultivated,higher yields are foreseen but increasing input costs (i.e. from improved harvesting technologies) willdampen production growth of sugar beet after a few years, while some growth in sugarcane production isexpected as this crop is more stable given its perennial nature.Figure 5.3. World sugar crops 002017-192029Sugar beet, world2017-192029Sugarcane, India2017-192029Sugarcane, Brazil2017-192029Sugarcane, rest of the worldSource: OECD/FAO (2020), “OECD-FAO Agricultural Outlook”, OECD Agriculture statistics -en.StatLink 2https://doi.org/10.1787/888934142349Over the outlook period, the shares of sugar crops used for sugar and ethanol are projected to be about78% for the production of sugar (75% in the case of sugarcane and 96% in the case of sugar beet) and22% for ethanol. Brazil will continue to be the main producer of sugar and sugarcane-based ethanol,producing 39% of the world's sugarcane by 2029. This sugarcane will be used for 18% of global sugarproduction and 90% of global sugarcane-based ethanol production (compared to 17% and 91% during thebase period).As of 2020, world production is projected to increase again at a stronger average growth rate than in theprevious decade (1.4% vs 0.8% p.a.), responding to attractive sugar prices driven by steady growth inglobal demand. Most of the production increases are expected to occur in developing countries, which areanticipated to represent 78% of global sugar production in 2029 (compared to 75% in the base period).OECD-FAO AGRICULTURAL OUTLOOK 2020-2029 OECD/FAO 2020
155The leading regions are Asia and Latin America. Asia is projected to expand its share in global productionfrom 41.2% during the base period to 41.6% in 2029, and Latin America from 29.2% to 30.2%.Brazil, the world’s biggest supplier, has been persistently in debt over the last ten years. The current worlddeficit, which is driving up prices, as well as the depreciation of the Real increase the profitability of thissector, thereby attracting investments. However, the sugar sector in Brazil will continue to be challengedby biofuels, with more than half of its sugarcane being used to produce ethanol. Brazil’s dominance as theworld's top producer and exporter will be maintained over the outlook period, however, with productionprojected to reach 37 Mt ( 7 Mt compared to the base period) by 2029.The world's second largest sugar producer is India, where production is expected to recuperate from thecurrent lows and progressively expand, partly driven by renewed public support to this sector. On the backof remunerative returns, production is projected to increase by 4.4 Mt over the next decade, reaching 35 Mtin 2029. Thailand will maintain its market position as the world's fourth largest producer (the EuropeanUnion is in the third place), and is projected to see a similar average annual growth to the one of the lastdecade, progressively recuperating from the slight decrease of the current season and stimulated by worldsugar market prices. Thailand is projected to produce as much as 15.8 Mt by 2029. China is expected toexperience accelerated growth in sugarcane and sugar beet production during the first years of theprojection period, supported by the 2015-2020 National Plan. Production costs are expected, however, toremain high when compared to neighbouring countries. Some safeguard duties also limit competitiveimports. These factors are expected to continue to protect the sector. By 2029, Chinese sugar productionis projected to reach 12.2 Mt. In Pakistan, the government strongly support the sugar sector throughguaranteed prices to farmers. Production is foreseen to increase, but at a lower growth rate per annum:2.7% compared to 3.6% during the last decade, to reach 7.4 Mt by 2029.In Africa (South Africa not included), growth in output will be driven by higher real sugar prices. Sugaroutput is projected to increase by 40% to reach 15.8 Mt by the end of 2029 compared to the base period,due to production expansion in Sub-Saharan countries that is supported by investments at the farm andthe mill level. Despite this production growth, the continent will continue to represent a small share of theworld output (8% in 2029).During the last decade, developed countries accounted for more than one quarter of the increase of globalsugar output, with significant growths in the European Union, the Russian Federation, Australia, and theUnited States. This share, however, is projected to decrease to 4% over the forecast period (Figure 5.4),with a projected growth of only 0.8% p.a. (being 1.7% p.a. in developing countries). In this group ofcountries and relative to the base period, only South Africa is foreseen to significantly extend its production( 0.5 Mt). In the European Union and the Russian Federation, production levels should not change muchover the next ten years. Still, the European Union will maintain its position as the world’s third largestproducer. As for the Russian Federation, the efforts of recent years towards self-sufficiency have beensuccessful, but the country remains a high cost producer with exports not competitive enough forproduction to continue to increase over the next decade. Not much change is expected in the United Statesas the sugar sector remains heavily influenced by government policies that support domestic production.These policies include: the Sugar Loan Program that support prices paid to farmers; the Sugar MarketingAllotments that either force or encourage producers to fulfil 85% of domestic consumption; the FeedstockFlexibility Program to divert any sugar surplus to ethanol production rather than sugar loan forfeitures tothe USDA’s Commodity Credit Corporation; and trade barriers that limit imports (through tariff rate quotas,regional agreements, and the Suspension Agreements on Sugar with Mexico).After a period over the short term during which India will continue to undertake half of the world’s sugardestocking, the market will return to surplus and global sugar stocks will increase moderately over the nextdecade. The global stock-to-use ratio is projected to return to a level close to its long-term average of 45%(from 49% in the base period).OECD-FAO AGRICULTURAL OUTLOOK 2020-2029 OECD/FAO 2020
156 Figure 5.4. Sugar production by crop2017-192029Mt oAustraliaSugarcane countriesAfricaChinaUnited StatesSugar beet & sugarcane countriesEuropeanRussiaUnionSugar beet countriesNote: Data are expressed on a tel quel basis (tq)Source: OECD/FAO (2020), “OECD-FAO Agricultural Outlook”, OECD Agriculture statistics -en.StatLink 2https://doi.org/10.1787/8889341423685.5. ConsumptionGlobal sugar consumption is projected to continue growing at around 1.4% p.a., reaching 199 Mt by 2029,underpinned by population and income growth. Over the outlook period, the average world level of percapita consumption is expected to increase from 22.5 kg/cap to 23.5 kg/cap, although considerablevariations between regions and countries will occur (Figure 5.5).Figure 5.5. Per capita sugar demand in major countries and regions2017-192029% change in na-10Source: OECD/FAO (2020), “OECD-FAO Agricultural Outlook”, OECD Agriculture statistics -en.StatLink 2https://doi.org/10.1787/888934142387OECD-FAO AGRICULTURAL OUTLOOK 2020-2029 OECD/FAO 2020
157Increases in global sugar consumption over the next ten years are expected to come exclusively from thedeveloping countries; declining trends are foreseen in other more mature markets in general. Asia andAfrica will be the largest contributors to additional demand, with respectively 68% and 30% of additionaldemand. In those two sugar deficit regions, consumption levels are often low compared to other regions,and the prospects for growth are high. The higher growth rate in Asia will stem from a higher demand insugar-rich confectionery products and soft drinks, generally in urban areas, while that of Africa will comefrom a higher direct consumption largely driven by population growth. In Latin America, which already hashigh per capita consumption levels, little growth is foreseen (2% over the entire outlook period).In Asia, it is expected that India, followed by Indonesia, China, and Pakistan, will experience the largestincreases in sugar consumption. Per capita consumption is very low in China and LDC Asia (less than13 kg per year during the base period), but the annual growth rate in these countries will not change muchcompared to the last decade as individuals do not favour sweet products and eating habits change slowly.In Africa, the highest increases in total consumption are projected for Egypt and several Sub-Saharancountries, but per capita consumption will remain below 14 kg per year in LDC Sub-Saharan countries,including Ethiopia and Nigeria.In contrast, the level of sugar consumption per capita in many developed countries is expected to continueto decline due to increased concerns about negative health effects of sugar overconsumption: unhealthyweight gains that raise the risk of diabetes (type 2), heart disease and tooth decay. Several countries haveimplemented taxes on caloric sugary products in an attempt to reduce sugar consumption. Mexico was thefirst country to do so at the national level in 2014. In consequence, some multinationals have reduce portionsizes, decrease the amount of caloric sweeteners, or replace the amount of sugar with an equivalentamount of artificial sweetener, the latter having a sweeter taste but fewer calories.The decline in sugar consumption of developed countries is foreseen to be strongest in Canada, theEuropean Union, and the United Kingdom. In the United States, consumption of sweeteners is expectedto remain stable but the share of sugar in per capita caloric sweetener consumption is projected toincrease, from 62% during the last decade to 64.5% by 2029. The idea that HFCS is potentially moreharmful to health than sugar continues to be debated. In the Russian Federation, sugar demand isanticipated to grow, based on domestically produced confectionary products and homemade alcohol. Thedebate on a possible taxation of sugar is still in progress, but sugar is expected to remain a cheap sourceof calories and consumer habits are not expected to change.Owing to its competitiveness in caloric sugary soft drinks, HFCS consumption (dry weight) is projected togrow by 14% or 1.9 Mt by 2029. Global consumption will remain limited to a few countries (Figure 5.6).Like sugar, per capita consumption is assumed to decline in countries where total caloric sugarconsumption is high. China, one of the countries where sweetener consumption is low, is expected to bethe main driver of the increase. Because it is the biggest world producer of starch, it is anticipated thatChina will increase its HFCS supply to fulfil a growing domestic demand, although a lack of profitability islikely to dampen supply growth. In the European Union, growth in consumption will not be as high asanticipated as a result of a stronger than expected competition with sugar. In Mexico, the share of HFCSin the demand for sweeteners is expected to slightly increase over the outlook period because, in responseto the country’s sugar tax, companies tend to replace sugar by “less sugar” in their soft drinks, even if bothproducts are subject to a tax. Conversely, in the United States, the leading HFCS producer, demand forHFCS as a share of global consumption is projected to continue its decline from 46% during the baseperiod to 37% in 2029. However, the country is projected to consolidate further its position as leaderproducer over the next decade, to meet the demand in Canada and Mexico.OECD-FAO AGRICULTURAL OUTLOOK 2020-2029 OECD/FAO 2020
158 Figure 5.6. Share of per capita HFCS in sweetener consumption for major consuming countries2017-192029%20181614121086420United StatesMexicoArgentinaJapanKoreaCanadaChinaEuropean UnionTurkeySource: OECD/FAO (2020), “OECD-FAO Agricultural Outlook”, OECD Agriculture statistics -en.StatLink 2https://doi.org/10.1787/8889341424065.6. TradeOver the coming decade, sugar exports (Figure 5.7) are projected to remain highly concentrated, withBrazil consolidating its position as the leading exporter (from 35% of world trade in the base period to 38%by 2029). The weakening of its currency vis-à-vis the US dollar over the projection period will attractinvestments and improve the industry’s competitiveness. However, the sugar market in Brazil will continueto compete with strong ethanol production. Its sugar exports are projected to expand by 6.3 Mt comparedto the base period.In Thailand, the world’s second largest sugar exporter, very little ethanol is produced directly fromsugarcane (less than 2%); molasses or cassava are used instead. This established Asian sugar produceris expected to progressively recuperate from the current dip in its production to gain international marketshares towards the end of the projection period, accounting for 18% of world sugar exports by 2029 (versus16% during the base period) and reaching 12.7 Mt of sugar exports by 2029. India is projected to haveenough supplies and policy support to maintain the level of its exports at about 4 Mt per year throughoutthe next decade. In Australia, sugarcane will be limited by the availability of irrigated land; in view of thisconstraint, production levels are projected to remain close to the relatively low levels of the current season,which is nevertheless way above domestic demand. Thus, the country will continue to export around 80%of its production.In 1968, the European Union introduced sugar and isoglucose production quotas to guarantee productionand prices. These quotas were abolished in 2017, which led to a decrease in domestic prices and freedexports from their WTO subsidised export limit. Over the next ten years, even though production is notexpected to increase, declining demand will help free high quality white sugar for exports that can be soldat a premium price. These exports will mainly reach sugar-deficit countries in the MENA and Far Eastregions, although they will face competition from the supply of traditional sugarcane refineries, notably inthe MENA region.OECD-FAO AGRICULTURAL OUTLOOK 2020-2029 OECD/FAO 2020
159Figure 5.7. Sugar exports for major countries and regions2017-192029Mt tq302520151050BrazilThailandIndiaAustraliaEuropean UnionMexicoRest of the worldNote: data are expressed on a tel quel basis (tq).Source: OECD/FAO (2020), “OECD-FAO Agricultural Outlook”, OECD Agriculture statistics (database), k 2https://doi.org/10.1787/888934142425World sugar imports are less concentrated than exports (Figure 5.8). Based on the outlook projections,Asia and Africa will see the strongest growth in sugar demand, which in turn will influence the ranking ofmain importers. During the base period, Indonesia and China were the leading importers (at 4.8 Mt each)followed by the United States (2.7 Mt), Malaysia (2.0 Mt), Korea (1.9 Mt), the European Union (1.6 Mt) andIndia (1.5 Mt). Over the next decade, Indonesia, with a strong growth in consumption, is projected toconsolidate its position as the leading sugar importer (7.5 Mt), followed by China (6.3 Mt), the United States(2.7 Mt), Malaysia (2.4 Mt), Korea (2.1 Mt) and India (1.5 Mt). Due to the abolition of sugar quotas, theEuropean Union has become less an attractive export destination for countries with preferential tradeagreements; European Union sugar imports are projected to decrease further to 1.3 Mt by 2029. The EUHFCS trade will not experience significant changes, as production is expected to mostly satisfy internaldemand.Figure 5.8. Sugar imports for major countries and regions2017-192029Mt tq876543210IndonesiaChinaUnited StatesMalaysiaKoreaIndiaEuropean UnionEgyptRussiaNote: Data are expressed on a tel quel basis (tq).Source: OECD/FAO (2020), “OECD-FAO Agricultural Outlook”, OECD Agriculture statistics (database), k 2https://doi.org/10.1787/888934142444OECD-FAO AGRICULTURAL OUTLOOK 2020-2029 OECD/FAO 2020
160 In the United States, traditionally a sugar-deficit country, policies will continue to foster domestic productionand keep a lid on imports. Tariff rate quota (TRQ) allocations under WTO or free trade agreements (FTAs),as well as limited imports from Mexico due to the US Export Limit (set by the US Department of Commerce)will govern import flows. Given the relatively higher sugar prices in the United States, Mexico will continueto export its sugar primarily to fulfil the United States needs. Mexico, in turn, is expected to resort to USHFCS ( 2% or 250 kt by 2029) to meet national demand for sweeteners.Imports are expected to decline in Egypt and in the Russian Federation. In Egypt, large investment projectsare boosting production and imports are anticipated to decrease. In the Russian Federation, the policy ofself-sufficiency has been successful and practically no imports should occur over the next ten years.5.7. Main issues and uncertaintiesThe projections presented in this Outlook assume stable macro-economic and normal weat
projections for world sugar markets for the period 2020-29. Price, production, consumption and trade developments for sugar beet, sugar cane, sugar, molasses, and high-fructose corn syrup are discussed. The chapter concludes with a discussion of important risks and uncertainties affecting world sugar markets during the coming ten years. 5. Sugar