Transcription
2005TransitStrikeTransportation Impactsand AnalysisNew York CityMichael R. Bloomberg, MayorNew York CityDepartment of TransportationIris Weinshall, Commissioner8February 2006
Introduction2Executive Summary3Preparing for the Transit Strike8 Summary of FindingsThe Evolution and Implementation of the Contingency Plan 48Improving Roadway PerformanceMonitoring Performance and OperationMonitoring Locations101111Traffic Management Strategies - Keeping New York City Moving12Controlling Vehicle Entries Into and Within Manhattan Lane ReversalsRestrictions on Vehicle Entries Into ManhattanHOV-4 RestrictionsTruck and Commercial Vehicle RestrictionsReserved, Emergency and Express StreetsUpper Manhattan Express Streets12121416171819Maximizing the Efficiency of the Arterial Roadways20202021212123Promoting Non-Vehicular and Alternative Transportation Modes24242527Functioning Mass Transit System292931 Traffic Signal ModificationPriority RoadwaysExpansion of No Standing RegulationsAdditional Regulatory ActionParking Management StrategiesBus Layover ProvisionsBicycle and Pedestrian CommutingWaterborne TransportationTaxi and For-Hire Vehicle ServicesCommuter RailBus ServiceAnalysis and FindingsTraffic Patterns in the Manhattan Central Business District (CBD) VehicleVehicleVehicleVehicleVehicleEntries into the Manhattan CBDExits from the Manhattan CBDAccumulation in the CBDOccupancyClassification34343538394144Manhattan Travel Times and Speeds454546Traffic Patterns in the Other Boroughs484850Pedestrian and Bicycle Trends525254Functioning Transit Services5757585960 AvenuesCrosstown StreetsVehicle Volumes on Limited Access HighwaysSpeeds on Other Borough RoadwaysPedestrian TravelBicycle TravelWaterborne TransportationPrivate Bus LinesCommuter Rail/PATH ServicesTaxicab UsageConclusions61Appendices62IIIIIIIVVVICCTV Camera LocationsMonitoring PlanPermanent VMS LocationsNo Standing Regulation LocationsPedestrian and Bicycle Access LocationsCommuter Rail
The 2005 Transit Strike : Transportation Impacts and Analysis2005 Transi1
The 2005 Transit Strike : Transportation Impacts and AnalysisAt midnight, December 15, 2005, the contract representing the 38,000subway and bus workers of the Transportation Workers Union (TWU) Local100 and the 1,500 workers of the Amalgamated Transit Union (ATU) Local728 expired. Combined, these workers operate the city’s 6,000 subway carsand 4,500 buses that comprise the New York City Transit system. On anaverage weekday, over 7,500,000 million riders depend on these buses andsubways for their transportation needs.Over the course of the next three days, unable to come to a contractualagreement, the threat of labor actions became increasingly real and at 12:01am on Monday, December 19, 2005, drivers from the Jamaica and TriboroBus Companies, private bus franchises that are not under the MTA control,walked off the job in a precursor to the larger transit strike. This action strandedapproximately 50,000 passengers in central and eastern Queens.Still unable to reach a contract settlement, at 3am, December 20, 2005,the TWU called a strike by its membership, bringing the mass transit systemto a halt and leaving New York City residents without their primary mode oftransportation for the next three days. Advance planning and transportationmanagement enabled the City to continue functioning during the strike.it Strike2
The 2005 Transit Strike : Transportation Impacts and AnalysisThe 2005 Transit Strike presented daunting challenges in maintaining mobility andaccess for City residents, businesses and visitors. The City has undergone considerablegrowth since the previous transit strike in 1980, as its population increased by over 15%(to 8.2 million from 7.1 million in 1980) and employment increased to 3.6 million from 3.3in 1980. These factors have contributed to increased dependence on the transit system(7.5 million people use the subway and bus system today compared to 6.2 million in1980). In addition, the 2005 strike occurred during the holiday season, when the Cityexperiences colder weather as well as an influx of visitors and shoppers.The increased demands on the remaining operating transportation systemsrequired a comprehensive and coordinated plan. The City’s Transit Strike Plan includedHigh Occupancy Vehicle (HOV) restrictions, bridge and tunnel lane reversals to increasecapacity in the peak direction, group riding and the introduction of zone fares in taxis,suspension of all non-emergency roadway construction, commercial vehicle entryrestrictions, the provision of additional ferry service, encouraging bicycling and walking,providing additional carpool staging areas, and the maintenance of emergency routes.The following describes how the plan succeeded in maintaining mobility within the City.3
The 2005 Transit Strike : Transportation Impacts and AnalysisCBD Traffic Patterns Private passenger vehicles were the primary mode of transportation during thetransit strike. The HOV-4 restrictions were successful in maximizing the person-carrying efficiencyof automobile travel into Manhattan. During the strike, the average occupancy ofmotor vehicles entering Manhattan south of 96th Street between 5-11am was 3.53passengers per vehicle (ppv), well over twice the usual occupancy of approximately1.5 ppv. These occupancy rates were major improvements compared to both the1966 strike (2.20 ppv) and the 1980 strike (3.19 ppv). Between 5-11am, 68% of all vehicles entering the restricted area were in compliancewith the occupancy requirement. The average number of vehicles entering the Central Business District (CBD)between 5-11am declined by 45%, to 151,211 from 275,292, while the numberof occupants in these vehicles increased by 27%, to 488,121 from 383,491. Thehighest volume occurred on Day Three, when 544,809 persons entered, 42%higher than a normal day. The number of persons entering the CBD generally increased on the third day ofthe strike for all modes, as travelers adjusted to “strike conditions.” On the firstday of the strike, many people may not have formalized travel plans as there wasuncertainty as to whether or not a strike would be called. More motorists started their commute much earlier than normal. Increases involume began as early as the 2-3am hour, with the greatest increase occurringbetween 4-5am when CBD entries more than tripled to 33,720 from 10,445 vehiclesper hour. Peak hour entries shifted dramatically from 8-9am on a normal day to 11am-noonduring the strike, the hour immediately following the lifting of the HOV-4 restrictions.Normally, the maximum hourly inbound flow occurs between 8-9am, but during thestrike, 8-9am entries decreased 44%, to 31,154 from 55,195. Between 11amnoon, CBD entries increased 15%, to 46,795 during the strike, from 40,642 undernormal conditions. In contrast, during the 1980 strike, the inbound peak hourshifted by only one hour (to 7-8am from 8-9am). During the six-hour period, 5-11am, with the HOV-4 restriction in effect, the numberof vehicles entering the CBD was reduced by nearly half, to 151,211 from 275,2924
The 2005 Transit Strike : Transportation Impacts and Analysis(-45%). This significant decrease in volume was not due to lack of demand, but tothe operation of checkpoints established for enforcement of the HOV regulations,which had the effect of metering the flow of vehicles into Manhattan. As a result of the above, the additional capacity provided by the morning bridge andtunnel lane reversals was less essential than during the 1980 strike. Comparingthe four-hour 6-10am time period, entries during the 2005 strike were dramaticallylower than during the 1980 strike. In 2005, entries totaled 110,445, 41% fewerthan the 187,000 entries during the same period of the 1980 strike. During the 7-10am period, the percentage of trucks and commercial vans enteringthe restricted zone via the four East River bridges was reduced from 19.4%under normal conditions to just 1.8% during the strike. The number of trucks andcommercial vans entering via these four bridges decreased by 94%, to 515 from9,275. The PM outbound peak period, normally 3-7pm, occurred much later (between7–11pm) during the strike. Under normal conditions, 199,275 vehicles exit theCBD between 3-7pm. During the strike, this volume decreased 24% (to 150,761)which was 9% fewer than the 165,568 exits between 7-11pm. A major element of the Strike Plan was to control vehicle entries into the CBD inorder to prevent the accumulation of vehicles (all vehicles in the zone, both in useand parked) from reaching critical levels. With the HOV-4 restriction, CBD vehicularaccumulation during the strike was reduced to about 8-12% below normal. Themaximum accumulation of 170,500 vehicles was reached at 2pm. This reduced vehicle accumulation compares very favorably with the levelsrecorded during the previous transit strikes in 1966 and 1980. During the 1966strike, accumulation reached nearly 260,000, the highest level ever recorded.During the 1980 strike, accumulation was held to about 219,000, but that was stillabout 25% greater than the normal level of 175,000 at that time. Similar to the 1980 strike, carpool staging areas were under utilized, except forthose facilities which provided a viable transportation connection into Manhattansuch as ferry service, commuter rail and functioning bus service.Other Modes of Transportation 5Walking was the predominant mode of non-motorized transportation during the2005 transit strike, as pedestrian volumes exceeded 1980 strike levels. Between6-10am, pedestrian entries were 14% higher than those recorded in 1980. Incontrast, bicycle volume decreased significantly (-44%) from 1980 strike levelsdespite the availability of additional bicycle facilities and the expansion of thebicycle network.
The 2005 Transit Strike : Transportation Impacts and Analysis The MTA reported significantly higher than average ridership on both the LongIsland Rail Road (LIRR) and Metro North Railroad (MNR) during the strike. Fortrains arriving between 6am and noon, the Penn Station inbound passenger volumeon the LIRR averaged 146,000 during the strike, 60% above the average dailyridership of 91,000. For Metro-North trains stopping at Bronx stations between5am and 11am ridership increased by over 40% - an additional 30,000 passengersa day to 103,570 from 73,370. These ridership increases exceeded the 21%increases during the 1980 strike. Daily PATH ridership increased 40% (to 286,000 from 205,000 on a normal businessday). In 1980, there was a 33% increase in daily ridership. Ridership on the Green Bus Lines express routes increased by approximately150%, and ridership on the Q 60 local bus (which connects Queens and Manhattan)increased by 45%. Ridership on the other local bus routes declined by nearly50%. Private ferries played a relatively minor role during the strike. Daily inbound privateferry ridership increased by a modest 9,000 (or about 50%), to approximately26,000 from 17,000 on a normal day. By comparison, pedestrian entries on thefour East River Bridges alone were more than 34,000, which is 31% more than theprivate ferries. Ridership on the Staten Island Ferry decreased slightly during the 6-10am peakperiod. In contrast, during the 1980 strike, peak period ridership increased bynearly 75%. In general, the Taxi and Limousine Commission (TLC) reported that the licenseeand passenger response to the zone fare system was a success with widespreadreports from both the media and field staff, that taxis, for-hire vehicles (FHVs)and commuter vans were operating across the entire City and filling up with themaximum number of passengers.Travel Time/Speed Travel speeds within the CBD were better on the reserved arterials than on otherstreets and avenues. Between 5-11am, southbound average speed on three nonrestricted roadways (Second Avenue, Park Avenue, Broadway/7th Avenue) was 6.6mph. On the reserved arterial, Fifth Avenue, speed was 11.9 mph, which is 80%faster than on the non-restricted avenues.6
The 2005 Transit Strike : Transportation Impacts and Analysis Average speed on crosstown reserved arterials (49th/50th Streets) was 4.6 mph,only 10% better than that recorded on the non-restricted streets. In general, traffic flowed well on the priority roadways approaching the CBD whilethe non-priority roadways experienced congestion.7
The 2005 Transit Strike : Transportation Impacts and AnalysisThe Evolution and Implementation of the Contingency PlanOn an average weekday, the New York City Transit System (subway and bus)moves 7.5 million passengers, including over 600,000 students who depend on masstransit. The labor actions taken by the TWU effectively shut down three critical componentsof the overall regional transit system. These included the NYC Subway system with anaverage daily ridership of 4,926,000, the NYC Transit Bus system, with a daily ridershipof 2,553,000 and most of the lines that comprise the MTA Bus Company, which is madeup of the former NYCDOT franchised bus operations.Mass transit systems that would remain operational during the strike includedthe MTA’s LIRR, MNR, the Staten Island Railway, Long Island Bus, Green Bus Lines,the Command Bus Company, and the rest of the regional transit system. However, bycontrast, the combined average weekday ridership of these systems is about 1.7 millionpassengers. A profile of the overall system is illustrated below:OperatorNYC Transit - SubwayStaten Island RailwayLong Island RailroadMetro-North RailroadPATHAir TrainNJ Transit - RailNYC Transit - BusMTA Bus / DOT Franchise BusesLong Island BusNJ Transit - BusWestchester Co. Bee-LineTotal Lines or Total Trains or Total Track or Average WeekdayRoutesBusesRoute Miles 50105,0002402,982164,00057368100,000Total Ridership9,171,000In order to accommodate all of these mass transit users on the remainingmodes of transportation, the City of New York developed a Transit Strike ContingencyPlan in the weeks preceding the strike. In order to anticipate what might occur in theevent of a transit stoppage, the impacts of the last transit strike in 1980 were examined.Prior to 1980, the City also experienced a transit strike in January 1966.During the 1980 strike, the City’s philosophy in preparing for a possible strikefocused on moving people rather than vehicles. This was in stark contrast to the1966 strike, when the City struggled with extreme congestion largely due to the fact thatno restrictions were placed on the movement of motor vehicles within the City. During8
The 2005 Transit Strike : Transportation Impacts and Analysisthe 1980 strike, entry restrictions were implemented to encourage carpooling, dedicatedprovisions were made for bicyclists and pedestrians, lane reversals on bridges and tunnelswere established to provide extra capacity during peak hours, and certain arterials werereserved to assure that emergency services would be maintained.In preparing for the 2005 strike, the City of New York built upon the experiences ofthe last two transit strikes, and developed a contingency plan that sought to reduce thetransportation effects of a disruption by: Ensuring continuity of essential government services, such as public safety;Implementing traffic management measures to promote carpooling;Implementing restrictions on vehicles to reduce congestion on key roadways andin the central business district;Maximizing the use of operating mass transit systems;Promoting bicycling and walking;Promoting staggered work hours, telecommuting, and alternate work sites; andSharing information with commuters and the private sector.In addition, three primary planning considerations were taken into account in planningfor a shutdown of the NYC Transit subway and bus service. The first was the expecteddramatic increase in the number of private vehicles entering New York City, making theManhattan Central Business District (CBD) most at-risk for congestion. Second, mostcommuters would attempt to come to work and seek alternative modes of transportation.Finally, winter weather could further disrupt transportation modes and discouragepedestrian/bicycle commuting.Overall, the City’s emergency response to the Transit Strike was coordinated throughthe Emergency Operations Center (EOC) at the Office of Emergency Management (OEM),where a unified command center was implemented to manage citywide operations. Cityagencies at the EOC: Implemented the Transit Strike Contingency Plan;Monitored transit and roadway conditions;Developed and implemented supplemental plans as needed;Provided situational updates to City officials;Staffed the Joint Information Center (JIC), providing timely, coordinatedinformation to the public, andCoordinated with State officials and with the adjoining jurisdictions in the NewYork City region.In addition, many City agencies activated their own departmental operation centers tofacilitate the implementation of their response activities.9
The 2005 Transit Strike : Transportation Impacts and AnalysisImproving Roadway PerformanceOne of the most critical operational strategies implemented during the Transit Strikewas improving roadway performance. Although the Contingency Plan sought to reducedemand on roadways by working with the private sector and government agencies topromote the use of alternative modes, carpools and altered work schedules, the influxof private vehicles was expected to result in a significant increase in congestion on theregion’s roadways.Therefore, the thrust of the traffic management effort was to maximize the efficiencyof the bridges and tunnels serving Manhattan and in turn, prevent the over-saturation ofManhattan’s street system. As such, the City worked with regional law enforcement andtransportation agencies to reduce congestion during peak commuting hours by: Placing high occupancy vehicle (HOV) requirements on major limited accesshighways and Manhattan bridge and tunnel crossings south of 96th Street whichprovide access to the CBD, as well as on vehicles entering the CBD at 96th Street(or at West 110th Street via Central Park Drive West). HOV-4 (four occupants ormore) was required from 5am to 11am, weekdays;Prohibiting commercial vehicles from entering Manhattan south of 96th Streetbetween the hours of 5am and 11am, weekdays;Reserving selected arterials for emergency and priority vehicles;Implementing lane reversals at selected river crossings to accommodate increasedvolume during the morning and afternoon commute;Prohibiting non-emergency construction citywide;Suspending street cleaning rules citywide;Extending “ No Standing” rules on critical routes in all five boroughs;Opening and promoting the use of Park-and-Ride and Carpool Staging Areas andadvertising such areas throughout the region.In addition, the City worked with the functioning commuter rail, bus, ferry serviceand other transportation providers to enhance their service to better meet increaseddemand. Implemented measures included: Extending peak service hours to support staggered work schedules and increasedridership;Enhancing commuter rail service (e.g. MNR, LIRR) at stations near Park and Ridefacilities, such as Yankee and Shea Stadiums;Amending taxi and for-hire vehicle regulations to increase taxi and livery capacity;andUsing ITS elements coordinated via the City’s Traffic Management Center (TMC)to improve traffic flow.10
The 2005 Transit Strike : Transportation Impacts and AnalysisMonitoring Performance and OperationThe final measure listed above, the use of the City’s TMC, would also prove to be one ofthe most important components of the 2005 Strike Management Program. The TMC, whichis operated jointly by NYCDOT, New York State Department of Transportation (NYSDOT)and NYPD, monitored real-time traffic conditions on most of the region’s streets, highways,bridges and tunnels. Technological advances and the advent of computer technology offereda high level of reconnaissance and a greater ability to monitor and adapt to changing trafficconditions.Traffic engineers at the TMC were able to monitor the regional traffic conditions via thetraffic surveillance cameras that the agency currently operates. These cameras provide realtime images of numerous critical intersections within Manhattan, as well the ability to monitortraffic conditions on numerous roadways throughout the region. On major roadways that arenot instrumented by traffic monitoring equipment, TMC personnel relied upon observationsby field personnel (both NYPD and NYCDOT), arterial surveillance teams and traffic mediareports. A complete listing of the locations of the surveillance cameras is included in AppendixI.In addition, a comprehensive data collection plan was implemented to provide criticaldata to assess the operation of the regions roadways. This program focused on providing thefollowing key elements: Vehicle entries and exits into and out of ManhattanVehicle volumes on key arterials and limited access highwaysVehicle occupancy and classificationBicycle/pedestrian usageVehicle SpeedsOverall, all this information was used to gauge the effectiveness of the City’s Transit StrikeContingency Plan and to develop daily strategies to mitigate congestion caused by excessivevolumes or unanticipated events.Monitoring LocationsThe Department collected occupancy and classification counts at screenlines establishedat both 60th and 96th Street, as well as at all river crossings south of 60th Street. In addition,traffic volumes and manual counts, travel time/speed surveys and pedestrian/bicycle countswere collected at critical locations. Finally, the usage of carpool staging areas was monitored.The overall Monitoring Plan can be found in Appendix II.11
The 2005 Transit Strike : Transportation Impacts and AnalysisKeeping New York City MovingAs outlined earlier, the City developed a comprehensive Traffic ManagementProgram that reflected the existing transportation infrastructure, as well as the anticipatedneeds and demands in the event of the shutdown of the New York City Transit System. Thefollowing section details each component of the program and its effectiveness. Detailedinformation and traffic impacts are provided in the Data & Analysis Section.Controlling Vehicle Entries Into and Within ManhattanDuring the 1980 strike, the concept of controlling vehicle access into and withinManhattan proved to be an effective tool in maintaining the operation of the street networkduring all hours of the day. Given the fact that Manhattan is an island, the network ofbridges, tunnels, and limited access arterials serve as the primary conduits for vehiclesto enter and exit the city. In addition, with the elimination of the subway and bus network,the private passenger vehicle represented the most viable form of travel for those not ableto walk or bicycle into Manhattan.The City adapted these techniques during the 2005 Transit Strike to allow for theefficient management of vehicles into and out of Manhattan, and to prevent the oversaturation of the roadway network. These techniques, detailed below, were aimed atmaximizing the people carrying, rather than vehicle carrying capacity of the roadwaynetwork.Lane ReversalsTo mitigate the anticipated increase of traffic into Manhattan, several lanes on thebridges and tunnels south of 96th Street were reversed to provide for additional peak hourcapacity. Under regular operating conditions, several of these crossings implement peakdirection lane reversals during the traditional peak period to accommodate for increaseddemand. During the 2005 strike, these lane reversals were expanded to provide forincreased capacity through the provision of additional lanes during the expanded peaktravel periods. Under the original 2005 plan, these morning roadway reversals were tobegin no later then 5am and remain in effect until 11am, while the evening reversals weregenerally to begin at 2pm and remain in effect until 8pm.The following represents the Lane Reversal schedule for each of the East Riverand Lower Hudson River crossings during the strike:12
The 2005 Transit Strike : Transportation Impacts and AnalysisManhattan Bridge (NYCDOT)TimeInbound LanesOutbound LanesNormal OperationStrike OperationNormal OperationStrike Operation4 Lanes5 Lanes2 Lanes2 Lanes2 Lanes2 Lanes4 Lanes5 Lanes5:00 AM to 11:00 AM2:00 PM to 8:00 PMWilliamsburg Bridge (NYCDOT)Time5:00 AM to 11:00 AMInbound LanesNormal OperationStrike Operation2:00 PM to 8:00 PMOutbound LanesNormal OperationStrike Operation4 Lanes6 Lanes2 Lanes2 Lanes4 Lanes2 Lanes4 Lanes6 LanesQueensboro Bridge (NYCDOT)Time5:00 AM to 11:00 AMInbound LanesNormal OperationStrike Operation2:00 PM to 8:00 PMOutbound LanesNormal OperationStrike Operation6 Lanes6 Lanes3 Lanes2 Lanes4 Lanes2 Lanes5 Lanes6 LanesNote: One outbound lane was used exclusively by pedestriansQueens - Midtown Tunnel (MTA B&T)Time5:00 AM to 11:00 AMInbound LanesNormal OperationStrike Operation2:00 PM to 8:00 PMOutbound LanesNormal OperationStrike Operation3 Lanes3 Lanes1 Lane1 Lane2 Lanes1 Lane2 Lanes3 LanesBrooklyn Battery Tunnel (MTA B&T)Time5:00 AM to 11:00 AMInbound LanesNormal OperationStrike Operation2:00 PM to 8:00 PMOutbound LanesNormal OperationStrike Operation3 Lanes3 Lanes1 Lane1 Lane2 Lanes1 Lane2 Lanes3 LanesHolland Tunnel (PA NY&NJ)Time5:00 AM to 11:00 AMInbound LanesNormal OperationStrike Operation2:00 PM to 8:00 PMOutbound LanesNormal OperationStrike Operation2 Lanes2 Lanes2 Lanes2 Lanes2 Lanes2 Lanes2 Lanes2 LanesLincoln Tunnel (PA NY&NJ)Time5:00 AM to 11:00 AM2:00 PM to 8:00 PM13Inbound LanesNormal OperationStrike OperationOutbound LanesNormal OperationStrike Operation4 Lanes4 Lanes2 Lanes2 Lanes2 Lanes2 Lanes4 Lanes4 Lanes
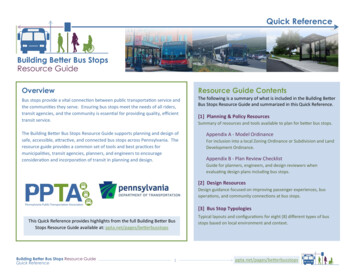
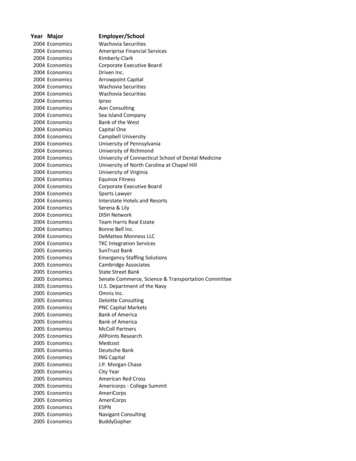
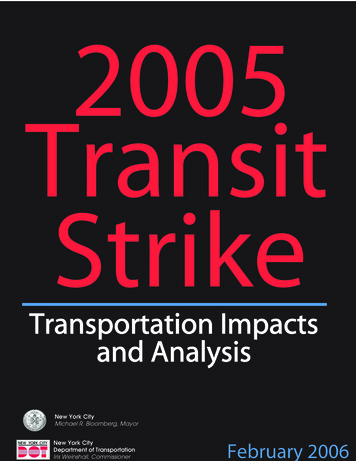
The 2005 Transit Strike : Transportation Impacts and AnalysisHowever, during the course of the strike, especially during the six-hour morningperiod (5 -11am), when there were HOV-4 restrictions on these roadways, the numberof vehicles utilizing the bridge and tunnel crossings were significantly reduced. Thiswas not due to the lack of demand, but the operation of checkpoints established forenforcement of the HOV-4 regulations. This had the effect of metering the flow of vehiclesinto Manhattan.As a result, the additional capacity provided by the morning bridge and tunnel lanereversals was less essential than during the 1980 strike, when more vehicles were enteringManhattan due to the less restrictive (HOV-2) regulations.As such, the actual timing of the lane reversals and reversion back to normal operationvaried on each crossing based upon the volume and flow of traffic each morning andafternoon. While the morning reversals remained fairly constant, during the eveningperiod, each of the East River Bridges implemented varying reversal schedules, eitherbeing implemented later in the afternoon, extending past 8pm, or ending the reversalearly based upon traffic conditions.Restrictions on Vehicle Entries into ManhattanDuring the 1980 strike, the Department imposed an HOV-2 requirement on allprivate passenger vehicles entering Manhattan south of 96th Street between the hours of6am and 10am. This restriction encompassed all southbound avenues and the East andHudson River Crossings south of 96th Street. In addition, there was an HOV-3 requirementon selected limited access or “priority” roadways approaching Manhattan.The 2005 Plan broadened the program to optimize the efficiency of motor vehiclesentering Manhattan. During the AM peak period (5 – 11am), all vehicles entering Manhattanwere required to have four or more passengers (HOV-4).This restriction included several highways approaching or leading into theManhattan Central Business District, all southbound avenues intersecting 96 th Street,the northern entrances to the Central Park West Drive, and all bridge and tunnelcrossings south of 60 th Street. The prohibition excluded authorized emergencyvehicles, buses, para transit, full commuter vans and motorcycles. An extensivesignage plan was implemented to enforce the new HOV-4 regulation. This includedthe use of static and Variable Message Signs (VMS) on the City’s roadways. Alisting of the permanent VMS locations can be found in Appendix III.These restrictions covered the following river crossings, limited access roadwaysand local streets in Manhattan and the surrounding boroughs:14
The 2005 Transit Strike : Transportation Impacts and AnalysisHOV-4 Restrictions (4 or more occupants)B ronxRiv erPkwyBroadway- Monday - Friday, 5am - 11am- All vehicles using HOV roads/crossings or entering the areaof Manhattan south of 96th Street must have four or morepassengers except exempt vehicles.- Exempt vehicles include emergency vehicles,buses, paratransit, commuter vans and motorcycles.MakwyRds onHilltch indCE Fo rdhaHuGrjounang aneerDFor Exempt Vehicles OnlyonE xwouyrsewyl u Pk- Monday - Friday, 5am - 8pmcRi v erPEGsh oHenry Hudson Br.MoB roa dwayHOV Road/CrossingHOV Road with Reserved Lane96th Street BoundaryReserved StreetsmRPelham PkwydEmergency Streetsn ExwyAvridadgBroughorAtlan tic AvwyPkChu rchStlt PwyWBeKin gs HwyAvRectorStStsPlndTrinty.VeseyStLnySo u t h er nenaidBaStMGo wanus Exw ywanusExpyenBlv dAv/StGokwNassaup.ExusGowanaylv dwy4th AvnBck awayd uitdtanrt lCorkwdePkPaAvvdBay BlCrossLinyBeltC onwad AvyNostr anltP kwtlaackStRothFlaOcea n Av65n ticvWarra AvywyOcea n PkvdAtlaaADowntownJaReserved/Emergency StreetsRoicmaylvaniUtica Avp.BlyP ennsEastern PkwyExnBeayltHkwon PbiRoayk ier.dwJacBAveEx5thS heBlvdssglaour ickDdeFreT ribnsBroack e st StckLIEtb uAviltNenTunHillrgBBroaFlailtySdanberBa15dVM a no r R dNYCeMa nor RdVicto ry BlvdRamsro gokmsbupeAvFo r e s tClovHFtBr do roQuee ns BlvdBr.wyF lu shin g A vosPrmo nd T e rkwvdWilliaBr.R ic hlPBlanat tBroBklyn - Battery Tun.r
Advance planning and transportation management enabled the City to continue functioning during the strike. 2005 Transit Strike . 3 The 2005 Transit Strike : Transportation Impacts and Analysis . (7.5 million people use the subway and bus system today compared to 6.2 million in 1980). In addition, the 2005 strike occurred during the holiday .