Transcription
Utah’s Opioid CrisisConsequence and Resource AssessmentJuly 2017Prepared by: Bach Harrison, LLC, andthe Utah Department of Human Services,Division of Substance Abuse and Mental Health
The Division of Substance Abuse and Mental Health (DSAMH) with assistance from Bach Harrisonprepared this report for the Utah Opioid State Targeted Response (STR) to Grant Project (UT OpioidSTR). This report compiles the available opioid misuse and abuse data at the state, county, and smallarea levels as well as existing resources available in each area. The UT Opioid STR proposes to addressthe opioid (prescription opioids as well as illicit drugs such as heroin) crisis through the provision ofevidence‐based prevention, treatment and recovery services for unfunded, underserved youth (age 12‐17), and adults (18 ) at risk of developing or with an opioid use disorder.The primary goals of the grant are to: prevent/reduce opioid misuse, reduce overdose deaths, expandaccess to evidence‐based treatment, increase partnerships with physical health and promote recovery.The grant application requires States to conduct a needs assessment prior to implementation. Theprimary variables identified by SAMHSA as the basis of the needs assessment were opioid consumptionand consequences. For consumption (substance use rates), there are data available through theNational Survey on Drug Use and Health (NSDUH) for the State of Utah regarding past year prescriptionpain reliever use. NSDUH also collects data on heroin use, but does not publish this data at the statelevel (only at the national level). Within the state, there is also excellent data available regarding theconsequences of opioid misuse and abuse. Specifically, mortality data (deaths due to opioid use), andmorbidity (injury) data in the form Emergency Department encounters.Following the consumption and consequence data, an overview of existing resources potentiallyavailable to address opioid misuse/abuse are presented at regional, county and small area levels.Highlighted in the resource assessment section are data regarding the number of licensed substanceabuse treatment providers, licensed and certified opioid treatment programs (OTP’s), and physiciansauthorized to prescribe buprenorphine. Additionally, the number of naloxone training locations,recovery homes, and community substance abuse prevention coalitions is provided. This resourceassessment is intended to allow both state and local partners to easily see what gaps exist compared tothe needs of the communities.Past Year Non‐medical Use of Prescription Pain Relievers in UtahTable 1 presents the rates of past year non‐medical (“not prescribed to you” or “taken only for theexperience or feeling they caused”) prescription pain reliever use collected through the NSDUH Survey.As seen in Table 1, rates of non‐medical use of pain relievers were highest in the 18‐25 age group inevery year. The highest observed rates for all age groups were in 2006, with a second peak occurring in2009. The lowest use rates for all age groups were observed in 2014. This item was discontinued in the2015 survey, and a new item replaced it. Unfortunately, comparisons are not possible between the newitem and the original item.Table 1. Past Year Non‐medical Use of Prescription Pain Relievers by Age, Utah (2006‐2014)20062007200820092010201120122013Ages 12‐177.86.76.916.836.575.624.364.28Ages 18‐2512.510.710.26 12.01 10.318.238.847.8Ages 26 4.23.63.53.413.313.183.353.2320144.187.023.14
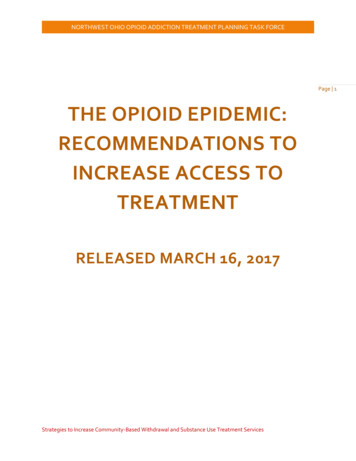
Opioid Mortality and Morbidity: Data Definitions and OverviewThe Utah Department of Health (UDOH) has a robust database that houses both mortality data andemergency department encounters (ED) data from which the data presented in this report werequeried. Queries of each indicator combined (aggregated) the two most recent years of data (2014‐15for mortality and 2013‐14 for ED encounters, respectively). The database allows queries based onInternational Classification of Disease (ICD) codes (version 10 for mortality/version 9 for ED data). Thefederal Center for Disease Control and Prevention (CDC) issued a guide1 for defining opioid relatedincidents using ICD codes, and adopted the definitions within that guide for the data prioritizationprocess used in this grant. Specifically, the ICD code suggestions for “All Opioid Poisonings (Illicit andPrescription)” were used as follows:Mortality: ICD 10 ‐ X40, X41, X42, X43, X44, X60, X61, X62, X63, X64, X85, Y10, Y11, Y12, Y13, Y14Emergency Department: ICD 9 ‐ 965.00, 965.01, 965.02, 965.09Opioid Mortality and Emergency Department Encounters Data: State DataUtah has experienced a sharp increase in opioid related deaths since 2000. Recent data suggests thatthe number of deaths due to opioids peaked initially in 2007, then showed a promising decreasing trendthrough 2010, before increasing dramatically once more from 2011 through 2015. Emergencydepartment encounters data over the same timeframe shows a steady increase in ED encountersthrough 2012, with a small decrease observed from 2012 to 2014. Figure 1 presents the number andrate (age‐adjusted) of opioid related deaths and emergency department encounters in Utah from 2005to 2015.An examination of opioid deaths and ED encounters by age and gender provides interesting insightsregarding who is most affected by each of these negative outcomes. Table 2 presents the number and1https://www.cdc.gov/drugoverdose/pdf/pdo guide to icd‐9‐cm and icd‐10 codes‐a.pdf
rate of opioid deaths and ED encounters statewide for males and females, as well as by age, for themost recent year of data available for each indicator. In regards to opioid deaths, males accounted forapproximately 60% of deaths in 2013, but the gap between males and females has shrunk so that by2015 males accounted for only 54% of deaths. For ED encounters, the opposite has been true. In thepast, females have traditionally accounted for more visits than males. However, similar to the deathdata, the gap between females and males has been closing. In 2014, the percentage of ED encountersfor males and females was essentially even (50.3% vs. 49.7% for females and males, respectively). Inregards to age, the age distribution for opioid deaths was higher than for ED encounters. The age groupthat consistently had the highest rate of opioid deaths was the 45‐54 age group, while the highest ratefor ED encounters was the 25‐34 age group.Table 2. Opioid Deaths and ED Encounters by Gender and Age, Most Recent Available YearOpioid DeathsGenderMalesFemalesAge Group15‐2425‐3434‐4445‐5455‐6465‐74All other ages2015Rate per100,000ED Encounters2014Rate 22110811862.598.880.080.979.962.6n/a
Opioid Mortality and Emergency Department Encounters Data by LSAATable 4 presents the number of opioid related deaths and ED encounters for each LSAA region acrossthe state, as well as the rate of each per 100,000 population. The rates allow an “apples to apples”comparison across LSAA regions as well as a comparison to the state. The numbers provide a measureof how many cases occurred in each region, but are heavily reflective of the population size of eachLSAA (i.e., large LSAAs such as Salt Lake County account for the bulk of the cases statewide).Table 4. Opioid Related Mortality and Emergency Department Encounters by LSAAED EncountersOpioid Deaths2014‐2015NumberDistrictBear RiverCentralDavisFour CornersNortheasternSalt Lake CountySan JuanSouthwestSummitTooeleUtah CountyWasatchWeberState43201082627531 580123917971371213Rate 892471,443 52281698623124143458Rate 62.122.286.162.1
Opioid Mortality and Emergency Department Encounters Data by CountyTable 5 presents the number and rate of opioid deaths and ED encounters for each county in the state.The table makes comparing the counties based on the rate of each indicator simple (each indicator isordered separately). Counties are ordered from those with the highest rate to those with the lowestrate for each indicator. The state total is shaded to allow easy identification of which counties havehigher and lower rates than the state (areas above the state rate in the table have higher rates than thestate, etc.). As mentioned earlier, rates allow “apples to apples” comparisons across counties, whilenumbers allow you to examine exactly how many cases occurred in each county. In addition toprioritizing based on high rates of consequences, it is also important to consider the number of cases.For example, whereas areas with high rates and high numbers of cases are obvious priorities, those withhigh rates but only a few cases should be prioritized to a lesser degree.Table 5. Opioid Deaths and ED Encounters by County from Highest Rates to LowestOpioid abSalt LakeKaneStateSanpeteBox ElderWashingtonIronUtahUintahDavisSan .7611.689.58******00ED EncountersCountyCarbonEmeryWeberTooeleSalt LakeUtahStateWashingtonBox rfieldRichSan JuanWaynePiute*Indicates at least one case, but insufficient numbers to publish for public 40.639.535.134.234.132.522.219.617.2******0
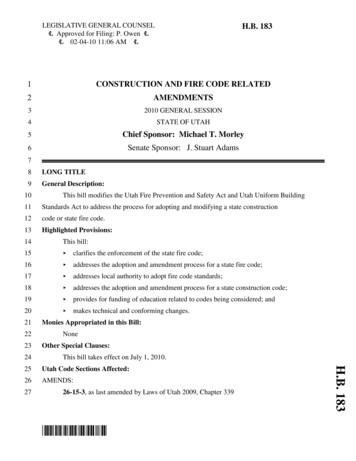
Opioid Mortality and Morbidity Index Score Comparisons by CountyIn identifying state level priorities, the State Epidemiological Outcomes Workgroup (SEOW) created anindex score that combined the opioid death and ED Encounters data into a single index variable. Theindex score was calculated using both the rate and number for each of the indicators, thereforeconsisting of four sub‐variables (i.e., mortality number, mortality rate, ED number, and ED rate).Because there are many more ED visits than deaths, and because rate and number are different metrics,it was vital to standardize the data before computing the index score so that comparisons between theindicators and between rates and numbers were on the same metric. This was achieved by standardizingthe data using Z‐scores. Essentially, a z‐score shows where each county falls on the indicator relative tothe average value for all the counties in Utah. In calculating the index scores, rates were given higherweight than numbers, and mortality was given higher weight than ED Encounters. Rates were weightedheavier in the calculation of the index because a) higher rates suggest that a county has a problemaround this issue, and b) areas with higher rates may be more likely to respond to intervention.Mortality was weighted higher than ED Encounters because reducing the number of opioid relateddeaths is one of the specific primary goals of the grant. The final weighting for each element was asfollows: opioid mortality rate‐45%, opioid mortality number‐15%, opioid ED rate‐30%, and opioid EDnumber‐10%.Table 6 presents the 21 counties in Utah which had publishable data for both indicators in order fromhighest to lowest based on the Opioid Mortality and Morbidity Index Score. Areas shaded in redrepresent the top third of counties, yellow represents the middle third, and green represents the lowestthird. The following counties had too few cases to allow publication of one or both of the opioidmortality/morbidity indicators and were excluded from the index score calculation: Beaver, Daggett,Garfield, Grand, Millard, Rich, San Juan, and Wayne.Table 6. Counties Ranked Highest to Lowest Based on Opioid Mortality and Morbidity IndexCountyCarbonSalt x erWasatchPiuteIndex 6334995-0.6958145-0.8067115-0.8141125-1.487913
Opioid Mortality and Emergency Department Encounters Data by Small AreaTo allow the identification of sub‐county “hotspot” priorities for opioid consequences (particularly in thelarger Wasatch Front counties), data was compiled using the Utah Department of Health’s “small area”boundaries. The state is divided into 64 “small areas” based generally on population size, but alsocity/town boundaries, and other factors are taken into consideration2.Table 7 presents the number and rate of opioid deaths and ED encounters for each small area in thestate. The table makes comparing the small areas based on the rate of each indicator simple (eachindicator is ordered separately). Small areas are ordered from those with the highest rate to those withthe lowest rate for each indicator. The state total is shaded to allow easy identification of which smallareas have higher and lower rates than the state (areas above the state rate in the table have higherrates than the state, etc.). As mentioned earlier, rates allow “apples to apples” comparisons across smallareas, while numbers allow you to examine exactly how many cases occurred in each area. In addition toprioritizing hotspots based on high rates of consequences, it is also important to consider the number ofcases. For example, whereas areas with high rates and high numbers of cases are obvious priorities,those with high rates but only a few cases should be prioritized to a lesser degree.Table 7. Opioid Deaths and ED Encounters by Small Area from Highest Rates to LowestOpioid DeathsRateper100,00012 07 Ogden (Downtown)04 21 SLC (Glendale)05 56 Carbon/EmeryCounties04 25 South Salt Lake04 30 Taylorsville(East)/Murray (West)[renamed from Taylorsville]04 33.2 West Jordan (NE) V204 17 SLC (Rose Park)04 20 Magna04 24 SLC (Downtown)412655.3345.85Small Area05 56 Carbon/EmeryCounties04 31 36.7104 32 Midvale04 31 Murray12 10 Riverdale08 40 Tooele Co01 01 Brigham City04 23.1 West Valley (East) V210 50 Utah Co (South)09 53 TriCounty LHD12 05 Ben 7.6927.6826.8426.41Small Area2ED r100,0008391144.1138.304 25 South Salt Lake12 10 Riverdale6663129.8127.504 18 SLC (Avenues)04 32 Midvale12 07 Ogden (Downtown)04 27 Holladay12 08 South Ogden04 30 Taylorsville(East)/Murray (West)[renamed from Taylorsville]04 21 SLC (Glendale)12 05 Ben Lomond04 33.2 West Jordan (NE) V210 50 Utah Co (South)04 23.1 West Valley (East) V208 40 Tooele Co04 36 Sandy (Center)10 43 Pleasant or more specific information about small areas, please hSmallAreaInfo.pdf
Opioid DeathsED 922.1706 60 Cedar City04 28 Cottonwood04 22 West Valley (West)06 61 Southwest LHD (Other)1418321021.2120.4520.0119.4610 44 Orem (North)02 54 Juab/Millard/SanpeteCounties06 59 Washington Co (Other)04 19 SLC (Foothill/U of U)10 46 Orem (East)12 09 Roy/Hooper03 15 Woods Cross/NorthSalt Lake03 12 Layton03 14 Farmington/Centerville10 45 Orem (West)01 02 Box Elder County(Other)04 39 Riverton/Draper04 35 South Jordan07 51 Summit County10 41 Lehi/Cedar Valley04 34.2 West Jordan(West)/Copperton1319.2906 59 Washington Co (Other)10 42 American Fork/Alpine03 11 Clearfield/Hill AFB01 02 Box Elder County(Other)04 37 Sandy (NE)04 38 Sandy (SE)04 24 SLC (Downtown)12 06 Morgan Co (All)/WeberCo (East)1623971518.9118.718.5417.5917.561124128Small Area10 49 Springville/SpanishFork03 16 Bountiful04 18 SLC (Avenues)10 42 American Fork/Alpine04 38 Sandy (SE)04 27 Holladay04 36 Sandy (Center)06 58 St George04 29.1 Kearns V204 37 Sandy (NE)12 08 South Ogden10 48 Provo (South)State12 06 Morgan Co (All)/WeberCo (East)04 26 Millcreek03 11 Clearfield/Hill 57.6495704 30.1 Taylorsville (West)04 17 SLC (Rose Park)03 12 Layton01 03 Logan04 26 5.6715.2410 41 Lehi/Cedar Valley04 28 Cottonwood04 39 Riverton/Draper10 46 Orem 8714.814.26484733304242.441.940.339.637.11314.0504 35 South Jordan09 53 TriCounty LHD06 60 Cedar City10 47 Provo (North)/BYU03 13 Syracuse/Kaysville03 15 Woods Cross/NorthSalt Lake2335.3Small Area10 49 Springville/SpanishFork04 29.1 Kearns V204 22 West Valley (West)10 48 Provo (South)03 16 Bountiful10 44 Orem (North)12 09 Roy/Hooper04 20 Magna10 45 Orem (West)State06 58 St George01 01 Brigham City04 34.1 West Jordan (SE)
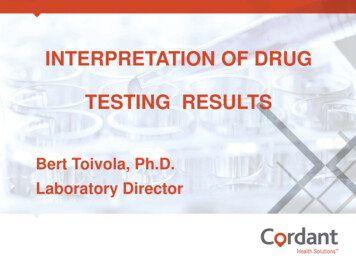
Opioid Deaths2014‐2015NumberRateper100,0001013.8601 03 Logan1613.8310 43 Pleasant Grove/Lindon04 34.1 West Jordan (SE)[2009 and after]1213.611013.437712.2612.2510.52119.874Small Area04 30.1 Taylorsville (West)[2012 and after]11 52 Wasatch County10 47 Provo (North)/BYU05 57 Grand/San JuanCounties03 13 Syracuse/Kaysville01 04 Cache Co (Oth)/Rich Co(All)02 55 Sevier/Piute/WayneCountiesED 3.32932.72632.1281430.230.104 19 SLC (Foothill/U of U)05 57 Grand/San JuanCounties11261022.88.6211 52 Wasatch County1222.47.8807 51 Summit County1619.3Small Area03 14 Farmington/Centerville02 55 Sevier/Piute/WayneCounties04 34.2 West Jordan(West)/Copperton01 04 Cache Co (Oth)/Rich Co(All)02 54 Juab/Millard/SanpeteCounties06 61 Southwest LHD (Other)Opioid Mortality and Morbidity Index Score Comparisons by Small AreaUsing the same index calculation method described earlier for counties, the SEOW calculated opioidmortality and morbidity index scores at the small area level to facilitate prioritization of hotspotsthroughout the state. Table 8 presents all 64 small areas in order from highest to lowest based on theOpioid Mortality and Morbidity Index Score of each area. Areas shaded in red represent the top third ofsmall areas, yellow represents the middle third, and green represents the lowest third.Table 8. Small Areas Ranked Highest to Lowest Based on Opioid Mortality and Morbidity IndexSmall Area12 07 Ogden (Downtown)05 56 Carbon/Emery Counties04 25 South Salt Lake04 31 Murray04 21 SLC (Glendale)12 10 Riverdale08 40 Tooele Co04 30 Taylorsville (East)/Murray (West)04 32 Midvale04 33.2 West Jordan (NE) V204 24 SLC (Downtown)10 49 Springville/Spanish Fork12 05 Ben Lomond04 27 Holladay04 23.1 West Valley (East) V204 20 Magna04 36 Sandy (Center)Index 14
Small Area04 17 SLC (Rose Park)10 50 Utah Co (South)06 58 St George04 18 SLC (Avenues)04 22 West Valley (West)12 08 South Ogden03 16 Bountiful10 42 American Fork/Alpine10 48 Provo (South)04 29.1 Kearns V2 [2012 and after]03 11 Clearfield/Hill AFB01 01 Brigham City09 53 TriCounty LHD04 26 Millcreek06 59 Washington Co (Other)04 38 Sandy (SE)12 06 Morgan Co (All)/Weber Co (East)04 39 Riverton/Draper10 44 Orem (North)04 37 Sandy (NE)10 43 Pleasant Grove/Lindon12 09 Roy/Hooper03 12 Layton10 41 Lehi/Cedar Valley04 28 Cottonwood06 60 Cedar City10 45 Orem (West)01 03 Logan04 34.1 West Jordan (SE)04 35 South Jordan02 54 Juab/Millard/Sanpete Counties01 02 Box Elder County (Other)04 30.1 Taylorsville (West)10 46 Orem (East)06 61 Southwest LHD (Other)03 15 Woods Cross/North Salt Lake03 14 Farmington/Centerville04 19 SLC (Foothill/U of U)04 34.2 West Jordan (West)/Copperton10 47 Provo (North)/BYU03 13 Syracuse/Kaysville07 51 Summit County11 52 Wasatch County01 04 Cache Co (Oth)/Rich Co (All)05 57 Grand/San Juan Counties02 55 Sevier/Piute/Wayne CountiesIndex ‐1.2906805‐1.3029025‐1.403652‐1.411763
Treatment dataThe following table shows demographics of opioid users (primary, secondary or tertiary) presenting tosubstance use treatment.Table 9. Demographics of Opioid UsersState Totals - Opioid Clients er661.3%AmericanIndianAsian851.5%320.6%Pacific e than oneRaceTotalPuerto Rican210.4%2955.2%50.1%Other Hispanic3736.5%Not of HispanicOrigin501087.8%Total5704100.0%801.4%18 to 24111919.6%25 to 34270347.2%35 to 44110719.3%45 to 6469712.2%MexicanCubanAge hnicityClientsUnder 1865 and upTotal190.3%5722100.0%
Health %581.0%Medicaid120421.0%20.0%4257.4%Other 1051.8%Retired230.4%58610.3%Employed FullTimeEmployed PartTimeUnemployedDisabledAges 0 - 5Other 'Not inthe LaborForce'TotalAdmit LivingArrangement8.4%MedicareHMOAdmit Employment483HomelessPrivate NoSupportPrivate withSupportIncarceratedInstitution24 HoursResidentialFoster .0%61110.7%260.5%1522.7%90.2%Total5717100.0%State Total5722Estimates of Individuals in Need for Drug TreatmentIn addition to the DSAMH treatment admissions data, the National Survey on Drug Use and Health(NSDUH) survey also provides two proxy measures of treatment need for the state. One measureestimates the percentage of individuals who are dependent on or abusing illicit drugs, and a secondmeasure provides an estimate of the number of individuals who are in need, but not receivingtreatment for illicit drug use. Neither of the items is specifically worded to measure treatment need for
prescription opioids or heroin, and as such should only be considered proxy measures for this purpose.Additionally, it should be noted that due to changes to the NSDUH survey in 2015, the most recent dataavailable for these items is from 2014.Table 10 represents the percentage of Utahns, by age, who were estimated to be dependent on orabusing illicit drugs, and the percentage who were estimated to be in need of, but not receivingtreatment for illicit drug use from 2012 through 2014. Rates were highest in the young adult age group(18‐25) for both indicators, and there was generally a slight decreasing trend from 2012 through 2014for both measures across all age groups.Table 10. Estimates of Past Year Dependence/Abuse, and Needing but not Receiving Treatment forIllicit Drug Use by Age, Utah (2012‐2014)Needing but not ReceivingIllicit Drug Dependence or AbuseTreatment for Illicit Drug Use201220132014201220132014Ages 12‐173.993.733.563.703.533.37Ages 18‐256.556.976.136.276.435.76Ages 26 1.851.791.741.481.491.49Resource AssessmentThe SEOW and DSAMH data analysists identified all Opioid Treatment Providers, BuprenorphineTreatment Practitioners, Licensed Treatment Providers, Naloxone Training locations, Recovery Homes,and Coalitions throughout the state by small area. This search allows us to identify which areas haveadequate resources and gaps in services.The Utah State Opioid Treatment Providers (OTP's) provide medication‐assisted treatment (MAT) forpersons diagnosed with opioid‐use disorder. MAT is the use of medications, in combination withcounseling and behavioral therapies, to provide a whole‐patient approach to the treatment of substanceuse disorders. OTPs are required to have current valid accreditation status, SAMHSA certification, andDrug Enforcement Administration (DEA) registration before they are able to administer or dispenseopioid drugs for the treatment of opioid addiction.Buprenorphine Treatment Practitioners are physicians authorized to treat opioid dependency withbuprenorphine. Licensed Treatment Providers are private and public entities licensed to provide somelevel of substance use disorder treatment including day treatment, outpatient, residential and recoverysupports. These providers may serve youth and or adults. The Naloxone Training locations are granteesof the Utah Department of Health’s Preventing Drug Overdose grant. The locations provide training tofirst responders, community members and other providers on how to use and disseminate Naloxone inefforts to prevent opioid overdose deaths. Recovery Homes/Residences are locations that provide non‐clinical sober living for people in recovery. Coalitions are groups of individuals and organizations thatcome together for the purpose of preventing substance use disorder and improving health within theircommunity. While not all of these community coalitions are currently focused on the reduction of opioidmisuse and abuse, the presence of a coalition signals potential capacity for mobilizing a communityeffort to address the issue in the future. Table 11 below shows the matrix of services by small area.
Table 11. Resource Assessment by small tmentproviderRecoveryHome010000001020401010201Ben Lomond84404,84407,84412020000Morgan County(All)/WeberCounty ntown)84401,844021211411South iverdale84405,84409010201Utah Small AreaBrigham CityBox r84302Box Elder (Other)LoganBear he County(other)/RichCounty Practitioner000NaloxonetrainingCoalition
LocalSubstanceAbuseAuthorityDavis CountySalt Lake eatment NaloxonePractitioner tionUtah Small lle84014,84025001100WoodsCross/North 01Rose Park84116,84122000130SL f le84101,84104,84110,84180041700
roviderBuprenorphineTreatment NaloxonePractitioner tionUtah Small AreaBoundaryDesignationWest Valley (West)84120,84128,84170020000West Valley (east)2012 84119,84199010400SLC Downtown84102,84111,84145,841522512531South Salt 0920Holladay84117,84124,841270701010Salt Lake sville (east)84123130920Taylorsville 4000100MurrayMidvaleWestJordan(Northeast)
tproviderRecoveryHomeCoalition011001100030600Sandy (Center)84070,84091,840940201230Sandy 4020,84065,840960301661Tooele CountyAll zip codesfor Tooele032603Lehi/Cedar 020300Orem (North)84057,840591501070Utah Small AreaWest Jordan(southeast)West Jordan/CoppertonSouth JordanSalt Lake CountySandy (Southeast)Tooele CountyUtah CountyBuprenorphineTreatment NaloxonePractitioner 8408802084006,8408184095840921
pringville/Spanish Fork84653,84660,84663,84664010710Utah County South84626,84633,84651,84655010001Summit CountyAll zip codesfor Summit031402Wasatch CountyAll zip codesfor Wasatch010502031701Counties: Juab,Millard, Sanpete0301411Counties: Sevier,Piute, ovo (north)/BYU84602,846040Provo (South)84601,84603,84605,84606Utah Small AreaOrem (West)Orem (East)Utah CountySummit CountyWasatch CountyTriCountyCentralBuprenorphineTreatment NaloxonePractitioner trainingBoundaryDesignationDaggett,Duchesne,Uintah
LocalSubstanceAbuseAuthorityCountySoutheastern Utah * SFY2017San Juan became its owndistrict.Utah Small rphineTreatment NaloxonePractitioner tionCounties: Carbon,Emery022201Counties: Grand,San Juan0021022322012010601001611001703St. 90WashingtonCounty outside ofSt. GeorgeIronCedar CityBeaver,Garfield,Iron, KaneSouthwest districtOther84720,84721
Consequence and Resource Assessment July 2017 Prepared by: Bach Harrison, LLC, and the Utah Department of Human Services, Division of Substance Abuse and Mental Health . The Division of Substance Abuse and Mental Health (DSAMH) with assistance from Bach Harrison . Utah County 179 19.33 623 62.1 Wasatch 7 11.76 12 22.2 .