Transcription
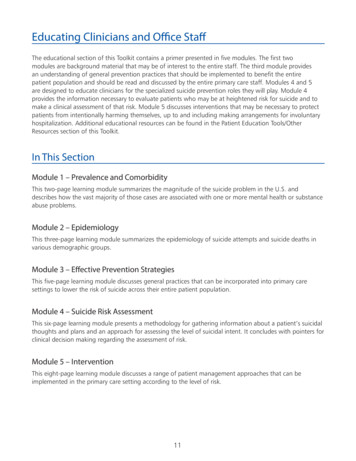
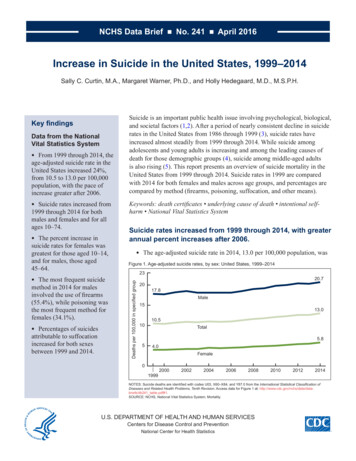
NCHS Data Brief No. 241 April 2016Increase in Suicide in the United States, 1999–2014Sally C. Curtin, M.A., Margaret Warner, Ph.D., and Holly Hedegaard, M.D., M.S.P.H.Data from the NationalVital Statistics System From 1999 through 2014, theage-adjusted suicide rate in theUnited States increased 24%,from 10.5 to 13.0 per 100,000population, with the pace ofincrease greater after 2006. Suicide rates increased from1999 through 2014 for bothmales and females and for allages 10–74.The percent increase insuicide rates for females wasgreatest for those aged 10–14,and for males, those aged45–64. The most frequent suicidemethod in 2014 for malesinvolved the use of firearms(55.4%), while poisoning wasthe most frequent method forfemales (34.1%). Percentages of suicidesattributable to suffocationincreased for both sexesbetween 1999 and 2014. Suicide is an important public health issue involving psychological, biological,and societal factors (1,2). After a period of nearly consistent decline in suiciderates in the United States from 1986 through 1999 (3), suicide rates haveincreased almost steadily from 1999 through 2014. While suicide amongadolescents and young adults is increasing and among the leading causes ofdeath for those demographic groups (4), suicide among middle-aged adultsis also rising (5). This report presents an overview of suicide mortality in theUnited States from 1999 through 2014. Suicide rates in 1999 are comparedwith 2014 for both females and males across age groups, and percentages arecompared by method (firearms, poisoning, suffocation, and other means).Keywords: death certificates underlying cause of death intentional selfharm National Vital Statistics SystemSuicide rates increased from 1999 through 2014, with greaterannual percent increases after 2006. The age-adjusted suicide rate in 2014, 13.0 per 100,000 population, wasFigure 1. Age-adjusted suicide rates, by sex: United States, 1999–201423Deaths per 100,000 in specified groupKey le0199920002002200420062008201020122014NOTES: Suicide deaths are identified with codes U03, X60–X84, and Y87.0 from the International Statistical Classification ofDiseases and Related Health Problems, Tenth Revision. Access data for Figure 1 at: http://www.cdc.gov/nchs/data/databriefs/db241 table.pdf#1.SOURCE: NCHS, National Vital Statistics System, Mortality.U.S. DEPARTMENT OF HEALTH AND HUMAN SERVICESCenters for Disease Control and PreventionNational Center for Health Statistics
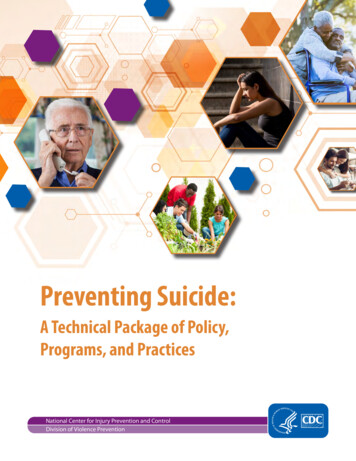
NCHS Data Brief No. 241 April 201624% higher than the rate in 1999 (10.5) (Figure 1). The average annual percent increase in the age-adjusted suicide rate was about 1% per yearfrom 1999 through 2006 but increased to 2% per year from 2006 through 2014. In 2014, the age-adjusted rate for males (20.7) was more than three times that for females(5.8). From 1999 through 2014, the percent increase in the age-adjusted suicide rate was greaterfor females (45% increase) than males (16% increase), resulting in a narrowing of thegender gap in suicide rates (as measured by rate ratios). The ratio of male to female suiciderates was lower in 2014 (3.6) than in 1999 (4.5).Suicide rates for females were higher in 2014 than in 1999 for all agegroups under 75 years. Suicide rates for females were highest for those aged 45–64 in both 1999 (6.0 per 100,000)and 2014 (9.8) (Figure 2). This age group also had the second-largest percent increase(63%) since 1999.Figure 2. Suicide rates for females, by age: United States, 1999 and 20141109.819992014Deaths per 100,000 in specified 415–2425–4445–64Age (years)65–7475 and over1Significantly higher than rates for all other age groups (p 0.05).NOTES: For all age groups, the difference in rates between 1999 and 2014 is significant (p 0.05). Suicides are identified with codes U03, X60–X84, and Y87.0from the International Statistical Classification of Diseases and Related Health Problems, Tenth Revision. Access data for Figure 2 at:http://www.cdc.gov/nchs/data/databriefs/db241 table.pdf#2.SOURCE: NCHS, National Vital Statistics System, Mortality. 2
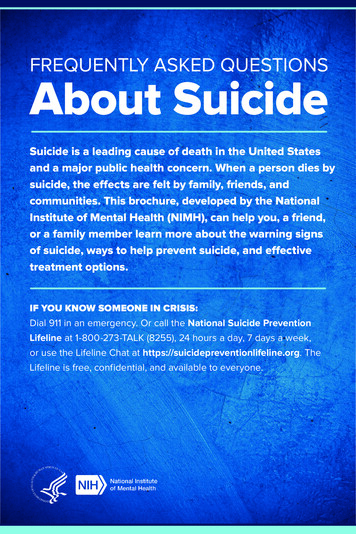
NCHS Data Brief No. 241 April 2016 Although based on a small number of suicides compared with other age groups (150 in2014), the suicide rate for females aged 10–14 had the largest percent increase (200%)during the time period, tripling from 0.5 per 100,000 in 1999 to 1.5 in 2014. Percent increases in suicide rates since 1999 for females aged 15–24, 25–44, and 65–74ranged between 31% and 53%. In contrast to other age groups, the suicide rate for women aged 75 and over decreased by11% from 1999 through 2014, declining from 4.5 to 4.0 per 100,000.Suicide rates for males were higher in 2014 than in 1999 for all age groupsunder 75 years. In both 1999 and 2014, suicide rates were highest among men aged 75 and over (Figure 3).In contrast to other age groups, the suicide rate for this demographic group decreased by8%, from 42.4 per 100,000 in 1999 to 38.8 in 2014. Men aged 45–64 had the second-highest suicide rate for males in 2014 and the largestpercent increase (43%) in rates, increasing from 20.8 in 1999 to 29.7 in 2014.Figure 3. Suicide rates for males, by age: United States, 1999 and 2014501999201442.43Deaths per 100,000 in specified 0101.912.610–1415–2425–4445–64Age (years)65–7475 and overSignificantly lower than rates for all other age groups (p 0.05).Significantly higher than rates for all other age groups except 75 and over (p 0.05).Significantly higher than rates for all other age groups (p 0.05).NOTES: For all age groups, the difference in rates between 1999 and 2014 is significant (p 0.05). Suicides are identified with codes U03, X60–X84, and Y87.0from the International Statistical Classification of Diseases and Related Health Problems, Tenth Revision. Access data for Figure 3 at:http://www.cdc.gov/nchs/data/databriefs/db241 table.pdf#3.SOURCE: NCHS, National Vital Statistics System, Mortality.123 3
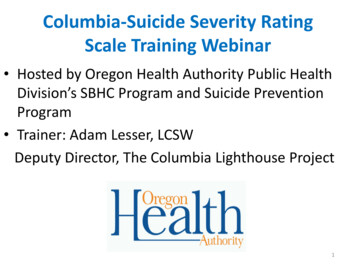
NCHS Data Brief No. 241 April 2016 While males aged 10–14 had the lowest suicide rate of all age groups, this groupexperienced the second-largest percent increase (37%) from 1999 through 2014 (from 1.9 to2.6).Percentages of suicides involving firearms and poisoning declined from1999 through 2014, while suicides involving suffocation increased. For both females and males, about one in four suicides in 2014 were attributable tosuffocation (includes hanging, strangulation, and suffocation), an increase from 1999, whenfewer than one in five were by this method (Figure 4). The percentages of suicides attributable to firearms and poisoning were lower in 2014 thanin 1999 for both females and males. Poisoning was the most common method of suicide for females in 2014, accounting forabout one-third (34.1%) of all female suicides. This was a change from 1999, when firearmswere the most common suicide method for women (36.9%), slightly more likely thanpoisoning (36.0%).Figure 4. Suicide deaths, by method and sex: United States, 1999 and 061.720036.931.0199920141999Female2014MaleNOTES: Except for Male-Other, all differences in percentages between 1999 and 2014 were significant at the 0.05 level. Suicide deaths are those withInternational Statistical Classification of Diseases and Related Health Problems, Tenth Revision (ICD–10) underlying cause-of-death codes U03, X60–84, andY87.0. Suicide methods are identified with codes X72–X74 for firearm, X60–X69 for poisoning, and X70 for suffocation. “Other” includes: Cut/Pierce; Drowning;Falls; Fire/Flame; Other land transport; Struck by or against; Other specified, classifiable Injury; Other specified, not elsewhere classified Injury; and UnspecifiedInjury, as classified by ICD–10. Access data for Figure 4 at: http://www.cdc.gov/nchs/data/databriefs/db241 table.pdf#4.SOURCE: NCHS, National Vital Statistics System, Mortality. 4
NCHS Data Brief No. 241 April 2016 More than one-half of male suicides (55.4%) in 2014 were firearm-related, although thepercentage of suicides by this method was lower than in 1999 (61.7%). The most frequent “other” suicide methods in 2014 (not shown separately) for females werefalls (2.8%) and drowning (1.4%). For males, the most frequent “other” methods were falls(2.2%) and cutting or piercing (1.9%).SummarySuicide is increasing against the backdrop of generally declining mortality, and is currentlyone of the 10 leading causes of death overall and within each age group 10–64 (4). This reporthighlights increases in suicide mortality from 1999 through 2014 and shows that while the rateincreased almost steadily over the period, the average annual percent increase was greater for thesecond half of this period (2006–2014) than for the first half (1999–2006). Increases in suiciderates occurred for both males and females in all but the oldest age group (75 and over). Percentincreases in rates were greatest for females aged 10–14 and for males, those aged 45–64. Themale-female disparity in suicide rates (as measured by rate ratios) narrowed slightly over theperiod. Poisoning was the most common suicide method for females in 2014, and firearms werethe most frequent for males, but both sexes showed increases since 1999 in the percentage ofsuicides attributable to suffocation. Suicide numbers and rates for females and males by Hispanicorigin and race for 1999 and 2014 are also available (http://www.cdc.gov/nchs/data/hestat/suicide/rates 1999 2014.htm).Data sources and methodsMortality and population data are from the Centers for Disease Control and Prevention’s (CDC)National Center for Health Statistics 1999–2014 multiple cause-of-death mortality files (6).Suicide deaths are those classified with the International Statistical Classification of Diseasesand Related Health Problems, Tenth Revision (ICD–10) underlying cause-of-death codes U03,X60–X84, and Y87.0 (7). Suicide deaths are categorized by method of injury using the followingICD–10 codes: firearm (X72–X74), suffocation (X70), poisoning (X60–X69), and other methods(U03, X71, X75–X84, and Y87.0).Age-adjusted death rates were calculated using the direct method and the 2000 standardpopulation (8). Demographic information comes from death certificates. Population data for 2000and 2010 are April 1 bridged-race census counts, and for 1999, 2001–2009, and 2011–2014 areJuly 1 bridged-race estimates from the vintage 2014 postcensal series. Trends in age-adjusteddeath rates were evaluated using the Joinpoint Regression Program (9). Suicide rates by agegroup were analyzed by comparing 1999 and 2014 only; trends during this time period were notanalyzed and may have varied by subgroup. The small number of suicides during 1999–2014 forpersons aged 5–9 years (79) were included in the total age-adjusted rates and in the percentagesby method. Male-female differences in suicide rates were based on rate ratios calculated as maleage-adjusted rate divided by female age-adjusted rate. 5
NCHS Data Brief No. 241 April 2016About the authorsSally C. Curtin and Margaret Warner are with CDC’s National Center for Health Statistics(NCHS), Division of Vital Statistics. Holly Hedegaard is with NCHS’ Office of Analysis andEpidemiology.References1. CDC. Preventing suicide. Available from: x.html.2. U.S. Surgeon General, National Action Alliance for Suicide Prevention. 2012 Nationalstrategy for suicide prevention: Goals and objectives for action. 2012.3. Hu G, Wilcox HC, Wissow L, Baker SP. Mid-life suicide: an increasing problem in U.S.whites, 1999–2005. Am J Prev Med 37(6):579. 2009.4. Heron M. Deaths: Leading causes for 2013. National vital statistics reports; vol 65 no 2.Hyattsville, MD: National Center for Health Statistics. 2016.5. Hempstead KA, Phillips JA. Rising suicide among adults aged 40–64 years: The role of joband financial circumstances. Am J Prev Med 48(5):491–500. 2015.6. National Center for Health Statistics. About underlying cause of death, 1999–2014. CDCWONDER online database. 2016. Available from: http://wonder.cdc.gov/ucd-icd10.html.7. WHO. International statistical classification of diseases and related health problems, tenthrevision (ICD–10). 2008 ed. Geneva, Switzerland. 2009.8. Xu JQ, Murphy SL, Kochanek KD, Bastian BA. Deaths: Final data for 2013. National vitalstatistics reports; vol 64 no 2. Hyattsville, MD: National Center for Health Statistics. 2016.9. National Cancer Institute. Joinpoint Regression Program (Version 3.4.3.) [computersoftware]. 2010. 6
NCHS Data Brief No. 241 April 2016 7
U.S. DEPARTMENT OFHEALTH & HUMAN SERVICESFIRST CLASS MAILPOSTAGE & FEES PAIDCDC/NCHSPERMIT NO. G-284Centers for Disease Control and PreventionNational Center for Health Statistics3311 Toledo Road, Room 5419Hyattsville, MD 20782–2064OFFICIAL BUSINESSPENALTY FOR PRIVATE USE, 300For more NCHS Data Briefs, htm.NCHS Data Brief No. 241 April 2016Suggested citationCopyright informationCurtin SC, Warner M, Hedegaard H. Increase in suicide in the United States, 1999–2014.NCHS data brief, no 241. Hyattsville, MD: National Center for Health Statistics. 2016.All material appearing in this report is inthe public domain and may be reproducedor copied without permission; citation as tosource, however, is appreciated.National Center for HealthStatisticsCharles J. Rothwell, M.S., M.B.A., DirectorNathaniel Schenker, Ph.D., Deputy DirectorJennifer H. Madans, Ph.D., AssociateDirector for ScienceDivision of Vital StatisticsDelton Atkinson, M.P.H., M.P.H., P.M.P.,DirectorHanyu Ni, Ph.D., M.P.H., Associate Directorfor ScienceOffice of Analysis and EpidemiologyIrma E. Arispe, Ph.D., DirectorMakram Talih, Ph.D., Associate Director forScienceFor e-mail updates on NCHS publicationreleases, subscribe online at:http://www.cdc.gov/nchs/govdelivery.htm.For questions or general informationabout NCHS:Tel: 1–800–CDC–INFO (1–800–232–4636)TTY: 1–888–232–6348Internet: http://www.cdc.gov/nchsOnline request form: http://www.cdc.gov/infoISSN 1941–4927 Print ed.ISSN 1941–4935 Online ed.DHHS Publication No. 2016–1209CS264464
Suicide rates increased from 1999 through 2014, with greater 0 5 10 15 20 23 17.8 20.7 13.0 5.8 10.5 4.0 Male Female Total 2000 2002 2004 2006 2008 2010 2012 2014 1999 Figure 1. Age-adjusted suicide rates, by sex: United States, 1999-2014. NOTES: Suicide deaths are identified with codes U03, X60-X84, and Y87.0 from the . International .