Transcription
Jones IZA Journal of Labor Economics (2015) 4:8DOI 10.1186/s40172-015-0024-6ORIGINAL ARTICLEOpen AccessHow do teachers respond to tenure?Michael D JonesCorrespondence: m.jones@uc.eduDepartment of Economics,University of Cincinnati, 324 LindnerHall, 2925 Campus Green Drive,Cincinnati, OH 45221, USAAbstractI use the 2007 Schools and Staffing Survey to estimate the effect of tenure on K-12teacher behavior. Estimates are obtained by exploiting the cross-state variation in theprobationary period length of novice teachers. I find that in the year that teachersare evaluated for tenure, they spend significantly more of their own money onclassroom materials. The teachers also participate more in school committees andextracurricular activities during the evaluation year. After increased activity during thetenure evaluation year, behavior appears to return to the baseline established priorto evaluation.JEL Classifications: I21; I28; J22; M5Keywords: Teacher tenure; Employment protection legislation1 IntroductionIn most public school districts, teacher tenure is a time-honored element of teacheremployment contracts. However, several states across the United States have recentlyintroduced legislation to modify or eliminate teacher tenure. In 2011, the state ofFlorida passed a bill that any new teacher hired would receive a year-to-year contract,effectively eliminating tenure. In 2009, Ohio extended the probationary period before ateacher is eligible for tenure from three years to seven years. Proponents of tenureargue that once teachers demonstrate competency during a probationary time period,they should be protected from arbitrary dismissal. Opponents of tenure argue that theprocess of firing poor performing teachers is too time-consuming and expensive. Oncea teacher receives tenure, school districts must follow a detailed and costly sequence ofsteps to fire a poor performing tenured teacher. As a consequence, few tenuredteachers are fired for poor performance in the United States. According to The WidgetEffect, from 2004–2008, Chicago Public Schools only formally dismissed 9 tenuredteachers, or 0.01 percent of its workforce. Prior to receiving tenure, school districtscan fire, or fail to renew the contract, of a probationary teacher for almost anyreason – with the exception of discriminatory or other illegal reasons. Becausetenure status increases a teacher’s job security by reducing the likelihood of beingfired, I investigate how teachers anticipate and respond to receiving tenure.In this paper, I look at the change in a teacher’s spending on classroom materialsand explore whether teachers change their time allocation in activities outside of theclassroom (e.g., club sponsorship, coaching, serving on school committees, etc.).Research has consistently found that teacher quality is one of the most importantschool-level variables affecting student performance (Rivkin et al. 2005; Aaronson et al. 2015 Jones; licensee Springer. This is an Open Access article distributed under the terms of the Creative Commons AttributionLicense (http://creativecommons.org/licenses/by/4.0), which permits unrestricted use, distribution, and reproduction in any medium,provided the original work is properly credited.
Jones IZA Journal of Labor Economics (2015) 4:82007; Chetty et al. 2011). Changes in teacher behavior during the tenure evaluationyear may affect student performance. I also investigate how teacher work hours changeonce a teacher is granted tenure – where the number of work hours is measured as thetotal time a teacher spends on school-related activities during a given week. Relative tothe year that teachers are evaluated for tenure, I examine how these measures changeimmediately before receiving tenure and in the years following tenure. To answer thesequestions, I use data from the 2007–2008 restricted use version of the Schools andStaffing Survey (SASS) and exploit the cross-state variation in the probationary periodlength of novice teachers. The majority of states require that teachers serve for three yearsin a district before tenure is granted. However, several states have shorter probationaryperiods of only one or two years, while others have longer periods of four or five years.Teacher tenure is a specific application of employment protection legislation (EPL)which consists of the laws and regulations that govern the hiring and firing of workers.Once a teacher is granted tenure, dismissal or firing costs increase considerably. Thereis a sizable economics literature on the effects of EPL on various outcomes of interest.Autor et al. (2007) found that the adoption of wrongful discharge protection laws inthe United States altered firms’ production choices, causing employers to retainunproductive workers. Blanchard and Portugal (2001) found that the strict employmentprotection in Portugal profoundly affected the labor market relative to the United Statesand led to an increased duration of unemployment. Heckman and Pages (2000) showedthat job security legislation in Latin America reduced employment and increased wageinequality across workers. Several other papers also found that EPL affects workeremployment (Lazear 1990; Miles 2000; Kugler and Saint Paul 2004; Martins 2009).There are also papers that investigate the impact of EPL on individual worker behavior.Ichino and Riphahn (2005) used data from a large Italian bank and found that employeeabsenteeism increased significantly once employees were no longer under a probationaryperiod. Scoppa (2010) used the 1990 EPL reform act in Italy to investigate the effect onworker absenteeism in that country. Using a difference-in-difference approach, the authorexploited the fact that the law drastically increased the firing costs for small firms andfound that shirking increased once employees were granted firing protection. Despite thisextensive literature, there is little research that looks at EPL in the context of K-12 education. Jacob (2010) used the 2004 new collective bargaining agreement in Chicago PublicSchools (CPS) that gave principals the flexibility to dismiss probationary teachers for anyreason and found that annual teacher absences were reduced by roughly 10 percent.Goldhaber and Hansen (2010) examine the implications of using value-added models as acriterion for granting tenure to teachers. The Widget Effect, published by The NewTeacher Project, documents the relationship between tenure and the number of teacherswho are fired. While not specifically addressing teacher tenure, Hansen (2010) used NorthCarolina administrative data and found that teacher absences increased dramatically inthe year prior to teacher retirement or departure. While understanding teacher behaviorunder EPL is itself a worthwhile research question, this research is also an important firststep in understanding how teacher tenure might affect student outcomes to the extentthat teacher behavior changes under tenure.I find that in the year that teachers are evaluated for tenure, they spend significantlymore of their own money on classroom materials. The teachers also participate morein school committees and extracurricular activities during the evaluation year. I alsoPage 2 of 19
Jones IZA Journal of Labor Economics (2015) 4:8Page 3 of 19find evidence that these changes in behavior are temporary. After a spike in activityduring the tenure evaluation year, behavior appears to return to the baseline establishedprior to being evaluated for tenure.2 State variation in teacher tenureThe history of teacher tenure in the United States began in 1909 when New Jerseybecame the first state to pass comprehensive tenure legislation for K-12 teachers. Bythe 1940s, seventy percent of teachers were covered by tenure protection; and today,nearly every state has passed legislation granting some form of tenure. In some states,tenure status is also called a continuing contract or permanent employment status.Regardless of its name, tenure is a series of steps or due process that must be followedin order to dismiss a tenured teacher. In order to receive tenure, new teachers in aschool district must be employed for a probationary period. During the 2007–2008school year, the most common probationary period length was three years, but theprobationary period length varied between one year and five years. Table 1 shows theprobationary period for each state before a teacher was eligible to receive tenure.The tenure process comprises at least the following four elements: time to tenure,criteria to earn tenure, process for conferring tenure, and tenure protections (Hasselet al. 2011). In this research, I exploit the variation in the time to tenure in order tounderstand the effect of tenure on teacher behavior. The other tenure elements do notvary substantially across the states. Incorporating student performance in the tenuredecision is rare at the state level. According to the 2008 NCTQ State Teacher PolicyYearbook, only two states, Iowa and New Mexico, required that student academicperformance be considered in the criteria for awarding teacher tenure. Even in thoseTable 1 Number of years before a teacher earns tenure, by state, 2008No policy (1)(3)2 years (7)3 years (33)DCHawaiiCaliforniaAlabamaNew Jersey4 years (5)5 years aNew MexicoIllinoisN. DakotaMarylandArizonaNew YorkKentuckyNevadaArkansasOhioMichiganS. CarolinaColoradoOklahomaN. sylvaniaGeorgiaRhode IslandIdahoS. usettsVirginiaMinnesotaWest VirginiaMontanaWisconsinNebraskaWyomingN. HampshireSource: NCTQ state teacher policy yearbook 2008.
Jones IZA Journal of Labor Economics (2015) 4:8states, student performance is not the predominant criterion for awarding tenure.Because states often leave tenure decisions to the discretion of the local school district,I also investigate to what extent student performance, specifically student growth, isdiscussed in school district contracts as a requirement for teacher tenure. Out of the 50largest school districts in the United States, only three districts specifically requireteachers to demonstrate objective student growth on standardized tests prior to beingawarded tenure during the 2007–2008 school year, according to the NCTQ TeacherContract Database.Because of the increased intensity of performance reviews and in-class evaluationsduring the tenure evaluation year, as well as the saliency of the process, we mightexpect an increase or “spike” in teacher effort and activities during that year. Primaryand secondary tenure operates differently than university tenure. For example, Singelland Lillydahl (1996) find that assistant professors spend more time on teaching andresearch compared to full professors, but there is no difference in time allocationwithin the rank of assistant professor. Link et al. (2008) find similar results. Earningtenure in a university environment requires consistent and persistent efforts over a fiveto seven year period of time.While the systems for conferring tenure across states are procedurally different, theoutcomes are not – few teachers who are eligible for tenure are denied this status. Inthe 2009 report, The Widget Effect, researchers find that in five of the six schooldistricts they studied, less than one percent of probationary teachers were deniedtenure. Since the time of the report, several states and districts have increased thestandards required to receive tenure. For example, in the 2010–2011 school year,New York City introduced more stringent requirements in order for teachers toachieve tenure. Teachers are now rated under a four-point scale that must incorporatestudent test scores, classroom observations, and parental feedback (the previous ratingsystem only measured two levels – unsatisfactory and satisfactory). The number ofteachers who were denied tenure outright increased from 1 percent in 2006 (approximately the same time period of the data used in this research) to 3 percent in 2011.In contrast, teachers outside of New York City but still in the state of New York arenot always subject to these rigorous elements for tenure. New York state law onlyrequires that teachers be granted tenure after a majority vote of the Board of Cooperative Educational Services upon the recommendation of the district superintendent. Thedistrict superintendent must write a report to the board of cooperative educationalservices indicating that the teacher is “competent, efficient and satisfactory.” There isno rubric or requirement that teachers meet student achievement benchmarks orundergo a certain number of observations from a principal or third-party observer. Inreviewing tenure documents across the remaining states, I conclude that while theprocedural nature of the tenure application varies, there is little substantive differencein the outcomes of the tenure process.Finally, once a teacher receives tenure, every state provides a substantially higherdegree of protection for a teacher’s employment contract. According to data from the2007–2008 SASS, only two percent of teachers in the United States were dismissed orfailed to have their contract renewed. Table 2 shows the wide variation in dismissalrates across states. South Dakota removed almost 12 percent of its teachers for poorperformance, while Arkansas removed only 0.2 percent. In some school districts, thatPage 4 of 19
Jones IZA Journal of Labor Economics (2015) 4:8Page 5 of 19Table 2 Teacher dismissal rates in the 2006–2007 year, 2007–2008 SASS data,all teachersUnited StatesAverage numberof teachersper districtNumber of teachers whowere dismissed or did nothave their contracts renewedPercentage of teachers whowere dismissed or did nothave their contracts renewed211.44.42.1%59.87.111.9%Highest 5 StatesSouth west 5 .90.5%North Dakota46.20.20.4%Arkansas123.00.30.2%Note: Of the 3,780 districts, only 18% of districts fired a tenured teacher for poor performance.Source: U.S. Department of Education, National Center for Education Statistics, Schools and Staffing Survey (SASS),“Public School District Data File,” 2007–08.number is even lower. I tested whether the variation in firing percentages across statesgenerated heterogeneity in teacher response. However, I could find no significant difference between states which fire a relatively higher percentage of teachers relative tothose which fire a relatively lower percentage of teachers. This lack of heterogeneitycould be due to the fact that outside of South Dakota and Alaska, every state fired lessthan four percent of teachers for poor performance.3 DataDetails on state tenure laws come from the 2008 National Council on Teacher Quality(NCTQ) State Teacher Policy Yearbook. In the yearbook, NCTQ publishes eachstate’s probationary period before a teacher may be granted tenure, as well as acitation for the relevant state law. In addition, prior to publication of the yearbook, theorganization provides state officials with a draft copy of its findings in order to checkthe accuracy of its claims. Because some laws were written to permit school districtadministrators to have authority over teacher tenure under special circumstances, attimes, discretion must be used to code a state’s probationary period into a numericalvalue. For example, the state of Maryland has a probationary period of two years, butit may be extended to three years on an individual basis. NCTQ decided to codeMaryland as having a two-year probationary period. In the four states where NCTQ notesthat there are potentially different interpretations, I follow NCTQ’s coding scheme.I match the 2007 NCTQ data to teacher response data from the restricted-use version of the 2007–2008 Schools and Staffing Survey (SASS), conducted by the NationalCenter for Education Statistics. Begun in 1987, the SASS is fielded every three to fouryears and surveys a stratified random sample of public schools, private schools, andschools funded by the Bureau of Indian Education (BIE). The SASS collects data on
Jones IZA Journal of Labor Economics (2015) 4:8Page 6 of 19teacher, administrator, and school characteristics, as well as school programs andgeneral conditions in schools. In addition to restricting the sample to public schoolteachers only, teachers who indicated that they received no salary or did not work fulltime were dropped from the analysis. Teachers from career or vocational schools,alternative schools, and special education schools were also removed from the sample.These teachers were dropped because of the unique circumstances of these schools.Because I am only interested in looking at teacher behavior around tenure, I removeteachers who have been teaching for 8 or more years. Table 3 provides summary statistics for the 2007 SASS sample.Table 3 describes overall characteristics of the teaching labor force in the 2007–2008SASS. Teaching is a female-dominated profession with more than three-quarters of allteachers being female. Over one-half of teachers work in a district with a collectivebargaining agreement. Teachers are asked to provide the total amount of hours spenton all teaching and school-related activities during a typical full week, and the averagefor this variable is 53 hours per week. This self-reported number of work hours ishigher than what is found in other well-known datasets like the CPS; however, theTable 3 Summary statistics, data from 2007 SASSTeacher demographicsMeanMinMaxStd. eaching Year3.34170.03Salary 42,175 15,000 110,000 10,945Student-Teacher Ratio14.61183.30.09Free Lunch Percentage0.43010.01School CharacteristicsDistrict CharacteristicsExpenditures per Student 11,878 4,899 69,203 115Collective Bargaining Agreement0.53010.0153.3030808.71Outcomes of InterestWork HoursOwn Money Spent 422.860 9000 8.44Professional Development0.88010.01Communication10.84010.01Job Security Worry20.34010.01Coach a School Sport0.18010.01Serve as a Curriculum Specialist0.09010.01Serve on a School or District Committee0.51010.01Sponsor a School Club0.37010.01Total Observations15,650Note: Sample sizes rounded to nearest 10 for NCES confidentiality purposes.1) Dummy variable is defined as 1 if a teacher uses any of the following to communicate with parents or studentsoutside of the regular school day: e-mail to send out group updates, e-mail to address individual questions or concerns,online bulletin board, course or teacher web page, course or teacher blog, instant messaging (IM).2) Teachers are asked if they agree or strongly agree with the following statement “I worry about the security of my jobbecause of the performance of my students on state and/or local tests.
Jones IZA Journal of Labor Economics (2015) 4:8SASS prompts the teacher to include hours spent during the school day, before andafter school, and on the weekends.Teachers indicate that they spend about 420 of their own money on average onclassroom supplies. The fact that teachers spend their own money in the classroom isso common that the IRS allows a tax deduction for these purchases called the EducatorExpense Deduction. Teachers can deduct up to 250 of any unreimbursed expensesincurred for books, supplies, computer equipment, and other supplementary materials.In addition, I look at teacher participation in school extra-curricular activities as ameasure of teacher devotion. Approximately eighteen percent of teachers coach a sportat the school they teach, and one-third of teachers sponsor a school club. Over onehalf of teachers indicate that they serve on a school or district wide committee, whileonly ten percent serve as a curriculum specialist. Almost ninety percent of teachersparticipate in some form of professional development.In order for tenure to alter behavior, teachers must have flexibility to make changesaround school and extracurricular activities. In the SASS, teachers are asked, “Howmany hours are you required to work to receive base pay during a typical full week atthis school?” On average, school districts require teachers to work 38 hours a week.Since teachers indicate that they spend 53 hours on all teaching-related activities, thereis still considerable flexibility for teachers to reduce participation rates in extracurricularactivities. Likewise, if teachers are required to participate in professional developmentactivities, teacher tenure could not affect any changes in professional development participation rates. While states do require teachers to participate in some form of professionaldevelopment to maintain their certification, there is often a time window in which tocomplete these activities. For example, the state of Ohio requires a teacher to complete 18continuing education units over a 5 year time period in order to maintain certification.Because a teacher has flexibility around scheduling these units, the possibility of strategicbehavior in response to teacher tenure exists.Previous literature has found a relationship between teacher behavior, attitudes, instructional practices, and other activities on student achievement. Palardy and Rumberger(2008) found positive effects on student achievement by teachers who use differentcurricula and approaches to instructional practices (e.g., journal writing, silent reading,geometric manipulations, etc.). Other literature has found similar effects of instructionalpractices on student achievement (Lee et al. 1997; Xue and Meisels 2004; Guarino andHamilton 2006). In the SASS, teachers who serve as curriculum specialists may be willingto improve their curriculum and approach to teaching. Teachers’ use of their own moneyalso signals a desire to invest more in curriculum or instructional practices in order to positively affect student achievement. In addition, a teacher’s attitude at work has been shownto influence student achievement (Rowan et al. 1991). Finally, a teacher’s credentialing, asevidenced by investing in professional development, has been found to produce mixedresults on student achievement. Some authors have found a positive effect, while othershave found little or no effect (Goldhaber and Brewer 2001; Wayne and Youngs 2003).4 Empirical methodologyTo estimate the effects of teacher tenure on effort, I use a type of difference-in-differenceframework to exploit the cross-state variation in the time required for a teacher to earnPage 7 of 19
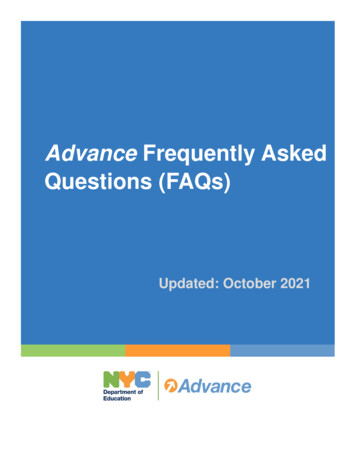
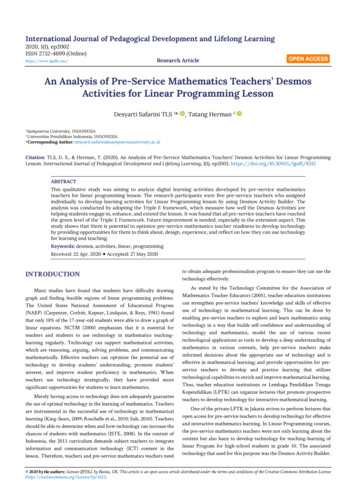
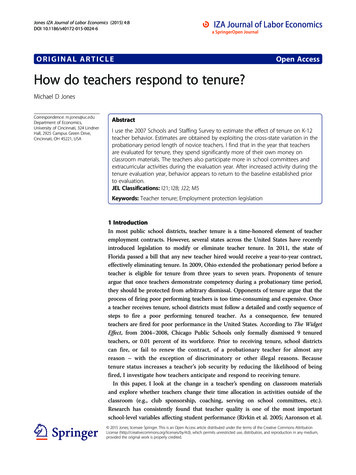
Jones IZA Journal of Labor Economics (2015) 4:8Page 8 of 19tenure. I exclude Washington DC from the data since there is no required probationaryperiod specified in the employment contract. Within the 50 states, I use the observationsin the first year after a teacher receives tenure as the treatment group in the model. Thecontrol group consists of teachers who are in the same year of teaching as the treatmentgroup but have not yet received tenure because of the state’s longer probationary period.I use this estimation method because simply comparing the differences in outcomesbefore and after tenure may be confounded by other factors that drive these differences.For example, teachers with one more year of experience may not need as much time toteach the material effectively. There could also be changes in expectations around schoolservice activities for more experienced teachers. For these and other reasons, using stateswith a longer probationary period controls for the differences in teacher behavior that arenot related to teacher tenure.Figure 1 provides a visual description of the identification strategy by plotting theamount of unreimbursed money that teachers spend on classroom materials by thelength of a state’s probationary period. For the states with either a two or three yearprobationary period, Figure 1 clearly shows a “spike” in classroom expenditures in theyear that a teacher is being evaluated for tenure. Teachers in two year probationaryperiod states spend more than 100 of their own money in that year relative to theprevious year or following year. This sharp increase in expenditures in the year oftenure evaluation motivates the following empirical specification.For the empirical analysis, I estimate the following equation:Y icdst ¼ β0 þ BeforeTenureEvalicdst β1 þ 1YrTenureicdst β2 þ 2PlusYrTenureicdst β3þI icdst β4 þ C cdst β5 þ Ddst β6 þ μs þ υicdst þ εicdst;ð1Þwhere Yicdst is the outcome of interest for teacher i, in school c, in school district d, instate s, in teaching year t. BeforeTenureEval is a dummy variable indicating if theFigure 1 Personal money spent on classroom materials, SASS data.
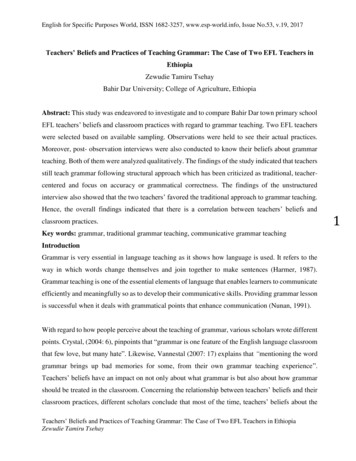
Jones IZA Journal of Labor Economics (2015) 4:8teacher is in a year prior to the tenure evaluation year. 1YrTenure is a dummy variableindicating if a teacher is in the first year of teaching with tenure, and 2PlusYrsTenure isa dummy variable indicating if a teacher has two or more years of teaching with tenure.Finally, I is a vector of individual characteristics, S is a vector of school-level characteristics, and D is a vector of district-level characteristics, μs are state dummy variables,υicdst are dummy variables for years of teaching experience, and εicdst is an idiosyncraticerror term. Coefficients on the three tenure dummy variables are interpreted relative tothe tenure evaluation year.One potential concern is how to address the tenure status of veteran teachers whotransfer school districts. There are a few examples where states have made it easier forveteran teachers to acquire tenure after transferring school districts. For example, in2011, Illinois passed SB7, which allows previously tenured teachers who earned either a“Proficient” or “Excellent” rating to be eligible for tenure in 2 years if they earned an“Excellent” rating in each of the first two years in the new district. A new teacher inIllinois would be on probation for four years, rather than two. With the limitations ofthe data, I cannot calculate whether or not this type of condition would be applicablefor a teacher in the dataset. Therefore, I treat all teachers as under the same tenurelaws as specified in the NCTQ dataset. Including potentially tenured teachers in myestimation strategy would bias my results towards zero. One other concern is thatteacher behavior after tenure may be partly driven by selection effects. If less efficientteachers are less likely to receive tenure, then the results may be biased. While there issome concern about selection effects, in 48 out of 50 states, less than four percent ofteachers are fired for poor performance. To the extent that selection bias may exist, theeffect is likely to be small.5 ResultsThe estimate of the effect of teacher tenure on classroom expenditures is reported incolumn 1 of Table 4.Relative to the tenure evaluation year, teachers spend approximately 70 less onclassroom materials in the years leading up to the evaluation. Likewise, they also spendapproximately 75 less in the first year of receiving tenure. This amount reflects an 18percent decline from the average of 420 spent on classroom materials. The coefficientof 68 on the Tenure Evaluation Year dummy in Column 2 of Table 4 clearly showsthe spike in expenditures in the tenure evaluation year. Column 3 of Table 4 shows theresults using a simplified difference-in-difference specification with only using dummyvariables for the first year of tenure as well as for two or more years with tenure.Relative to teachers without tenure, teachers in the first year of tenure spend 73 lesson classroom expenditures. However, even though the coefficient on the “Two or MoreYears with Tenure” dummy is negative, it is statistically insignificant, suggesting thatthe immediate drop in classroom expenditures may be temporary. Teachers may feelthat they need to “take a break” after the tenure evaluation year, but behavior revertsback to trend after a one year pause. Column 4 of Table 4, which presents the baselinespecification without any teacher or district controls, shows that the decline inclassroom expenditures is not driven by changes in teacher or district characteristics.Regardless of whether teachers spend their own money as an investment in theirPage 9 of 19
Jones IZA Journal of Labor Economics (2015) 4:8Page 10 of 19Table 4 Effect of teaching tenure on own money spent, SASS data(1) BaselineBefore Tenure Evaluation 68.068** 69.038**(29.924)(29.881)Tenure Evaluation Year(2) Tenure evaluationyear dummy(3) Exclude “BeforeTenure Evaluation”dummySample restrictions(4) No individualteacher or districtcontrols68.068**(29.924)First Year With TenureTwo Or More YearsWith TenureBlackHispanicOther RaceMaleAgeSalary ( 1000s)Student-Teacher RatioFree Lunch PercentageExpenditures Per StudentCollective BargainingSecond Year of TeachingThird Year of TeachingFourth Year of TeachingFifth Year of TeachingSixth Year of TeachingSeventh Year of Teaching 75.567** 7.499 72.582* 62.519**(34.803)(45.906)(36.886)(27.533) 26.89741.171 38.842 20.752(44.233)(62.679)(44.507)(41.629) 84.454*** 84.454*** 5(23.033)(23.033)(22.555) 91.581** 91.581** 91.120**(34.666)(34.666)(34.728) 96.151*** 96.151*** **(0.966)(0.966)(0.969) 3.127* 3.127* 6***(24.353)(24.353)(24.352) 2.613** 2.613** 36.02932.846(28.267)(28.267)(25.755)(27.988) 31.896 31.89625.074 18.136(34.405)(34.405)(20.975)(34.777) 37.237 37.23727.344 28.892(52.303)(52.303)(39.033)(49.917) 67.960 67.9609.762 45.762(64.568)(64.568)(42.686)(66.013) 74.371 74.3714.934 53.010(76.580)(76.580)
In most public school districts, teacher tenure is a time-honored element of teacher employment contracts. However, several states across the United States have recently introduced legislation to modify or eliminate teacher tenure. In 2011, the state of Florida passed a bill that any new teacher hired would receive a year-to-year contract,