Transcription
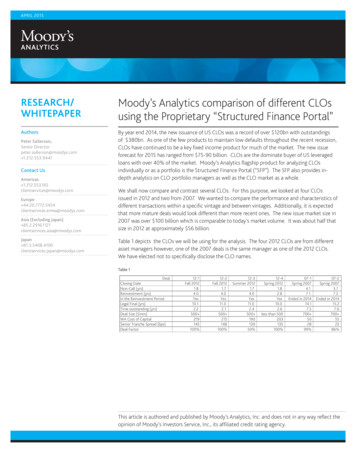
APRIL 2015RESEARCH/WHITEPAPERMoody’s Analytics comparison of different CLOsusing the Proprietary “Structured Finance Portal”AuthorsBy year end 2014, the new issuance of US CLOs was a record of over 120bn with outstandingsof 380bn. As one of the few products to maintain low defaults throughout the recent recession,CLOs have continued to be a key fixed income product for much of the market. The new issueforecast for 2015 has ranged from 75-90 billion. CLOs are the dominate buyer of US leveragedloans with over 40% of the market. Moody’s Analytics flagship product for analyzing CLOsindividually or as a portfolio is the Structured Finance Portal (“SFP”). The SFP also provides indepth analytics on CLO portfolio managers as well as the CLO market as a whole.Peter Sallerson,Senior Directorpeter.sallerson@moodys.com 1.212.553.9447Contact UsAmericas 1.212.553.165clientservices@moodys.comEurope 44.20.7772.5454clientservices.emea@moodys.comAsia (Excluding Japan) 85.2.2916.1121clientservices.asia@moodys.comJapan 81.3.5408.4100clientservices.japan@moodys.comWe shall now compare and contrast several CLOs. For this purpose, we looked at four CLOsissued in 2012 and two from 2007. We wanted to compare the performance and characteristics ofdifferent transactions within a specific vintage and between vintages. Additionally, it is expectedthat more mature deals would look different than more recent ones. The new issue market size in2007 was over 100 billion which is comparable to today’s market volume. It was about half thatsize in 2012 at approximately 56 billion.Table 1 depicts the CLOs we will be using for the analysis. The four 2012 CLOs are from differentasset managers however, one of the 2007 deals is the same manager as one of the 2012 CLOs.We have elected not to specifically disclose the CLO names.Table 1DealClosing DateNon-Call (yrs)Reinvestment (yrs)In the Reinvestment PeriodLegal Final (yrs)Time outstanding (yrs)Deal Size ( mm)WA Cost of CapitalSenior Tranche Spread (bps)Deal Factor12-1Fall 20121.84.0Yes10.12.2500 219145100%12-2Fall 20121.74.0Yes11.02.1500 215148100%12-3Summer 20121.74.0Yes11.02.4500 19013050%12-4Spring 20121.82.8Yes10.02.6less than 500203135100%07-1Spring 20074.17.1Ended in 201414.17.5700 502899%07-2Spring 20073.77.2Ended in 201415.27.6700 552386%This article is authored and published by Moody’s Analytics, Inc. and does not in any way reflect theopinion of Moody’s Investors Service, Inc., its affiliated credit rating agency.
MOODY’S ANALYTICSLINE OF BUSINESS HEREThere are a few items to note as we start. All of the CLOs are managed by firms that have completed multiple transactions over theyears. Three of the four CLOs from 2012 are slightly over 500mm in size while the fourth is smaller. The cost of capital for the 2007Vintage is less than a third that of the 2012 CLOs. Three of the seven deals have amortized a portion of the liabilities. Finally, CLO 12-4has a greater than 10% middle market bucket. The implications of this will become more apparent further into the analysis.Chart 1The advance rate of CLOs has changed over time. In 2007, the Aaa’s represented about 70% of the structure while after the recession,that was reduced to below 65%. The corresponding amount of equity was increased to at least 11% (from 7-8%) in each of the 2012CLOs other than 12-1. That CLO was the only one to issue a “B” rated tranche which increased the deal leverage. Typically with moreleverage, the expected return of 12-1 would increase, but so would the volatility of those returns.Before we go more in-depth into the aforementioned CLOs, let’s look at a further comparison of the two vintages overall. Table 2compares the 2012 vintage with the 2007 vintage. There are several items of noteworthy difference highlighted in the table. Given theupcoming Volcker requirements, the investment in bonds has mostly been eliminated in the 2012 vintage. Covenant Lites were typicallynot specifically measured in the 2007 deals, but even when using the Suspected Covenant Lite field (loans indicated as covenant lite inany other CLO), they are much lower in 2007 than 2012 vintage. When looking at the collateral tests typically in the Collateral Matrix,you notice that the diversity is lower in 2007 as expected as CLOs amortize. While the collateral Weighted Average Spread (“WAS”) isgreater in the 2012 vintage, the cushion to the test level is significantly smaller. With a lower cost of capital, the 2007 CLOs typically setlower WAS requirements. However, as spreads have generally widened, they have been able to purchase wider spread collateral whenreinvesting in new collateral. As expected, the Weighted Average Life (“WAL”) of the collateral in the CLOs past their reinvestment periodis shorter.2APRIL 2015MOODY’S ANALYTICS COMPARISON OF DIFFERENT CLOS USING THE PROPRIETARY “STRUCTURED FINANCE PORTAL”
LINE OF BUSINESS HEREMOODY’S ANALYTICSTable 2Median201225th percentile75th percentileMedian200725th percentile75th percentileCollateralBond %Second Lien %Senior Secured %Covenant Lite %Suspected Cov Lite %Structured %Suspected Amended 7.0%0.0%0.0%97.8%N/A11.8%0.0%7.5%Matrix TestsMoody's DiversityDiversity CushionMoody's WARFWARF CushionWA Recovery Test %WA Recovery Test Cushion %WAL (yrs)WA LIBOR Floor %Has LIBOR Floor %WAS %WAS (Pre-floors) %WAS Test Cushion manceAnnualized Default Rate %Annualized Equity Return %Annualized Par Build %Caa/CCC %Credit Risk Sales %Defaulted %Suspected Defaulted %Senior OC CushionJunior OC %1.0%26.0%0.2%0.7%3.0%0.0%2.3%38.3%7.4%There are also some interesting differences in the performance of the two vintages (see the yellow highlights). Both the Annual DefaultRate and current holdings of Suspected Defaults (collateral indicated as default in other CLOs) are higher in the 2007 vintage yet theAnnualized Equity Return in still stronger. A key to that strong result is the lower cost of capital coupled with the widening loan spreadover time. There is more volatility of Equity Returns in the 2007 CLOs given their longer time outstanding and the deep recessionaryenvironment they went through. The 2007 deals have been more active in their trading of Credit Risk loans which is partially correlatedwith higher Suspected Defaults. The principal conclusion is that the 2007 vintage significantly benefited from locking in low fundingcosts while earning greater income through the rising yields of their investments in a relatively low default environment.The overlap analysis of the CLOs in the two groups is interesting. As expected there is a significant overlap of collateral between 12-1 and07-1 which are both by the same manager (almost 54%). However, one might expect 07-1 to have a high overlap with the other 2007vintage CLO, but it is actually in the same range as two of the other three 2012 CLOs. One possible conclusion could be that over time,the collateral of an older vintage CLO drifts toward more recent deals as they all reinvest in new collateral. Alternatively, there is only a7% overlap between CLO 12-2 & 12-4 which is partly explained by 12-4’s middle market bucket. 12-4 is the most collateral differentiatedCLO of the group.3APRIL 2015MOODY’S ANALYTICS COMPARISON OF DIFFERENT CLOS USING THE PROPRIETARY “STRUCTURED FINANCE PORTAL”
LINE OF BUSINESS HEREMOODY’S ANALYTICSExhibit 1Overlap - Issuer, 62%14.71%22.76%11.01%25.59%25.59%Table 3 compares certain key performance indicators of the specific CLOs. While there are many similarities among the deals, there area few differences that are noteworthy. The cash balance difference does stand out. It ranges from a high of over 1.5% in two of the dealsto actually being negative in CLO 12-2. While a negative cash balance may seem counterintuitive, it occurs when collateral purchasetickets have been written prior to the sales ticket. Yet the CLO cannot borrow additional funds, so the settlement must result in a zero orpositive cash balance. Since cash balances earn low returns, CLO managers attempt to minimize them while maintaining sufficient cashto both handle forthcoming settlements and exploit future investment opportunities.Table 3Cash Balance PercentageWeighted Average Loan PriceWeighted Average Performing Loan PriceWeighted Average Defaulted Loan PriceLast Period Equity Cash on CashAnnualized last Period Eq Cash on CashTotal Equity Cash on CashTotal Eq CoC / yrsStandard Deviation of Equity ReturnsMinimum OC CushionCaa/CCC %% Currently DefaultedManager ave defaulted %Manager Diff vs this CLOSuspected % Currently DefaultedManager Suspected Defaulted %Manager Diff vs this CLOAnnualized Default Rate %Annualized Par Build %Credit Risk Sales 0.3%)12.0%Source: Pricing data supplied by Thomson Reuters for loans, bonds and any equity are unpriced.The prices of the performing loans are in a tight band of 97.8 – 98.6, yet the overall Weighted Average Loan Price drops to a low of 93.2given the high percent of CLO 07-2 (9.2%) that is defaulted. This contrasts to the 2012 vintage which essentially have no defaults. 07-2is also much closer to failing it overcollateralization test than the others.4APRIL 2015MOODY’S ANALYTICS COMPARISON OF DIFFERENT CLOS USING THE PROPRIETARY “STRUCTURED FINANCE PORTAL”
MOODY’S ANALYTICSLINE OF BUSINESS HEREWhen analyzing the default performance of a CLO, it is important to both look at the specific deal, but to also look at how the dealvaries from others of the same vintage or same manager. For example, the percent currently in default for each of the 2012 CLOs isvery low while 07-2 is unusually high at 9.2%. Additionally, the other five CLOs from both vintages have similar default percentages tothe manager’s average default holdings while 07-2 is almost double that manager’s average of 4.9%. Thus, even though this managertypically holds a higher amount of defaulted collateral, this particular CLO is an outlier. Moody’s also reports the Suspected DefaultedPercentage which includes collateral that others list as defaulted regardless of if this CLO considers it defaulted. Taking these intoaccount, the default holdings of 07-02 is over 10%. Related to these performance indicators is both the low OC cushion and negativepar building in 07-2 as compared to the other five CLOs.Equity investors will see that the returns vary widely across the transactions with both the highest and lowest performing CLOs beingthe two from the 2007 vintage with an annual cash on cash return of 31.7% and 7.8%. Yet even the weaker CLO outperformed mostother asset classes during the same period. The 2012 vintage is a narrower range of 16% to 26%. When just looking at the most recentperiod’s cash flow to the equity, the strongest returns are generally from the 2007 CLOs. It is interesting to note that CLO 07-2, whichhas some stress, had the second highest equity payout in its most recent period yet the weakest overall returns. The overall equityperformance of 07-2 is weakened by the multiple periods without any distribution. The standard deviation of the periodic equity returns(typically quarterly for US CLOs) ranged from 2.2% to 14.5% with largest being for the 2007 Vintage (a standard deviation was notcalculated for one of the CLOs). The standard deviation for the CLOs of US managers is slightly more than 7%.In addition to the overall return, many investors are focused on the timing of the equity payments. Table 4 shows both the total historicdistributions and the periodic payments to the equity investors under a specific set of modeling assumptions. Please note that in severalof the CLOs, there are very low or no payments projected to be made to these investors in some quarters. This may occur if some ofthe overcollateralization tests fail and funds that would have been available for the equity investors are being used to reinvest or redeemliabilities. Alternatively, the income generated may not be sufficient to release funds to the equity. The final payment is typically thelargest as the liabilities have been repaid and all remaining funds after any deal costs are released to the equity investors. The projectionsassume there is no future trading by the collateral manager which could have a material effect on the performance of the CLO.CLO 12-4 which closed in 2012 has returned a greater percentage of its equity investment than 07-1 which closed five years earlier.Lower equity returns typically result from i) collateral losses which lower available cash flow or cause the failure of a coverage test or ii)lower income on reinvested collateral. Yet, even the worst performing CLO within the group (07-2) still is expected to generate a positivereturn. The actual percentage return to any investor will also depend upon the price they paid for the equity. Our analysis is based uponpar purchases.As expected, the older 2007 CLOs have a shorter remaining average life, but not a substantially shorter one primarily due to their longerreinvestment period (seven years for the 2007 vintage vs four years for the 2012 vintage). Since reinvested new issue loans typically havethe same life, CLOs during their reinvestment period have similar WALs unless constrained by differing WAL test requirements. However,once a CLO leaves its reinvestment period, the WAL usually shortens. Mitigating this is any prepayment of shorter collateral at a fasterrate than longer collateral. Both of the 2007 Vintage CLOs ended their reinvestment period in 2014. There is only a six month variationin the average lives of the 2012 CLOs.5APRIL 2015MOODY’S ANALYTICS COMPARISON OF DIFFERENT CLOS USING THE PROPRIETARY “STRUCTURED FINANCE PORTAL”
LINE OF BUSINESS HEREMOODY’S ANALYTICSTable 4Projected Remaining Equity Payments by QuarterPrior PaymentsFuture asted Total as% of Face AmtTotal Eq ReturnAve RemainingLife 6%133.5%371.8%80.7%139.8%3.83.94.03.53.03.4The key modeling assumptions are in Table 4a where CPR represents the Annual Prepayment rate and CDR the Annual Default Rate.Table 4aAssumptions:CPRReinv Sprd (bps)30%375CDRRecovery Rate2%70%Recovery LagReinv Price6 months100%Table 5 focuses on the varying collateral characteristics and related collateral matrix performance. For example, Covenant Lite (“CovLite”) is not measured in the 2007 vintage yet can be analyzed through the Moody’s Suspected Cov Lite % data which includes allcollateral listed at Cov Lite in any CLO. Using this data, the CLOs are more similar across vintage yet still vary by 20% in their Cov Liteholdings. Typically investors who focus on Cov Lite holdings will want to use this analysis which normalizes the results for varying dealdefinitions. Related to the high Cov Lite bucket in 12-2 is the number of second lien loans of 6.2%. None of the others even have 4%second liens. None of the CLOs have any bonds likely a result of the Volcker Rules, yet I suspect that the 2007 vintage CLOs had bondsat some point.6APRIL 2015MOODY’S ANALYTICS COMPARISON OF DIFFERENT CLOS USING THE PROPRIETARY “STRUCTURED FINANCE PORTAL”
Table 5CollateralBond %Second Lien %Senior Secured %Covenant Lite %Suspected Cov Lite %Structured %% Long DatedMatrix TestsMoody's DiversityDiversity CushionMoody's WARFWARF CushionManager CLO Average WARFManager Diff vs this CLOWA Recovery Test %WA Recovery Test Cushion %WAL (yrs)WA LIBOR Floor %Has LIBOR Floor %WAS %WAS Test Cushion 2,4181772,334(84)51.5%8.2%3.91.0%66.0%3.0%10.0The 2007 CLOs have long dated collateral (collateral which matures beyond the legal final maturity date of the CLO) which is typicallynot allowed in 2012 CLOs. Long dated collateral may present some risk to the debt investors since at the CLO maturity date, they cannotrely upon redemptions to repay the CLO liabilities. If there is a shortfall, this collateral must be sold and the debt holders are subject tothe market value risk.The Collateral Matrix Tests are designed to ensure the CLO has sufficient diversity and net cash flow to support its liabilities understressful default scenarios. Debt holders typically benefit from a positive cushion in the tests in the form of higher expected creditprotections. Equity holders most directly benefit from excess spread on the collateral. As you would expect from the previous discussionsof the performance of these CLOs, generally the numbers are the weakest for 07-2. It is failing its Moody’s Diversity test (a measure ofindustry and issuer concentration) and is closest to its Moody’s WARF and Weighted Average Spread (“WAS”) requirements. The WARFof 07-2 is furthest below the average WARF of any of the Managers’ CLOs. Interestingly, 12-4 has both the weakest WARF and the mostoutperformance of that Manager’s other deal WARFs. CLO 12-4 was likely structured to withstand a higher WARF given the highermiddle market loan bucket.Earlier we showed how 07-1 had the strongest equity performance. All other factors being equal, this is expected given the extremeexcess spread likely generated by having 214 bps cushion in the WAS test. None of the others even have one third of the cushion. 07-2,which has the weakest equity return, only has a 10 bps cushion. The cushion on 12-4 is also low, but the higher equity returns of thatCLO benefited from the extremely low default rate, the excess income earning collateral generated by the highest par building of thegroup and potentially greater spread cushion earlier in the CLO’s life.When comparing CLOs, it is useful to know the different industry focus of different managers and within various CLOs. Exhibit 2 showsthe top industry concentrations across the CLOs being examined. The top two industries are i) FIRE: Banking, Finance, Insurance & RealEstate and ii) Healthcare & Pharmaceuticals. In four of the transactions, these represent two of the three largest concentrations. Hotel,Gaming & Leisure is also near the top of four CLOs, but not always among the top three in a particular CLO. Three CLOs had either HighTech Industries or Hotel, Gaming & Leisure. Note the very high industry concentrations in the amortizing CLOs. This occurs as collateral7APRIL 2015MOODY’S ANALYTICS COMPARISON OF DIFFERENT CLOS USING THE PROPRIETARY “STRUCTURED FINANCE PORTAL”
from other industries repays at a faster rate and there is no Diversity related reinvestment test to maintain. Almost a quarter of the 0702 CLO is in Healthcare & Pharmaceuticals. While there is significant overlap across vintages, Diversified/Conglomerate Service and ABS(which includes structured products) are only among the top of one of the 2007 vintage CLOs. Typically, 2011 or later Vintages do notallow for investment in ABS. Finally, Retail is also only among the top five in one CLO.Exhibit 2Industry BreakownFIRE: Banking, Finance, Insurance & Real EstateHealthcare & PharmaceuticalsHigh Tech IndustriesHotel, Gaming & LeisureMedia: Broadcasting & 03,33735,193,51112.0%9.0%7.9%7.3%7.0%Industry BreakownHealthcare & PharmaceuticalsRetailHigh Tech IndustriesServices: BusinessBeverage, Food & 234,304,22511.7%8.9%7.9%7.2%6.9%Industry BreakownHotel, Gaming & LeisureFIRE: Banking, Finance, Insurance & Real EstateHealthcare & PharmaceuticalsTelecommunicationsServices: 4838,735,05513.3%10.9%10.7%10.2%7.7%Industry BreakownFIRE: Banking, Finance, Insurance & Real EstateHealthcare & PharmaceuticalsHigh Tech IndustriesDiversified/Conglomerate ServiceHotel, Gaming & 150,518,61919.6%14.4%14.3%12.7%10.1%Industry BreakownTelecommunicationsHealthcare & PharmaceuticalsMedia: Broadcasting & SubscriptionServices: BusinessBeverage, Food & 038,612,7709.1%9.0%8.6%8.6%7.7%Industry BreakownHealthcare & PharmaceuticalsFIRE: Banking, Finance, Insurance & Real EstateABSHotel, Gaming & LeisureMedia: Broadcasting & 305,80256,401,46023.7%14.9%12.5%12.5%11.3%The top five industry breakdown for the 2012 & 2007 vintages in aggregate are shown in Exhibit 3. In 2012, the noticeable difference isthat Telecommunications is not in the top five yet it is one of the top five in only two of the four 2012 CLOs. The largest industries in07-1 or 07-2 CLOs include ABS and Hotel, Gaming & Leisure as opposed to the 2007 vintage as a whole.Exhibit 32007 VintageHealthcare & PharmaceuticalsFIRE: (Finance, Insurance, RE, Banking)Media: Broadcasting & SubscriptionDiversified/Conglomerate ServiceHigh Tech Industries2012 VintageHealthcare & PharmaceuticalsHigh Tech IndustriesServices: BusinessHotel, Gaming & LeisureFIRE: (Finance, Insurance, RE, Banking)The geographic distribution (per the CLO constraints) is predominately US though the concentration ranges from 90% – 98% asdepicted in Table 6. Canada and Luxembourg are the next two largest locations with smaller amounts in other European locations andoccasionally Australia. The geographic distribution is more an indication of the locale of the credits the asset manager prefers than afocus on creating geographic diversity in itself as desired by typical mortgage deals.Table United KingdomGermanyFrance8APRIL .1%07-292.7%3.4%0.7%2.3%0.8%MOODY’S ANALYTICS COMPARISON OF DIFFERENT CLOS USING THE PROPRIETARY “STRUCTURED FINANCE PORTAL”
Chart 2 shows the breakdown of collateral prices. As expected with performing CLOs, the vast majority of the collateral is pricedat 95 or above. The one exception is 12-4 which has the larger middle market loan bucket that typically does not have public loanprices. Separately, the weaker performing CLO 07-2 has a large unpriced bucket of almost 15%. This bucket includes loans, equity andstructured products. Equity typically only is included in a CLO as a recovery from defaulted collateral. CLOs 12-1 and 07-1 each haveover 6% of their portfolio priced at 85-95 which is larger than most. CLO 07-2 has over 5% of its collateral priced below 75 which ishighly unusual for a CLO. Two loans represents a majority of that.Chart 2Source: Pricing data supplied by Thomson Reuters for loans, bonds and any equity are unpriced.Chart 3Source: Pricing data supplied by Thomson Reuters.Note: Unpriced collateral is assumed to be priced at the average of all of the CLO’s collateral for purpose of an NAV calculation.To be conservative, any equity is essentially assumed to have no value.9APRIL 2015MOODY’S ANALYTICS COMPARISON OF DIFFERENT CLOS USING THE PROPRIETARY “STRUCTURED FINANCE PORTAL”
The equity NAV is related to the collateral price. As expected with the lower priced collateral, the NAV for 07-2 is zero as shown in Chart3. The others range from the low 50s to the low 80s with 12-4 being the highest. 12-4 also has the strongest equity returns thus far.NAV can be an indicator of the likelihood of a CLO being called as well as the strength of the CLO in general.While there are many similarities among CLOs, a careful analysis shows that the value comes from understanding the differences. EvenCLOs from the same manager perform differently partly based upon their relative vintage. CLOs that start out similar, differentiate basedupon the performance, underlying collateral and collateral constraints, market conditions and collateral manager style. The proper toolsare essential when comparing CLOs.10APRIL 2015MOODY’S ANALYTICS COMPARISON OF DIFFERENT CLOS USING THE PROPRIETARY “STRUCTURED FINANCE PORTAL”
MOODY’S ANALYTICSLINE OF BUSINESS HERE 2015 Moody’s Corporation, Moody’s Investors Service, Inc., Moody’s Analytics, Inc. and/or their licensors and affiliates (collectively, “MOODY’S”). All rights reserved.CREDIT RATINGS ISSUED BY MOODY’S INVESTORS SERVICE, INC. (“MIS”) AND ITS AFFILIATES ARE MOODY’S CURRENT OPINIONS OF THE RELATIVE FUTURE CREDIT RISKOF ENTITIES, CREDIT COMMITMENTS, OR DEBT OR DEBT-LIKE SECURITIES, AND CREDIT RATINGS AND RESEARCH PUBLICATIONS PUBLISHED BY MOODY’S (“MOODY’SPUBLICATIONS”) MAY INCLUDE MOODY’S CURRENT OPINIONS OF THE RELATIVE FUTURE CREDIT RISK OF ENTITIES, CREDIT COMMITMENTS, OR DEBT OR DEBT-LIKESECURITIES. MOODY’S DEFINES CREDIT RISK AS THE RISK THAT AN ENTITY MAY NOT MEET ITS CONTRACTUAL, FINANCIAL OBLIGATIONS AS THEY COME DUE ANDANY ESTIMATED FINANCIAL LOSS IN THE EVENT OF DEFAULT. CREDIT RATINGS DO NOT ADDRESS ANY OTHER RISK, INCLUDING BUT NOT LIMITED TO: LIQUIDITY RISK,MARKET VALUE RISK, OR PRICE VOLATILITY. CREDIT RATINGS AND MOODY’S OPINIONS INCLUDED IN MOODY’S PUBLICATIONS ARE NOT STATEMENTS OF CURRENTOR HISTORICAL FACT. MOODY’S PUBLICATIONS MAY ALSO INCLUDE QUANTITATIVE MODEL-BASED ESTIMATES OF CREDIT RISK AND RELATED OPINIONS OR COMMENTARY PUBLISHED BY MOODY’S ANALYTICS, INC. CREDIT RATINGS AND MOODY’S PUBLICATIONS DO NOT CONSTITUTE OR PROVIDE INVESTMENT OR FINANCIALADVICE, AND CREDIT RATINGS AND MOODY’S PUBLICATIONS ARE NOT AND DO NOT PROVIDE RECOMMENDATIONS TO PURCHASE, SELL, OR HOLD PARTICULARSECURITIES. NEITHER CREDIT RATINGS NOR MOODY’S PUBLICATIONS COMMENT ON THE SUITABILITY OF AN INVESTMENT FOR ANY PARTICULAR INVESTOR. MOODY’SISSUES ITS CREDIT RATINGS AND PUBLISHES MOODY’S PUBLICATIONS WITH THE EXPECTATION AND UNDERSTANDING THAT EACH INVESTOR WILL, WITH DUE CARE,MAKE ITS OWN STUDY AND EVALUATION OF EACH SECURITY THAT IS UNDER CONSIDERATION FOR PURCHASE, HOLDING, OR SALE.MOODY’S CREDIT RATINGS AND MOODY’S PUBLICATIONS ARE NOT INTENDED FOR USE BY RETAIL INVESTORS AND IT WOULD BE RECKLESS FOR RETAIL INVESTORS TOCONSIDER MOODY’S CREDIT RATINGS OR MOODY’S PUBLICATIONS IN MAKING ANY INVESTMENT DECISION. IF IN DOUBT YOU SHOULD CONTACT YOUR FINANCIALOR OTHER PROFESSIONAL ADVISER.ALL INFORMATION CONTAINED HEREIN IS PROTECTED BY LAW, INCLUDING BUT NOT LIMITED TO, COPYRIGHT LAW, AND NONE OF SUCH INFORMATION MAY BECOPIED OR OTHERWISE REPRODUCED, REPACKAGED, FURTHER TRANSMITTED, TRANSFERRED, DISSEMINATED, REDISTRIBUTED OR RESOLD, OR STORED FOR SUBSEQUENT USE FOR ANY SUCH PURPOSE, IN WHOLE OR IN PART, IN ANY FORM OR MANNER OR BY ANY MEANS WHATSOEVER, BY ANY PERSON WITHOUT MOODY’SPRIOR WRITTEN CONSENT.All information contained herein is obtained by MOODY’S from sources believed by it to be accurate and reliable. Because of the possibility of human or mechanical error aswell as other factors, however, all information contained herein is provided “AS IS” without warranty of any kind. MOODY’S adopts all necessary measures so that the information it uses in assigning a credit rating is of sufficient quality and from sources MOODY’S considers to be reliable including, when appropriate, independent third-party sources.However, MOODY’S is not an auditor and cannot in every instance independently verify or validate information received in the rating process or in preparing the Moody’sPublications.To the extent permitted by law, MOODY’S and its directors, officers, employees, agents, representatives, licensors and suppliers disclaim liability to any person or entity for anyindirect, special, consequential, or incidental losses or damages whatsoever arising from or in connection with the information contained herein or the use of or inability to useany such information, even if MOODY’S or any of its directors, officers, employees, agents, representatives, licensors or suppliers is advised in advance of the possi
2 APRIL 2015 MOODY'S ANALYTICS COMPARISON OF DIFFERENT CLOS USING THE PROPRIETARY "STRUCTURED FINANCE PORTAL" There are a few items to note as we start. All of the CLOs are managed by firms that have completed multiple transactions over the years. Three of the four CLOs from 2012 are slightly over 500mm in size while the fourth is smaller.


