Transcription
2019 MARKET SHARE REPORT(FEATURING 2016 AND 2017 DIRECT WRITTEN PREMIUM DATA SOURCED FROM A.M. BESTALL ANALYSIS DONE BY IIABA)COPYRIGHT@2018-19 INDEPENDENT INSURANCE AGENTS & BROKERS OF AMERICA, INC. ALL RIGHTS RESERVED. ALL DATA USEDIN THIS REPORT IS THE PROPERTY OF A.M. BEST AND USED WITH ITS PERMISSION.
INTRODUCTION This reports contains information on select property/casualty premiums by line. Not all lines of business areincluded in this report. Included are personal auto, commercial auto, homeowners, commercial multi-peril andworkers compensation. Note: the commercial lines total is not inclusive of Accident and Health lines. There was just under 4.5% overall increase in DWP between 2016 and 2017. Some lines that IIABA monitors sawsmall decreases or no growth in premium. Private Passenger Auto saw an 8% increase, the largest of any linemonitored. This report are only inclusive of the lines for which IIABA requested data. 2016 and 2017 showed no significant gains or losses in any distribution channel. IA companies wrote 35% of all personal lines in 2016 and 2017 84% of all commercial lines premiums are written by IA companies. (not inclusive of Accident and Health). All analyses in this report are done by IIABA. Direct any questions regarding the report toMadelyn Flannagan,VP of Agent Development, Research and Education via email: Madelyn.Flannagan@iiaba.netCOPYRIGHT@2018-19 INDEPENDENT INSURANCE AGENTS & BROKERS OF AMERICA, INC. ALL RIGHTS RESERVED. ALL DATA USEDIN THIS REPORT IS THE PROPERTY OF A.M. BEST AND USED WITH ITS PERMISSION.
ABOUT THIS REPORT This report marks the 23st year in which A.M. Best Co. has provided the Independent Insurance Agents and Brokers ofAmerica with year-end industry market share data to provide an updated assessment of the state of the independentagency system. All data in this report comes from A.M. Best and is printed with permission. The A.M. Best data offers IIABA an accurate look at changes with property/casualty insurance distribution because itseparates captive agency and direct response carriers. As A.M. Best does not have a “direct response” specific reportingcategory, IIABA directs A.M. Best which companies should be placed in that category. In addition, as requested by IIABAand defined by IIABA, the affiliates of selected groups leveraging various distribution systems are separated and placed inthe appropriate distribution category (wherever the company group uses separate affiliates for this purpose). Please notethat in some cases premiums written in some company affiliates may NOT be reported independently and therefore maynot be reflected in the correct distribution channel. In the charts in this report, previous-year market share numbers are the most mature numbers compiled by A.M. Best,and they reflect the same affiliate adjustments in order to provide as accurate comparisons as possible. Readers maynote some premium and market share changes from previous reports. The new numbers for prior years from the latestdata are used. This occurs because carriers report adjustments for prior years, which changes the market sharepercentages for prior years.COPYRIGHT@2018-19 INDEPENDENT INSURANCE AGENTS & BROKERS OF AMERICA, INC. ALL RIGHTS RESERVED. ALL DATA USEDIN THIS REPORT IS THE PROPERTY OF A.M. BEST AND USED WITH ITS PERMISSION.
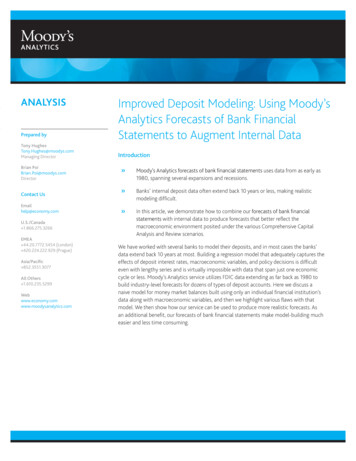
PROPERTY/CASUALTY INSURANCE BY LINE (LINESSELECTED FOR THIS REPORT-IN BILLIONS)Chart TitlePrivate Passenger Auto 213.9 231.0 94.2Homeowners Mutli-Peril 91.4 57.6Worker's Compensation 57.9 35.8Commercial Auto 32.0 40.3Commercial Multi-Peril 40.1 0.0 50.0 100.02017 150.02016COPYRIGHT@2018-19 INDEPENDENT INSURANCE AGENTS & BROKERS OF AMERICA, INC. ALL RIGHTS RESERVED. ALL DATA USEDIN THIS REPORT IS THE PROPERTY OF A.M. BEST AND USED WITH ITS PERMISSION. 200.0 250.0
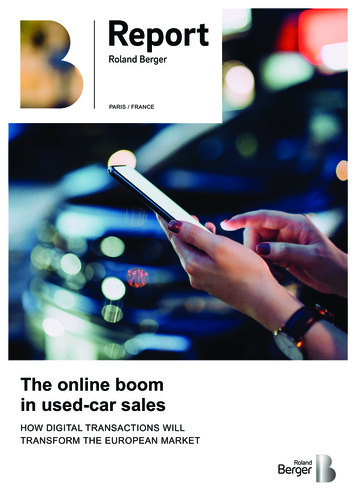
PERSONAL LINES PREMIUMS-2017Direct WrittenPremium(billions)% Share% Captive46.6The 2016 DWP was 309.7 billion for all personal lines. 2017 saw a 6.4% increase, to 329.3 billion. All channels saw growth withthe direct channel seeing the largest year over year growth at 13.2%. or just over 7Billion, followed by regionals writers at 7%or 6 billion. The IA channel held on to 35.1% share of the personal lines market at the end of 2017.COPYRIGHT@2018-19 INDEPENDENT INSURANCE AGENTS & BROKERS OF AMERICA, INC. ALL RIGHTS RESERVED. ALL DATA USEDIN THIS REPORT IS THE PROPERTY OF A.M. BEST AND USED WITH ITS PERMISSION.
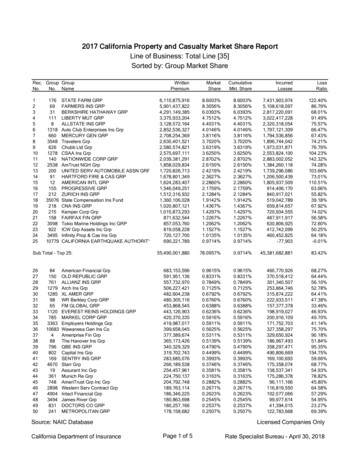
COMMERCIAL PREMIUMS-20172106 and 2017 Commercial PremiumsDirect 1%Market 9.42016Continuing a trend that began in 2015, 2017 did not experience the growth seen in earlier studies, with the overall commercial marketgrowing by a little over 3%. Still holding the majority of the market at 84%, the national and regional agency companies saw acombined increase, and write a total of just under 250 Billion.COPYRIGHT@2018-19 INDEPENDENT INSURANCE AGENTS & BROKERS OF AMERICA, INC. ALL RIGHTS RESERVED. ALL DATA USEDIN THIS REPORT IS THE PROPERTY OF A.M. BEST AND USED WITH ITS PERMISSION.
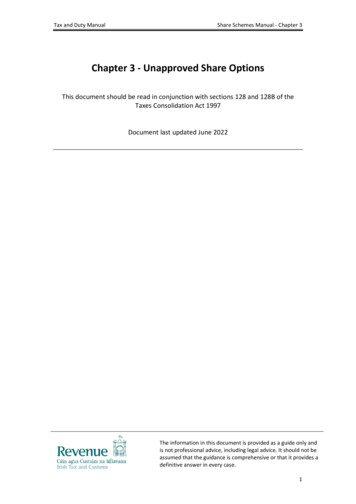
PRIVATE PASSENGER AUTODirectWrittenPremiums(Billions)%Share% PremiumChange from2016 to %7.94%Private passenger auto premiums hit 231 billion mark, growing over 17billion from 2016, or just under 8%. All distribution channels saw somegrowth in 2017 with the independent agency companies and the directs bothgrowing by 10%. The captive channel lost 1% of its share to the directs,while the IA share remained at 31%.COPYRIGHT@2018-19 INDEPENDENT INSURANCE AGENTS & BROKERS OF AMERICA, INC. ALL RIGHTS RESERVED. ALL DATA USEDIN THIS REPORT IS THE PROPERTY OF A.M. BEST AND USED WITH ITS PERMISSION.2017 MARKET SHARE BYDISTRIBUTION CHANNELNational7%Direct23%Captive46%Regional24%
HOMEOWNERS2017 Homeowners Market ctThe homeowners market grew just under 3 billion from 2016 to 2017 ( 91.4 billion in 2016 and 94.2 billion in 2017)The captive carriers lost a small share to the regional carriers. Homeowners insurance accounted for approximately 30%of all property/casualty insurance lines in 2017.Direct Written Premium(billions)% ShareGrowth2016 to 2017National 12.913.6%0%Regional 30.031.8%3.2%Captive 44.847.5%-2.5% 6.56.95%3.9% 94.2100%3%DirectTotalCOPYRIGHT@2018-19 INDEPENDENT INSURANCE AGENTS & BROKERS OF AMERICA, INC. ALL RIGHTS RESERVED. ALL DATA USEDIN THIS REPORT IS THE PROPERTY OF A.M. BEST AND USED WITH ITS PERMISSION.
COMMERCIAL AUTOThe commercial auto market grew nearly 9% from2016 to 2017 ( 32. billion to 35.8 billion) with themajority of the growth again going to the IA channel,with the regional agency companies seeing 15%growth. The captive channel saw a 9% increase inDPW, and maintained their 13% share of the market.As in the past, the direct response channel has lessthan 1% of this market.% Share of Commercial Auto 201713%Captive42%National44.2% RegionalDirect WrittenPremiumsNational 15 BillionRegional 15.9 BillionCaptives 4. 7 BillionCOPYRIGHT@2018-19 INDEPENDENT INSURANCE AGENTS & BROKERS OF AMERICA, INC. ALL RIGHTS RESERVED. ALL DATA USEDIN THIS REPORT IS THE PROPERTY OF A.M. BEST AND USED WITH ITS PERMISSION.NationalRegionalCaptive
COMMERCIAL MULTI-PERIL (BILLIONS)CHANNELDirect WrittenPremiums2017 7.4 14.5 18.5DIRECT WRITTEN PREMIUM BY DISTRIBUTIONNATIONAL IASREGIONAL IASCAPTIVES%Share% Changefrom 2016National 18.545.8%-1%Regional 14.536%1%Captives 7.418.2%-.5%Total 40.4100%-.5%Commercial Multi-Peril grew just under 1billion in 2017.( 39.5 to 40.4). National and Regional Carriers continue tohold the largest share of the market at approximately 82%COPYRIGHT@2018-19 INDEPENDENT INSURANCE AGENTS & BROKERS OF AMERICA, INC. ALL RIGHTS RESERVED. ALL DATA USEDIN THIS REPORT IS THE PROPERTY OF A.M. BEST AND USED WITH ITS PERMISSION.
WORKERS COMPENSATIONFor 2017, the Worker’s Compensation premiums were just shy of 58 billion, showing no significant increase over2016 ( 57.9 billion) and 2015 57.1 billion) IA carriers continue to write 89% of the premiums in this line. DirectResponse carriers have relatively no market share in this line.Market Share of Workers %IA CompaniesCaptive CompaniesDirect Response CarriersWrite .5%COPYRIGHT@2018-19 INDEPENDENT INSURANCE AGENTS & BROKERS OF AMERICA, INC. ALL RIGHTS RESERVED. ALL DATA USEDIN THIS REPORT IS THE PROPERTY OF A.M. BEST AND USED WITH ITS PERMISSION.
STATE SHARES BY RANGE-2017 (HELD BY IA CHANNEL)Share of Personal Lines20102017More than 50%2345-50%5340-45%7735-40%51030-35%105Less than 30%2223Share of Commercial 5-70%3360-65%0055-60%10COPYRIGHT@2018-19 INDEPENDENT INSURANCE AGENTS & BROKERS OF AMERICA, INC. ALL RIGHTS RESERVED. ALL DATA USEDIN THIS REPORT IS THE PROPERTY OF A.M. BEST AND USED WITH ITS PERMISSION.
STATE MARKET SHAREStates with the 5 Largest Gains and Losses in IA Commercial Lines Share (2016 vs. 2017)StatePercentage Points GAINEDStatePercentage Points N, MT, CT-0.33ME0.67WV-0.29States with the 5 Largest Gains and Losses in IA Personal Lines Share 2016-2017StatePercentage Points GAINEDStatePercentage Points LOSTTX1.07PA-0.77UT1.05NM, DC-0.75AK.89FL, CA-0.72DE.87WY-0.58IN.66RI-0.53COPYRIGHT@2018-19 INDEPENDENT INSURANCE AGENTS & BROKERS OF AMERICA, INC. ALL RIGHTS RESERVED. ALL DATA USEDIN THIS REPORT IS THE PROPERTY OF A.M. BEST AND USED WITH ITS PERMISSION.
DIRECT WRITTEN PREMIUMS AND MARKET SHARES –SELECT OTHER ,014,937,0099,399,750,3521.6017.3781.03INLAND THER LIABILITY .2192.79OTHER LIABILITY 32MEDICAL PROFESSIONAL LIABILITYPRODUCTS LIABILITYTOTALDIRECTAGENCYWRITERS-2017 WRITERS-2017COPYRIGHT@2018-19 INDEPENDENT INSURANCE AGENTS & BROKERS OF AMERICA, INC. ALL RIGHTS RESERVED. ALL DATA USEDIN THIS REPORT IS THE PROPERTY OF A.M. BEST AND USED WITH ITS PERMISSION.Updated041519
This report marks the 23st year in which A.M. Best Co. has provided the Independent Insurance Agents and Brokers of America with year-end industry market share data to provide an updated assessment of the state of the independent agency system. All data in this report comes from A.M. Best and is printed with permission.