Transcription
A GROWING MOVEMENT:AMERICA’S LARGESTCHARTER SCHOOLCOMMUNITIESTENTH ANNUAL EDITIONNOVEMBER 2015
student enrollment. This report identifiescommunities that have the highestpercentage and the highest number ofpublic school students enrolled in charterschools. When families have public schoolchoice, they increasingly select charterpublic schools over district-run publicschools. A 2015 Phi Delta Kappa/Gallup pollindicates that 64 percent of Americans favorcharter schools.2 And with high parentaldemand for charter schools, enrollment islikely to rise.3Charter schools are the fastest-growingchoice option in U.S. public education.Over the past five years, student enrollmentin charter public schools has grown by 62percent. In 43 states and the District ofColumbia, more than 2.9 million studentsnow attend charter schools —which is morethan six percent of the total number ofstudents enrolled in all public schools. Thenumber of districts with a major charterschool presence continues to grow, with 14districts now having 30 percent or more oftheir students enrolled in charter schools. Inmore than 160 districts, at least 10 percentof students attend charter public schools.The ten districts with the largest numbers ofcharter students enroll nearly one-quarterof all charter school students. Due to asuccessful track record of meeting students’specific needs, parental demand for charterpublic schools is at an all-time high.In some communities, the growth of charterpublic schools has been striking. In thedecade after Hurricane Katrina, the NewOrleans public school system rebuilt into analmost entirely public charter school system.In New York City, the number of charterstudents has quadrupled since 2008. Thenation’s capital also has a sizeable charterschool population, enrolling 44 percent ofDistrict of Columbia public school students.This rapid rate of growth should come asno surprise. For nearly 25 years, the charterpublic school movement has been a leaderin innovation and education reform. By2unleashing an environment of creativityin states and communities, charter publicschools have demonstrated that all childrenare capable of academic achievementthat prepares them to succeed in college,careers, and life. Charter schools have ledefforts to eliminate achievement gaps,boost graduation rates and revitalizecommunities.Beyond the raw number of students, thecharter schools with the top ten charterschool enrollment percentages are enrollingstudents from traditionally underservedbackgrounds. More than 80 percent of thestudents in the top ten highest-enrollmentshare districts qualify for free or reducedpriced lunch, while 86 percent are fromminority backgrounds.What’s more, the growth of charter publicschool enrollment can help improve theoverall quality of the public school system.The Center for Research on EducationOutcomes (CREDO) at Stanford Universityrecently conducted a study on thecompetitive effects of charter schools withinthe District of Columbia public schoolsystem. The researchers found that chartercompetition prompted the largest responsewhen the charter competitor quality isabove average and the district’s enrollmentis stable or declining.1For the past ten years, the National Alliancefor Public Charter Schools has trackedthe growth in charter public schoolIn this report, the National Alliance collectedpublic school enrollment data for the 2014–15 school year to identify communitiesacross the country where the highestproportions of students were enrolled incharter public schools. To calculate theseproportions, charter schools were mappedto public school districts based on theiraddress and the school district boundaries.This report compares the enrollment ofcharter public schools located in traditionalschool district boundaries with districtrun public school enrollment in the samedistricts, resulting in the “enrollment share”of charter public schools. It is importantto note that students sometimes leave thegeographic boundaries of the school districtin which they live to attend charter schools.However, the comparison between charterpublic schools and district-run publicschools serves as a proxy for where studentswho are enrolled in charter public schoolswould likely have enrolled if those schoolswere not available.Additional district- and school-level data canbe found on the National Alliance’s PublicCharter School Dashboard: .1Edward J. Cremata and Margaret E. Raymond. (March 1,2014). Competitive effects of charter schools: Evidence from theDistrict of Columbia. CREDO. Stanford University. r.pdf.2William J. Bushaw and Valerie J. Calderon. (2015). The 47thAnnual PDK/Gallup Poll of the Public’s Attitudes Toward thePublic Schools. 2015/10/pdkpoll47 2015.pdf.3Susan Pendergrass and Nora Kern. (2015). Waiting for TheirChance: A Closer Look at Wait Lists in Urban Public CharterSchools. 015/05/waitlist web.pdf.
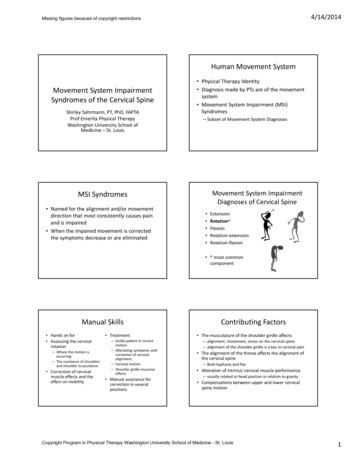
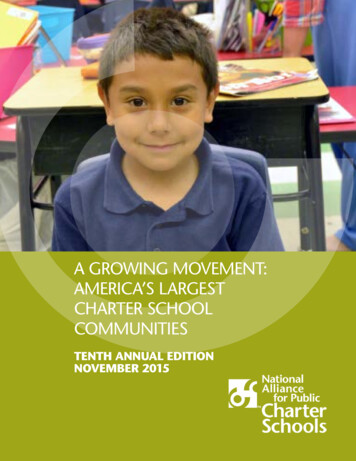
Districts with the HighestShare of Charter SchoolEnrollmentThe top ten districts in terms of enrollmentshare had at least 30 percent of studentsenrolled in charter public schools in 201415. When this report was first published tenyears ago, only one district—New Orleans,Louisiana—met this 30 percent benchmarkand just six public school districts had atleast 20 percent of their students enrolledin charter schools. In 2014-15, there were14 districts with at least 30 percent of theirstudents attending charters and 45 schooldistricts with a 20 percent enrollment shareor more. And, in more than 160 schooldistricts, at least ten percent of public schoolstudents attended charter public schools inthe past school year.New Orleans Remains Number One inMarket Share. Almost all public schoolstudents in New Orleans —93 percent—attended charter public schools in the2014–15 school year. Not only are charterschools in New Orleans serving a higherpercentage of public school students thananywhere else in the nation, but they havealso experienced substantial growth in theirperformance.4Michigan Has Three Districts in the TopTen Enrollment Share. Michigan has threeschool districts listed in the top ten highestpercentages of students enrolled in charterpublic schools, and two of those cities areamong the top five: Detroit ranked second(53 percent), Flint ranked third (47 percent),and Grand Rapids tied for ninth (31percent). In the first enrollment share reportthat the National Alliance released ten yearsago, Detroit tied for fifth (18 percent) andneither Flint nor Grand Rapids were in thetop ten.Six School Districts Have Reached atLeast 40 Percent Enrollment Share. Forthe first time, the share of public schoolstudents who attend charter public schoolshas reached more than 40 percent in KansasCity, Missouri and Gary, Indiana. Enrollmentshare in Kansas City has doubled in just tenyears. They join New Orleans, Louisiana,Washington, DC, Detroit, Michigan andFlint, Michigan.Forty-Five School Districts Have a MarketShare of 20 Percent or More. When theNational Alliance first began ranking schooldistricts, districts with an enrollment shareof 20 percent were tied for the fourthhighest position. The number of schooldistricts with at least a 20 percent marketshare has steadily climbed from six in 2005–06, to 18 in 2010–11, and now 45 in 201415. There are now more than 160 schooldistricts with at least a ten percent marketshare (see Appendix A).The following tables present charterpublic school enrollment as the highestpercentage of students enrolled (or highestenrollment share) as well as ten-year trendsin enrollment share.4The Cowen Institute for Public Education Initiatives. (2015).The State of Public Education in New Orleans: Ten Years AfterHurricane Katrina. New Orleans, LA: Author. http://www.speno2015.com/.THE HIGHEST PERCENTAGE OF PUBLIC CHARTER SCHOOL STUDENTS BY SCHOOL DISTRICT, 2014–15Rank12345678910School DistrictOrleans Parish School DistrictDetroit City School DistrictSchool District Of The City Of FlintDistrict Of Columbia Public SchoolsKansas City, Missouri School DistrictGary Community School CorporationThe School District of PhiladelphiaHall County SchoolsVictor Valley Union High School DistrictIndianapolis Public SchoolsGrand Rapids Public SchoolsDayton City School DistrictSan Antonio Independent School DistrictCleveland Municipal School 1%40%33%32%32%31%31%30%30%30%3
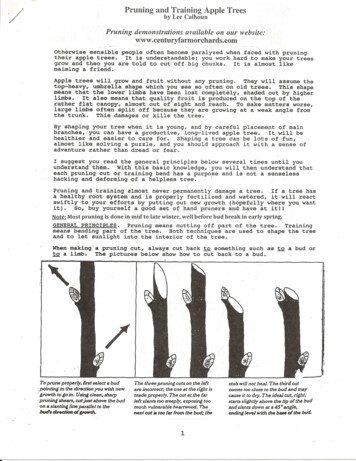
TRENDS IN ENROLLMENT FOR THOSE DISTRICTS WITH THE HIGHEST PERCENTAGE OF PUBLICSCHOOL STUDENTS IN terenrollmentEnrollmentshare2014-151OrleansParish 5%42,86093%2DetroitCity 1%52,42053%3SchoolDistrict OfThe City t OfColumbiaPublic 044%5Kansas IN-3,78023%4,83030%4,90035%5,01040%7The SchoolDistrict 4,09033%Hall CountySchoolsGA8,63032%8,20032%Victor ValleyUnion blic SchoolsIN-7,50018%9,24022%11,75028%13,83031%Grand RapidsPublic ty 30%San 1,570-27%17%-NOTE: Data in this table are from prior editions of this report. Missing data do not imply that there were no charter students in those years, only that the districtwas not included in the report.4
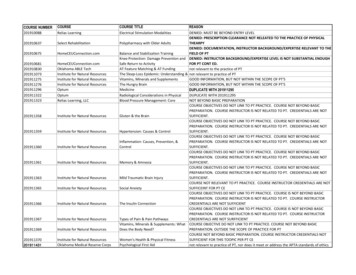
A Closer LookWashington, DCNINE-YEAR PUBLIC SCHOOL ENROLLMENT TREND IN WASHINGTON, DC,2006-07 THROUGH 2014-15StudentsWashington, DC has a thriving and highquality charter school movement. In fact,70,000Health of the Movement indicators in 2014and ninth in the model law rankings, whichmeasures the strength of the legislation thatdictates the parameters of how charter schoolscan operate within the state.5 While the charterschool enrollment share has increased from 25percent in 2005-06 to 44 percent in 201415, the district-run public schools have alsobegun retaining their students and actuallyexperienced a growth in enrollment last year.When the overall environment for charter anddistrict-run public schools is healthy, having ahigh proportion of students enrolled in charterschools can have a positive effect on a city.50,000Kansas City, MissouriLike many urban districts, Kansas City, Missourihas been experiencing a decline in its publicschool enrollment over the last decade.However, the decline is slowing. The numberof students attending charter schools increasedfrom about 6,500 in 2005-06 to nearly10,000 in 2014-15. With the declining overallenrollment, this has led to a doubling of KansasCity’s charter school enrollment share over thepast decade—from 20 percent to 41 percent.Los Angeles, Californiasecond-largest public school district in the US.As the charter movement has taken holdwithin the district, the number of studentsattending charter public schools has nearlytripled in just seven years and was over 150,000last year. Given the large size of LAUSD, charterpublic school students are just 23 percent oftotal 0-112011-122012-132013-142014-15TEN-YEAR PUBLIC SCHOOL ENROLLMENT TREND IN KANSAS CITY, MO,2005-06 THROUGH 15,00010,00020%20%20%5,0000%2005-06 2006-07 2007-08 2008-09 2009-10 2010-11 2011-12 2012-13 2013-14 2014-15SEVEN-YEAR PUBLIC SCHOOL ENROLLMENT TREND IN LOS ANGELES, CA2008-09 THROUGH ,00030%400,00023%20%300,000200,00010%9%Todd Ziebarth and Louann Bierlein Palmer. (2014). The Healthof the Public Charter School Movement: A State-By-State uploads/2014/09/health-of-the-movement-2014.pdf. And Ziebarth, Todd. (2015).Measuring Up to the Model: A Ranking of State Charter SchoolLaws. 015/01/model law 2015.pdf.5100,0000%2008-092009-10Charter Students2010-112011-122012-13Non-Charter Students2013-142014-15Enrollment Share5
Districts with the GreatestNumber of Charter SchoolStudentsLos Angeles Tops the List Again in Numberof Public Charter School Students. Morethan 150,000 students attended charterpublic schools in the Los Angeles UnifiedSchool District during the 2014–15 schoolyear—the highest number for any schooldistrict in the country. In fact, the charterschool enrollment for Los Angeles is morethan double that of Philadelphia, the thirdhighest charter school student enrollment(64,090). The number of students enrolledin public charter schools in Los Angeles alonewould place Los Angeles charter schools inthe top 15 of the 100 largest school districtsin the United States.6 Charter public schoolsin Los Angeles enrolled over 12,000 morestudents in 2014–15 than in 2013–14—agrowth rate of nine percent.City public school district has grown fromjust over 20,000 to nearly 85,000.Ten Districts with the Largest Numbersof Charter Students Enroll Nearly OneQuarter of All Charter School Students.The ten districts with the largest number ofstudents in charter public schools represent22 percent of the total charter public schoolpopulation nationwide—a total of nearly640,000 students out of roughly 2.9 million.Between the 2013–14 and 2014–15 schoolyears, the top ten districts increased charterpublic school enrollment by approximately38,000 students—a growth rate of sixpercent.Seven School Districts Have Reached atLeast 50,000 Charter School Enrollment.For the first time, the number of publicschool students who attend charter publicschools has reached more than 50,000 inLos Angeles, New York City, Philadelphia,Chicago, Miami-Dade, Detroit, andHouston.The Number of Charter School Studentsin New York City Has Quadrupled Since2008. In the last six years, the number ofcharter school students in the New YorkThe following tables present charter publicschool enrollment as the highest number ofstudents enrolled, as well as ten-year trendsin enrollment numbers.6U.S. Department of Education, National Center for EducationStatistics. (2013). Common core of data: Local education agency(school district) universe survey data, 2011-2012. Washington,DC: Author. http://nces.ed.gov/programs/digest/d13/tables/dt13 215.30.asp.THE HIGHEST NUMBER OF PUBLIC CHARTER SCHOOL STUDENTS BY SCHOOL DISTRICT, 2014–156RankSchool 45678910Los Angeles Unified School DistrictNew York City Department of EducationThe School District of PhiladelphiaChicago Public SchoolsMiami-Dade County Public SchoolsDetroit City School DistrictHouston Independent School DistrictNew Orleans Public School SystemBroward County Public SchoolsDistrict of Columbia Public are23%8%33%14%16%53%21%93%16%44%
TEN-YEAR TRENDS HIGHEST NUMBER OF CHARTER PUBLIC SCHOOL STUDENTS BY SCHOOL DISTRICT,2006-07 THROUGH harterstudentsNoncharterstudents2014-151Los 0588,820120,960534,610151,310501,3502NewYork CityDepartmentof 5084,310983,7003The SchoolDistrict 2,03047,570306,67055,590301,3106DetroitCity 08OrleansParish ict 79,380117,600-11,340-55,160NOTE: Data in this table are from prior editions of this report. Missing data do not imply that there were no charter students in those years, only that the districtwas not included in the report.7
TOP TEN SCHOOL DISTRICTS FOR CHARTER SCHOOLENROLLMENT SHARE AND ENROLLMENT2014–2015 SCHOOL YEARSchool DistrictLos AngelesVictor ValleyDistrict of ColumbiaBrowardMiami-DadeHall CountyChicagoGaryIndianapolisNew OrleansDetroitFlintGrand RapidsKansas CityNew YorkClevelandDaytonPhiladelphiaHoustonSan TXCharter EnrollmentShare23%32% (#8, tied)44% (#4)16%16%32% (#8, tied)14%40% (#6)31% (#9, tied)93% (#1)53% (#2)47% (#3)31% (#9, tied)41% (#5)8%30% (#10, tied)30% (#10, tied)33% (#7)21%30% (#10, tied)Number of CharterSchool Students151,310 (#1)4,39037,680 (#10)41,550 (#9)55,590 (#5)8,20057,520 (#4)5,01013,83042,860 (#8)52,420 (#6)5,6606,9009,98084,310 (#2)16,2206,22064,090 (#3)51,400 (#7)17,000KEYMarket ShareSource: A Growing Movement: America’s Largest Charter School Communities. http://publiccharters.org/publication/?id 902Enrollment(#)RankNo charter school laws in 2014 -2015
Notes about Methodology1. In this analysis, the National Allianceexamined enrollment share in schooldistricts with more than 10,000 publicschool students (both charter and noncharter) in the 2014–15 school year. TheNational Alliance gathered charter andnon-charter public school enrollmentdata from state department of educationdatabases and personnel.2. More than 50 percent of charter schoolsnationwide are their own independentlocal education agencies (LEAs), ratherthan being part of traditional publicschool district LEAs. In the past, this factmeant that it was not always clear whichpublic school district charter schoolswere physically located in, especially forcharter schools in large metropolitan citieswith more than one school district (e.g.,Phoenix, Arizona, and Houston, Texas).For the five most recent editions of themarket share report, the National Allianceused a geocoding method to identify thegeographically relevant school districts for9each charter more accurately. Specifically,the National Alliance geocoded everycharter school that is an independent LEAto the geographically relevant traditionalpublic school district LEA by mappingcharter school addresses onto schooldistrict boundary maps available throughthe U.S. Census Bureau.3. For Michigan, the National Allianceused student residential enrollment datathat indicate the total number of studentsattending charter schools based onthe district where students reside. Thestudent residence enrollment data presentinformation regarding how many studentsfrom a school district attend charterschools. Some students may attend charterschools outside of their traditional districtboundaries. 2013-14 data for Detroit,Michigan and Cleveland, Ohio have beenrevised to remove computational errors.4. The growing number of virtual charterschools enrolling children from across anentire state presents an issue. Becausemany states haven’t developed studentenrollment reporting systems that allow forsorting individual students by communityof residence at each charter school, theNational Alliance excluded virtual schoolenrollment data from both the charterand total district enrollment data whencalculating market share percentages. Thisdecision might create some undercountingin school districts where large numbersof students are enrolled in virtual charterschools. The National Alliance codedvirtual schools according to a nationwidelist gathered from state department ofeducation databases and personnel. TheNational Alliance does include enrollmentfrom virtual schools in the District ofColumbia and Hawaii, where there is onlyone school district in the state, and fromDelaware, Michigan, and Ohio, where theNational Alliance has resident enrollmentdata and knows the district where studentslive.
APPENDIX ASCHOOL DISTRICTS WITH AT LEAST 10 PERCENT ENROLLMENT SHARE, entTotalEnrollmentShare1Orleans Parish School DistrictLA42,8583,34446,20293%2Detroit City School District (82010)MI52,42147,03699,45753%3Flint, School District Of The City Of (25010)MI5,6646,48612,15047%4District Of Columbia Public SchoolsDC37,68447,54885,23244%5Kansas City, Missouri School DistrictMO9,97914,22924,20841%6Gary Community School CorporationIN5,0127,56612,57840%7The School District of 516171819202110District NameHall County SchoolsGA8,20317,07625,27932%Victor Valley Union High School DistrictCA4,3859,50413,88932%Indianapolis Public SchoolsIN13,82530,09743,92231%Grand Rapids Public Schools (41010)MI6,89815,61122,50931%Dayton City School DistrictOH6,22214,21520,43730%San Antonio Independent School DistrictTX17,00140,45357,45430%Cleveland Municipal School DistrictOH16,21938,72954,94830%Natomas Unified School DistrictCA3,9669,65013,61629%Newark Public SchoolsNJ12,74031,98444,72428%Toledo City School DistrictOH8,69321,86030,55328%Saint Louis Public SchoolsMO9,57124,15433,72528%Camden City School DistrictNJ4,32411,16415,48828%Roosevelt School District 66AZ3,7009,61413,31428%Gilbert Unified DistrictAZ13,74437,24650,99027%Oakland Unified School DistrictCA13,13736,95950,09626%Albany City School DistrictNY3,0348,53711,57126%Inglewood Unified School DistrictCA3,4169,94513,36126%Franklin-Mckinley School DistrictCA2,8538,34011,19325%Manor Independent School DistrictTX2,9698,85211,82125%Columbus City School DistrictOH16,89450,40767,30125%Greeley School District 6CO5,21016,03221,24225%Los Angeles Unified School DistrictCA151,311501,345652,65623%Saint Paul Public SchoolsMN11,17437,86549,03923%Twin Rivers Unified School DistrictCA7,03423,93630,97023%Milwaukee Public SchoolsWI17,32659,49276,81823%Flagstaff Unified School DistrictAZ2,8369,79012,62622%Chula Vista Elementary School DistrictCA6,80523,71030,51522%Alhambra Elementary DistrictAZ3,95913,92817,88722%East Central Independent School DistrictTX2,7629,83412,59622%Baldwin Park Unified School DistrictCA3,97714,27618,25322%Phoenix Union High School DistrictAZ7,33326,81834,15121%Minneapolis Public SchoolsMN9,92236,40446,32621%Brighton 27J School DistrictCO3,63813,46517,10321%Grossmont Union High School DistrictCA4,64017,49722,13721%Houston Independent School DistrictTX51,395196,192247,58721%Adelanto ElementaryCA2,1358,20810,34321%Parma City School DistrictOH2,70611,00013,70620%Falcon School District 49CO3,20013,09316,29320%Tucson Unified School DistrictAZ11,66249,01560,67719%Buffalo City School DistrictNY8,04934,11142,16019%Amphitheater Public SchoolsAZ3,17313,81716,99019%Dysart Unified School DistrictAZ5,31323,14628,45919%Christina School DistrictDE3,70016,25519,95519%Chico Unified School DistrictCA2,67011,74414,41419%Stockton Unified School DistrictCA7,81034,45842,26818%Effingham CountyGA2,2149,79312,00718%Cincinnati City School DistrictOH7,34532,65039,99518%Rocklin Unified School DistrictCA2,48711,06113,54818%
212223242526District lEnrollmentShareSan Juan Unified School DistrictCA8,96940,03249,00118%Harrison School District TwoCO2,0549,38711,44118%Ogden School DistrictUT2,22410,24412,46818%West Chester Area School DistrictPA2,51911,61814,13718%Yuma School District OneAZ1,8969,00910,90517%Paradise Valley Unified School DistrictAZ5,43826,27131,70917%Colorado Springs School District 11CO5,39526,08631,48117%Boston School DistrictMA11,15554,31265,46717%Baltimore City Public SchoolsMD14,11869,81283,93017%Denver Public SchoolsCO14,76073,44688,20617%Rutherford County SchoolsNC1,6758,36810,04317%San Diego Unified School DistrictCA21,603108,768130,37117%Lansing Public School District (33020)MI2,28011,51313,79317%Northglenn-Thornton School District 12CO6,95835,71042,66816%William S. Hart Union High School DistrictCA4,31622,57926,89516%Sacramento City Unified School DistrictCA7,67340,70048,37316%Atlanta City School DistrictGA8,13743,83851,97516%Deer Valley Unified School DistrictAZ6,36534,36540,73016%Miami-Dade County Public SchoolsFL55,592301,310356,90216%Broward County Public SchoolsFL41,554225,300266,85416%Trenton Public School DistrictNJ2,06211,18313,24516%15%Dallas Independent School DistrictTX29,046159,666188,712Glendale Union High School DistrictAZ2,71315,25417,96715%Duluth Public SchoolsMN1,5458,81910,36415%Douglas County School DistrictCO9,47054,88764,35715%Sarasota County SchoolsFL6,15035,75941,90915%Port Huron Area School District (74010)MI1,5339,10010,63314%Carrollton-Farmers Branch Independent School DistrictTX4,28225,91230,19414%Weslaco Independent School DistrictTX2,85317,38720,24014%Menifee Union School DistrictCA1,5479,45411,00114%Jersey City Public SchoolsNJ4,51727,81032,32714%Appleton Area School DistrictWI2,33214,37416,70614%Colonial School DistrictDE1,5929,82511,41714%Chicago Public SchoolsIL57,519355,775413,29414%Durham Public SchoolsNC5,42933,64739,07614%Sanger Unified School DistrictCA1,5549,65011,20414%Alameda Unified School DistrictCA1,5219,47010,99114%Scottsdale Unified DistrictAZ3,89024,45128,34114%Kentwood Public Schools (41160)MI1,3858,72610,11114%Mesa Unified DistrictAZ10,21264,53274,74414%Albuquerque Public SchoolsNM13,74787,040100,78714%Lee County Public SchoolsFL12,17577,19289,36714%Salt Lake City School DistrictUT3,19420,27823,47214%Academy School District 20CO3,27120,81024,08114%Bay District SchoolsFL3,72523,83627,56114%Pulaski County Special School DistrictAR2,59216,59219,18414%Little Rock School DistrictAR3,54022,78026,32013%Lewisville Independent School DistrictTX8,24153,35661,59713%Lincoln County SchoolsNC1,79011,62513,41513%Oklahoma City Public SchoolsOK5,92938,54944,47813%School District Of Osceola CountyFL7,88851,48859,37613%Wayne-Westland Community School District (82160)MI1,77811,69013,46813%Alum Rock Union Elementary School DistrictCA1,65310,89612,54913%Pharr-San Juan-Alamo Independent School DistrictTX4,82532,28837,11313%Weber School DistrictUT3,79925,69429,49313%Vista Unified School DistrictCA3,24922,09425,34313%Bethlehem Area School DistrictPA2,00513,68115,68613%APPENDIX ARank11
APPENDIX ASCHOOL DISTRICTS WITH AT LEAST 10 PERCENT ENROLLMENT SHARE, 2014-15(continued)Rank2627282912District lEnrollmentShareVacaville Unified School DistrictCA1,63711,17512,812Jordan School DistrictUT7,77553,23461,00913%13%Duncanville Independent School DistrictTX1,87412,94514,81913%Lake County SchoolsFL5,31736,79942,11613%School District Of Manatee CountyFL6,00941,83947,84813%Aurora Public SchoolsCO5,40637,75943,16513%Palmdale School DistrictCA2,70919,24721,95612%Polk County Public SchoolsFL12,27487,45299,72612%Santa Fe Public SchoolsNM1,84613,20115,04712%12%Traverse City Area Public Schools (28010)MI1,3529,70111,053School District Of Indian River CountyFL2,20415,87318,07712%East Baton Rouge Parish School SystemLA5,48939,58845,07712%Waco Independent School DistrictTX2,04714,97817,02512%Sunnyside Unified School DistrictAZ2,29517,18419,47912%West Covina Unified School DistrictCA1,2289,21910,44712%Nampa School DistrictID1,98314,89216,87512%Rochester City School DistrictNY3,86029,30133,16112%Donna Independent School DistrictTX2,00215,28717,28912%Akron City School DistrictOH2,74521,03023,77512%Washington County School DistrictUT3,09223,74526,83712%East Side Union High School DistrictCA3,07523,62826,70312%Providence School DistrictRI2,98523,06426,04911%Kyrene Elementary DistrictAZ2,24417,64219,88611%San Benito Consolidated Independent School DistrictTX1,40111,02412,42511%Poudre School DistrictCO3,40126,91030,31111%St. Vrain Valley School DistrictCO3,48527,59131,07611%Plymouth-Canton Community Schools (82100)MI2,18517,35619,54111%Tempe Union High School DistrictAZ1,75413,95915,71311%Nebo School DistrictUT3,44827,63031,07811%Newton County SchoolsGA2,17517,47619,65111%Escondido Union School DistrictCA2,12417,08019,20411%Liberty County School DistrictGA1,1118,96610,07711%Brandywine School DistrictDE1,33010,74012,07011%Pittsburgh School DistrictPA3,00224,24927,25111%Georgetown Independent School DistrictTX1,31310,64511,95811%San Jacinto Unified School DistrictCA1,1709,51310,68311%Monterey Peninsula Unified School DistrictCA1,1929,80110,99311%Livermore Valley Joint Unified School DistrictCA1,51912,50914,02811%Lake Central School CorporationIN1,1589,63310,79111%Tooele School DistrictUT1,53512,87314,40811%Canyons School DistrictUT3,99233,72437,71611%Austin Independent School DistrictTX9,90183,78993,69011%San Jose Unified School DistrictCA3,72431,62835,35211%Medford School District 549COR1,42512,20313,62810%School District Of Palm Beach CountyFL19,180167,277186,45710%Pajaro Valley Unified School DistrictCA2,09718,34
system. The researchers found that charter competition prompted the largest response when the charter competitor quality is above average and the district's enrollment is stable or declining.1 For the past ten years, the National Alliance for Public Charter Schools has tracked the growth in charter public school student enrollment.