Transcription
NBER WORKING PAPER SERIESIS THE SUPPLY OF CHARITABLE DONATIONS FIXED?EVIDENCE FROM DEADLY TORNADOESTatyana DeryuginaBenjamin M. MarxWorking Paper 27078http://www.nber.org/papers/w27078NATIONAL BUREAU OF ECONOMIC RESEARCH1050 Massachusetts AvenueCambridge, MA 02138May 2020We thank the Lilly Family School of Philanthropy for financial support. We thank Yuci Chen,Arash Farahani, Chitra Jogani, and Dana Shaat for excellent research assistance. We thank MajaAdena, Wojciech Kopczuk, Rob McClelland, Una Osili, Mark Ottoni-Wilhelm, Sarah Smith;seminar participants at Drexel University and the University of Illinois; and participants at the2016 ASSA meetings, the 2016 ARNOVA Conference, the 2018 Science of PhilanthropyInitiative Conference, the 2018 National Tax Association Annual Conference, and the 2020 MidMidwest Applied Microeconomics Workshop for their helpful comments. The views expressedherein are those of the authors and do not necessarily reflect the views of the National Bureau ofEconomic Research.NBER working papers are circulated for discussion and comment purposes. They have not beenpeer-reviewed or been subject to the review by the NBER Board of Directors that accompaniesofficial NBER publications. 2020 by Tatyana Deryugina and Benjamin M. Marx. All rights reserved. Short sections of text,not to exceed two paragraphs, may be quoted without explicit permission provided that fullcredit, including notice, is given to the source.
Is the Supply of Charitable Donations Fixed? Evidence from Deadly TornadoesTatyana Deryugina and Benjamin M. MarxNBER Working Paper No. 27078May 2020JEL No. D64,L31,Q54ABSTRACTDo new societal needs increase charitable giving or simply reallocate a fixed supply ofdonations? We study this question using IRS datasets and the natural experiment ofdeadly tornadoes. Among ZIP Codes located more than 20 miles away from a tornado's path,donations by households increase by over 1 million per tornado fatality. We find no negativeeffects on charities located in these ZIP Codes, with a bootstrapped confidence intervalthat rejects substitution rates above 16 percent. The results imply that giving to one cause neednot come at the expense of another.Tatyana DeryuginaDepartment of FinanceUniversity of Illinois at Urbana-Champaign515 East Gregory Drive, MC-520Champaign, IL 61820and NBERderyugin@illinois.eduBenjamin M. MarxDepartment of EconomicsUniversity of Illinois at Urbana-Champaign214 David Kinley Hall, 1407 W. GregoryUrbana, IL 61801benmarx@illinois.edu
1IntroductionCharitable donations are an important source of funding for many public goods. Forexample, U.S. charitable giving makes up about 2 percent of GDP (List, 2011). Devolvedfunding responsibility creates costly competition for such funds, though, prompting manyto ask whether charitable solicitations increase total giving or simply displace donationsthat would have gone to other causes. Indeed, the ratio of charitable donations to incomehas been fairly constant over time (Andreoni and Payne, 2013) and across income categories (Meer and Priday, 2020), and many laboratory experiments find that incentives todonate to one of a set of charities reduces giving to the others.1 However, there are noestimates of such displacement effects that identify causal effects among a broad set ofcauses and a large share of annual donations.We estimate whether exogenous increases in demand for donations created by fataltornadoes—which vary over both space and time but are generally limited in their geographic scope—reduce other donations. Using ZIP-Code-level individual income taxdata from the Internal Revenue Service (IRS), which include all income tax deductionsclaimed for donations to any registered charity, we find that lethal tornadoes significantlyincrease total charitable donations by individuals. In particular, conditional on a host offixed effects, a tornado fatality increases total donations by more than 1 million from individuals living in ZIP Codes located 20–100 miles away from a tornado’s path. Becausetotal giving increases, we can rule out perfect substitution between charitable causes andconclude that the supply of donations is not fixed.We then test whether some donations made by donors in the areas surrounding atornado’s path come at the expense of these donors’ local charities. To do so, we usedata from information returns that charities file annually with the IRS. We show thatcontributions received by charities within 20 miles of a tornado’s path increase by more1 See,for example, Reinstein (2012); Cairns and Slonim (2011); Reinstein (2011); Corazzini et al. (2015);Ek (2017); Filiz-Ozbay and Uler (2017); Deck and Murphy (2019); Harwell et al. (2020); Schmitz (2019).2
than 1 million. We then turn to our main question by testing for negative displacementeffects on charities located more than 20 miles away. We find no statistically significanteffects. The lack of effects cannot be attributed to insufficient precision, as we demonstrateby bootstrapping the ratio of the effects on local charities to the effects on total donations.The 95-percent confidence interval from our bootstrapping exercise rules out substitutionfrom other charities in excess of 16 percent of the transfer to tornado victims. Finally, weuse machine-learning methods to estimate treatment-effect heterogeneity among donors’local charities. We find no predictable negative effects on any particular types of charities.Our study contributes to an active debate on the extent to which individuals substitutedonations to one charity for donations to another.2 In theory, increases in the numberof charities or in the number of people served by a charity have ambiguously signedeffects on donations (Rose-Ackerman, 1982, 1987). The supply of donations could also becompletely fixed if giving exhibits “mental accounting” (Tversky and Kahneman, 1981;Kahneman and Tversky, 1984; Thaler, 1985, 1999). Field-study findings differ regardingwhether intertemporal displacement does (Landry et al., 2010)) or does not occur (Landryet al., 2010; Bekkers, 2015)) and whether displacement between causes does (Chatterjee etal., 2020) or does not occur (Meer, 2017).3 In a review of this literature, Gee and Meer(2019) conclude that “the evidence is decidedly mixed on whether the altruism budget isfixed or flexible.”Our paper addresses the question of substitution in giving with an unparalleled combination of strong internal validity and broad coverage of donors and causes.4 Studies of2 Research has also provided highly credible experimental evidence about factors that increase charitablegiving to a particular cause. Prominent examples include (List and Lucking-Reiley, 2002; Landry et al., 2006;Karlan and List, 2007; Shang and Croson, 2009; Huck and Rasul, 2011; DellaVigna et al., 2012; Garbarino etal., 2013; Huck et al., 2015; and Andreoni et al., 2017.3 Petrova et al. (2020) find substitution between political giving and charitable giving, and Lacetera et al.(2012) find that incentives to give blood in one location reduce giving in other locations. Adena and Hager(2020) find marginally significant displacement between related causes.4 Our use of individual income tax data follows the literature on the tax-price elasticity of charitablegiving (Randolph, 1995; Auten et al., 2002; Bakija et al., 2003; Bakija and Heim, 2011). Our use of theinformation returns that nonprofit organizations file with the government follows studies estimating theeffects of government grants on charities’ fundraising efforts (Andreoni and Payne, 2003, 2011).3
giving to international disasters (e.g. Brown and Minty, 2008; Scharf et al., 2017) have necessarily relied on time-series variation because there is no untreated control group at anypoint in time, whereas the local nature of tornadoes allows us to define treatment andcontrol groups and estimate relative changes among the treated. Experimental studiesprovide strong internal validity but have estimated substitution patterns only between asmall set of charities. Experimental estimates may also not generalize if patterns of donating from an experimental endowment differ from patterns of donations from generalincome (Cherry et al., 2002; Reinstein and Riener, 2012; Carlsson et al., 2013; Drouveliset al., 2019) or if subjects are induced to adjust the donations they make outside of theexperiment. In contrast, we observe donations to the full spectrum of causes, allowing usto detect a wide variety of substitution patterns, if they exist. Our paper is the first to employ datasets that contain the majority of dollars donated across the U.S. and the first toidentify effects using a natural experiment with both geographic and temporal variation.We also contribute to the empirical literature on financial assistance in the aftermathof natural disasters. Charitable giving for natural disasters is common, with a nationally representative survey indicating that about 30 percent of U.S. households made suchdonations in each of 2017 and 2018 (Bergdoll et al., 2019). Nearly 80 percent of thesehouseholds claim that their disaster giving did not affect their giving to other causes,but survey respondents may be reluctant to admit that they reduced charitable givingto other causes. Yet much of the literature focuses on the determinants of domestic orforeign disaster aid (e.g. Besley and Burgess, 2002; Garrett and Sobel, 2003; Drury et al.,2005; Eisensee and Strömberg, 2007; Strömberg, 2007; Healy and Malhotra, 2009; Cole etal., 2012; Deryugina and Kirwan, 2018). To the best of our knowledge, our paper is thefirst to quantify the charitable response to tornadoes and the first to quantify donationsfor any type of disaster using administrative data.5The rest of the paper is organized as follows. In Section 2 we describe our data. In5 Fongand Luttmer (2009) study donations to victims of Hurricane Katrina in an experimental setting.4
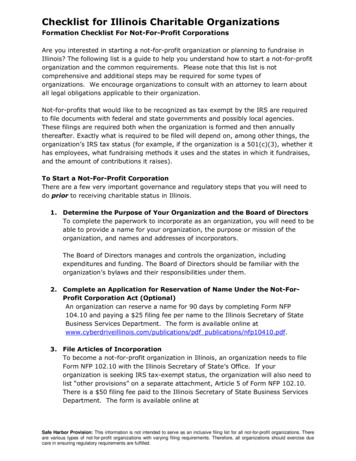
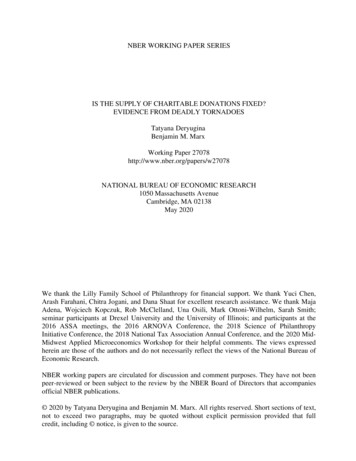
Section 3 we lay out our empirical strategy for estimating the effects of tornadoes nearthe locations in which they strike and in locations that are further away. In Section 4 wereport our results. We conclude in Section 5.2Data2.1TornadoesTornadoes are rotating columns of air that form during strong thunderstorms. Winds canreach up to 300 miles per hour, causing catastrophic damage to structures with whicha tornado comes in contact. Tornadoes are common in the U.S., but most are local andshort-lived, have much weaker winds, and do not harm people or buildings. While themajority of tornadoes affect regions of the South and Midwest known as “Tornado Alley,”tornadoes have been observed in every U.S. state.Our data on tornadoes come from the National Oceanic and Atmospheric Administration’s (NOAA) Tornado Database, which tracks the path of every known tornado since1950.6 In addition to providing the starting and ending coordinates of each tornado alongwith the date and time when it occurred, the database contains the number of reported fatalities and injuries for each tornado. We use the number of fatalities to identify tornadoesthat are likely to generate a charitable giving response.7Figure 1 displays the paths of every tornado that formed in 2002–2017 and causedat least one fatality. It also displays the total number of fatalities by state. Three keypatterns emerge. First, fatal tornado strikes are concentrated in the Midwest and theSouth. Second, deadly tornadoes have struck across a wide range of most of the states inwhich they have occurred. Third, tornadoes are local events, with even the most lethal6 Availablefrom http://www.spc.noaa.gov/wcm/#data.7 The database also provides estimates of damage, but these are very imprecise and are thus much noisiermeasures of severity than fatalities. For example, uncertain damage is recorded as zero damage and there isno way to distinguish it from true zeroes. While injuries may also indicate severity, no distinction is madebetween minor and major injuries, making them less comparable to each other than fatalities.5
rarely passing through more than a handful of counties. Appendix Figure A.1 shows thattornado casualties occur throughout the year but are most prevalent in April and May.80 99061-6031-0130Figure 1: Fatal tornadoes in the United States, 2002–2017Source: NOAA. Black markers represent tornadoes that occurred in 2002–2017 and caused at least onefatality. Colors represent total tornado-caused fatalities in a state during the period 2002–2017.2.2Income tax data on charitable donations to all causesAnnual data on charitable donations come from the IRS.9 The data are based on individual income tax returns, including all Forms 1040, 1040A, and 1040EZ. They reportdeductions claimed for charitable donations in 2002 and in 2004–2017. Returns are compiled by filing year, providing totals based mostly on the preceding tax year but includingsome late returns for the previous tax year. Data are aggregated by the ZIP Code listed8 Scharfet al. (2017) find that natural disasters have short-run time-shifting effects on donations to othercharities but find no net effect over a 20-week period. That most deadly tornadoes occur in first half of theyear therefore suggests that our estimates using annual data should capture full net effects.9 Available from idual-income-tax-statistics-zip-codedata-soi.6
on the return, which is usually the ZIP Code of the taxpayer’s home address but couldalternatively be the address of a lawyer, accountant, or place of business.The IRS has taken varying steps to avoid disclosure of information about individualtaxpayers. ZIP Codes with fewer than a threshold number of returns (ten returns in mostyears) were excluded. We restrict our sample in all years to satisfy the most stringentthreshold of at least 250 returns.The main variable of interest is the total amount of charitable contributions claimedfor tax deductions. We also make use of the number of tax returns that include suchdeductions, the total number of returns, and total Adjusted Gross Income (AGI). BecauseIRS disclosure rules prevent us from distinguishing true zeroes in the data from censoredvalues, we restrict the sample to ZIP Codes for which charitable contributions are alwaysstrictly positive.2.3IRS Form 990 data on receipts of charitiesThe data for charities have been collected by the IRS using Form 990, the annual information return that most charities are required to file.10 Data are available for the years1998–2016, but we drop years prior to 2002 for comparability with the individual incometax data. Our main variable of interest is contributions, which is the sum of donationsfrom individuals, gifts, and grants.These data are known to contain many duplicates. Therefore, we keep only one entrywhen we find matches on the Employer Identification Number (EIN) and fiscal year thatalso match on any of assets, contributions, expenses, or gross receipts. Whenever thefinancial variables disagree in such cases, we keep the entry from the most recent datafile. We also address location discrepancies that are likely to be errors. If a charity’s ZIPCode in year t 1 matches that in year t 1 but not in year t, we replace the ZIP Codein period t so that it is consistent over time. We then replace the ZIP Code with our time10 Weobtain the data from the Urban Institute (https://nccs-data.urban.org/data.php?ds core).7
invariant “super-ZIP”, which we discuss below. Finally, we replace the reported statewith the state to which the super-ZIP belongs using the 2010 Esri ZIP Code centroids file.We also address likely reporting errors. First, we drop observations with reportedgross receipts (i.e. contributions) that are zero or negative. We also determine each organization’s maximum absolute-value year-over-year change in log contributions, andwe drop the one percent of organizations that exhibit the largest changes. This step addresses reporting errors such as reporting in thousands of dollars instead of dollars orwriting values on the wrong line of the form.Because the fiscal cycles of public charities do not always overlap with calendar years,we match the tornado data to each charity’s fiscal cycle by month and ZIP Code and thenaggregate to the annual level using the year in which the fiscal year ends.2.4ZIP CodesOur geographic unit of analysis is a ZIP Code Tabulation Area (ZCTA). ZCTAs are atrademark of the U.S. Census Bureau and provide a spatial representation of the mailingareas covered by ZIP Codes.11 Hereafter, we simply refer to ZCTAs as ZIP Codes. For thelatitudes and longitudes of their locations, we use the 2010 Esri ZIP Code centroids file,which corresponds to the median year in our donations data.We use data from the U.S. Postal Service to account for changes in the coverage of ZIPCodes over time. Each month, the USPS produces a Postal Bulletin that includes a tableof changes to ZIP Code delivery areas.12 The most common changes are creations of newZIP Codes for part of an area previously covered by another ZIP Code and eliminationof ZIP Codes when a post office is closed. Each change reports two ZIP Codes, whichwe combine with each other and with all other ZIP Codes to which they are connected11 eys/geography/guidance/geoareas/zctas.html.12 Postal Bulletins are available for download at https://postalpro.usps.com/postal-bulletin-changes stalbulletinchanges print.htm.8
through one or more changes, to create a set of time-invariant “super-ZIPs.” We aggregateour other datasets to the super-ZIP level by summing all financial variables over the ZIPCodes included in the super-ZIP. For the latitude and longitude of a super-ZIP we takethe average of the values of the included ZIP Codes, a simplification that suffices for ourdesigns, which do not require that we distinguish between distances of less than 10 miles.Hereafter, we simply refer to these super-ZIPs as ZIP Codes.We calculate the distance between ZIP Codes and tornadoes using latitude and longitude. These coordinates are available for both the start point and end point of eachtornado. We therefore calculate the shortest distance, in miles, between each ZIP Codeand the line segment connecting the starting and ending points of the tornado.13 Thiswill create some degree of mismeasurement because tornadoes do not necessarily travelin straight lines, but our design does not depend on finely measured distances. Similarly,we do not know the exact locations of fatalities, but we can sum all fatalities caused bytornadoes that passed within a range of distances, such as between 10 and 20 miles froma given ZIP Code.142.5Summary statisticsTable 1 provides summary statistics for each of our main datasets. Panel A displays statistics for deadly tornadoes in the United States that occurred between 2002 and 2017. Onaverage, a fatal tornado injured 34 people and caused property damage of almost 1.2million dollars. Tornado severity varies considerably; the worst tornado in our sampleperiod killed 158 people, but the median lethal tornado killed two people.Panel B of Table 1 shows summary statistics for the individual income tax data at theZIP-Code-year level. Each observation includes at least 250 tax returns, reflecting the13 Moreprecisely, we create 1,000 points between the start and end points of the tornado and use theminimum of the distances between these points and a ZIP Code centroid.14 Fatalities are reported at the tornado level. If a tornado affects multiple states, we divide fatalitiesequally among the affected states (usually two). In some cases, this yields fractional fatalities.9
Table 1: Summary statisticsMeanStd.Dev.Min.MedianMax.NPanel A: Fatal tornadoesInjuriesFatalitiesProperty damage (mill.)Crop losses el B: Income tax dataReturns filed (thous.)No. of returns with charitable donations (thous.)Charitable donations (mill.)Charitable donations per return (thous.)Adjust Gross Income per return lities, 0-20 milesFatalities, 20-100 milesIn-state fatalities, 20-100 milesIn-state fatalities, 20 000-1580Panel C: Charities dataContributions received (mill.)Total revenue (mill.)Total expenses (mill.)Fatalities, 0-20 milesFatalities, 20-100 milesIn-state fatalities, 20-100 milesIn-state fatalities, 20 2833,228,2833,228,2833,228,2833,228,283Notes: Sources are the National Oceanic and Atmospheric Administration’s Tornado Database, theInternal Revenue Service, and the National Center for Charitable Statistics. Unit of observation in panel Ais a tornado. Unit of observation in panel B is ZIP-Code-year. Unit of observation in Panel C is EIN-year.Dollar values are inflation-adjusted to 2017 dollars. Panel A includes years 2002–2017. Panel B includesyears 2002 and 2004–2017. Panel C includes years 2002–201610
sample restriction, and covers over 5,000 returns on average. When observed, the number of returns with charitable donations was roughly one quarter of the total number ofreturns.15 On a per-return basis, charitable donations average about 1,000, or roughly 2percent of the average income of 55,000, consistent with the common finding that charitable giving accounts for 2 percent of income in the U.S. (e.g. Andreoni and Payne 2013).On average, there are about 1.3 fatalities caused by tornadoes that struck within 100 milesof ZIP Codes for which we have income tax data and another 1.3 caused by tornadoesthat struck other parts of the state that are at least 100 miles away.Panel C of Table 1 displays summary statistics for charity-year observations. Contributions exceed 1 million on average but are closer to 100,000 at the median. Total revenues, which include contributions, are several times larger than contributions and arehighly variable across observations. Expenses are roughly 70 to 80 percent of revenues.The mean values of the tornado variables are slightly smaller than the means displayedin Panel B, indicating that the average charity is located in an area near somewhat fewerserious tornadoes than the average taxpayer, though they also experience an average ofone fatality per year caused by tornadoes passing within 100 miles.3Empirical strategy3.1Conceptual frameworkThe IRS collects data on the amount of charitable donations but not the causes to whichhouseholds give. This makes it impossible to test how tornadoes affect giving from particular households to particular causes. For areas that are not themselves struck by tornadoes, though, the two IRS datasets described above allow us to recover the share oftornado-related donations that would have been made to other causes if not for a deadly15 Whethera return claims any charitable deductions was not reported in 2008.11
tornado.16Consider individuals in location j. Denote by Fj the number of tornado fatalities occurring within a distance band of that location, such as 20–100 miles. Individuals in j give an amount j Fj to local charities in or near j and give n j Fj to national charities andcharities in the locations of tornado victims. Denote the effects of one additional tornado fatality as 4 j : j Fj 1 j Fj and 4n j : n j Fj 1 n j Fj .In the income-tax data, we observe donations from households in j to all causes, allowing us to estimate 4 j 4n j . In the information returns filed by charities, we observe donations to charities located in j, which will include j Fj and possibly donations fromindividuals in other locations k 6 j. We assume that if location j is far enough from atornado such that its local charities are plausibly not involved in relief efforts, then thetornado does not increase donations of individuals in k to charities that are local to j.Displacement effects of tornadoes are therefore less than or equal to 4 j , which can beestimated using changes in donations received by charities in location j. The ratio of thechange in receipts of these charities to the change in donations on individual tax returnsyields an estimate of4 j4 j 4n j ,which is easily transformed into4 j4n j ,the (negative of the)share of dollars going to support tornado victims that otherwise would have been givento local charities.While our research design improves on those used in prior studies, in which subjectscan often choose between only a limited number of charities, it does have some limitations. Regarding the income tax data, the primary limitation is that not all donations areclaimed for tax deductions, primarily because not all individuals itemize their deductions. Income tax data will therefore likely underestimate the total change in individualdonations in response to tornadoes, making our estimate of the substitution ratio an up16 Wefocus on areas that are not themselves struck by tornadoes because charitable-giving responses indirectly affected areas are difficult to predict. For example, tornadoes may have negative income effects inareas where they strike and/or generate a large in-kind giving response, which we cannot measure withour data.12
per bound.17 We acknowledge several caveats for working with the charity data. First,our estimates will be biased against finding displacement if organizations located morethan 20 miles from a tornado serve its victims. While we think this is unlikely to be thecase for relatively small charities, we also test for this issue by dropping larger organizations that may operate in multiple locations and by testing for heterogeneity by charitytype. Second, our spatial design will not capture any negative effects on national organizations that are not serving tornado victims. Similarly, while donations to religiouscongregations can be deducted and so should appear in the income tax data, congregations are not required to file information returns. Even if there are displacement effects oneither of these types of organizations that differ from those we can measure, our designstill provides unbiased estimates of the displacement effect for local charities. Third, aportion of the literature has examined substitution between donating and volunteering(e.g. Brown et al. 2019), and we do not capture volunteering or informal giving that doesnot pass through charitable organizations. However, we expect that volunteering for andinformal giving to tornado victims living more than 20 miles away is limited.3.2Estimation approachEven for locations in ”tornado alley,” tornadoes are unpredictable (Simon, 2019). Basedon this unpredictability, our identification assumption is that, conditional on location andtime fixed effects, the number of fatalities caused by tornadoes is unrelated to other determinants of charitable giving. To estimate the effects of tornadoes on charitable giving,we estimate the following equation:asinh(dit ) β asinh( f atalitiesitb ) X it αi αt ε it .17 Alternatively,(1)we might overestimate the total charitable response by individuals if tornadoes cause individuals who would have given but not claimed deductions to start claiming deductions. Appendix TableA.1 shows, however, that we do not find significant effects on the number of returns claiming charitabledeductions.13
In this equation, t is the year, and the unit of observation i is a ZIP Code when using theincome tax data and a charity when using the charity data. The outcome is asinh(dit ), theinverse hyperbolic sine (asinh) of charitable donations for unit i in year t. The variable ofinterest is asinh( f atalitiesitb ), the inverse hyperbolic sine of fatalities caused by tornadoesthat struck within a band of distances indexed by b.The variation in tornadoes would not be plausibly random if we did not estimateeffects within a location. Equation (1) therefore includes controls for unit and year fixedeffects, αi and αt , respectively. Time-varying controls X it improve the precision of ourestimates. We include 3-digit-ZIP time trends in all regressions. When using the charitydata, we control for EIN-by-ZIP Code fixed effects. When using the income tax data, wecontrol for cubic functions of the number of tax returns and total AGI, both of which weshow to be unaffected by tornadoes (Appendix Table A.2). We also control for year fixedeffects for each ventile of AGI.18Donors may have greater affinity for victims in their own states. To allow for this, weuse three measures of f atalitiesit : Fatalities caused by tornadoes that struck (a) 20–100miles away, (b) 20-100 miles away and within the same state, and (c) 20 miles away andwithin the same state. Throughout, we report standard errors that are clustered at thestate level.44.1ResultsDonations made to all causesThe results reported in Table 2 show that deadly tornadoes significantly increase total donations to all causes. Our first measure is the number of fatalities caused by tornadoesthat struck within 20–100 miles of donors’ ZIP Codes (columns 1–2). We obtain a larger es18 We use AGI in the observed year closest to 2010, the midpoint of our sample, using the later year incases of ties.14
Table 2: The effect of tornadoes on donations to all causes (income tax data)(1)Fatalities, 20-100 milesFatalities, 0-20 miles(2)(3)(4)(6)0.00180.0017(0.0009)** (0.0008)**0.0007(0.0014)In-state fatalities, 20-100 miles0.00300.0029(0.0013)** (0.0012)**In-state fatalities, 20 milesIn-state fatalities, 0-20 milesObservationsAICEffect ( 1000s) of add’l. fatalityStandard error of add’l. fatality(5)354,457-2865061025492.6354,457-28650
Charitable donations are an important source of funding for many public goods. For example, U.S. charitable giving makes up about 2 percent of GDP (List, 2011). Devolved funding responsibility creates costly competition for such funds, though, prompting many to ask whether charitable solicitations increase total giving or simply displace donations