Transcription
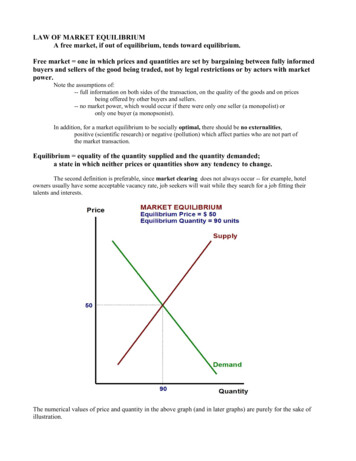
LAW OF MARKET EQUILIBRIUMA free market, if out of equilibrium, tends toward equilibrium.Free market one in which prices and quantities are set by bargaining between fully informedbuyers and sellers of the good being traded, not by legal restrictions or by actors with marketpower.Note the assumptions of:-- full information on both sides of the transaction, on the quality of the goods and on pricesbeing offered by other buyers and sellers.-- no market power, which would occur if there were only one seller (a monopolist) oronly one buyer (a monopsonist).In addition, for a market equilibrium to be socially optimal, there should be no externalities,positive (scientific research) or negative (pollution) which affect parties who are not part ofthe market transaction.Equilibrium equality of the quantity supplied and the quantity demanded;a state in which neither prices or quantities show any tendency to change.The second definition is preferable, since market clearing does not always occur -- for example, hotelowners usually have some acceptable vacancy rate, job seekers will wait while they search for a job fitting theirtalents and interests.The numerical values of price and quantity in the above graph (and in later graphs) are purely for the sake ofillustration.
Demonstration of the law of market equilibrium.1. Assume actual price is above market equilibrium price.-- the negative slope of the demand curve for buyers will mean that the quantity demanded will be lessthan the equilibrium quantity;-- the positive slope of the supply curve for sellers will mean that the quantity supplied will be greaterthan the equilibrium quantity;-- hence the quantity supplied will be greater than the quanitity demanded.This imposes storage costs and spoilage costs on suppliers -fisherman find their catch spoiling,farmers must build grain elevators to store their grain,car dealers must pay interest to the bank on the loans they take out to buy the cars from GM or Honda.Consumers are always happier with lower prices, and storage and spoilage costs give producers a motive tolower their prices.Note that the SPEED of adjustment can vary with the size of the costs of storage or spoilage:fish spoil quickly, and the price adjusts quickly;grain spoils less quickly, and farmers don't have to adjust this week;cars will lose value only when the new model year begins, and prices adjust still less quickly;jobless workers will take time to search for appropriate jobs; more highly educated workers generallyhave more trouble finding a good match.
2. Assume the actual price is below the equilbrium price.The negative slope of the demand curve ensures that there will be a greater quantity demanded than atthe equilibrium price.The positive slope of the supply curve ensures that there will be a smaller quantity supplied than at theequilibrium price.Hence the quantity demanded will exceed the quantity supplied. This excess demand will forceconsumers to spend more time looking for sellers who have the good available, and to spend more time waitingin line if they do find a seller with the good. These search costs and queuing costs will lead some consumers tooffer more for the good, and hence the price will tend to rise.Since price will tend to rise when excess demand leads to shortages, and price will tend to fall when there isexcess supply, the only point at which price could be stable is when there is neither excess demand nor excesssupply. If there is neither excess demand nor excess supply, the quantity demanded equals the quantity supplied-- and this is the definition of equilibrium.You should not think of equilibrium as a permanent situation -- the supply and demand curves will shiftwhen anything other than the price of the good itself changes consumers' willingness to pay for the good orchanges producers' cost of production.Equilibrium is a reference point to enable supply and demand analysis to predict the direction in whichprices and quantities will respond to any economic change.
SUPPLY AND DEMAND ANALYSISSomethinghappens A curveshiftsDisequilibriumPrices change results to lead towards anew equilibriumChanges that lead to an increase of demand:-- an increase in income (for NORMAL goods)Examples: LCD TVs, champagne, restaurant meals, vacations, sports cars-- a decrease in income (for INFERIOR goods)Examples: Tube TVs, MD 20/20, fast food meals, porch sitting, bus rides.-- an increase in the price of substitutesExamples: the price of tea increases and the demand for coffee increases;the price of beef increases and the demand for chicken increases.-- a decrease in the price of complementsExample: the price of gasoline falls and the demand for SUV's increases,the room rate for a hotel near the golf course falls and the demand for golf increases.-- a change in expectations of what will happen.If you expect the shares of stock of a company will rise in value, you increase your demand forthe stock; if you expect prices of toilet paper or tuna fish or gold to rise in the future, you increase yourdemand for the product now.-- consumer tastes change.While this sometimes happens due to an advertising campaign or a medical report on healthbenefits, do not use this explanation unless you can explain what caused the change in tastes, and canshow that changes in price or income were not sufficient to explain the shift in demand.Change income or prices of other goods in the opposite fashion to get the factors behind a decrease in demand.
Changes that lead to an increase of supply.Anything that reduces the marginal cost of production at any given quantity of output leads to an increasein supply.This includes lower wages for workers in the industry, lower prices of raw materials or technological change.Note: the common impression that technological change makes things more expensive is mistaken, except whenthe change makes it possible to produce new goods (and this is an increase of supply from zero). Inventions do not getadopted by firms unless they are profitable.Joseph Schumpeter made the distinction between invention (scientific discovery) and innovation (the adoption ofan invention by firms, and pointed out that a long time could elapse between the two.Other factors leading to an increase of supply:-- expectations of future price decreases may increase supply now, as producers reduce inventories.-- greater number of producers of a good will increase supply.Graphically, an increase of supply is shown by a shift DOWN of the supply curve.A lower cost of production makes producers willing, if they have to, to accept lower prices.The vertical axis of a supply-demand graph is the price axis, so the curve begins at a lower point.The major explanation of a decrease in supply is, of course, any factor that increases the marginal cost ofproduction for any given quantity.Note that when supply shifts, the new equilibrium price and quantity move in opposite directions:price drops and quantity increases in the case of an increase in supply,price rises and quantity decreases in case of a decrease in supply.
Double shiftsWhen two changes occur at once, one affecting supply and the other demand, we can be sure of thequalitative change in either price or quantity, but not both. Unless we have information on the equations ofsupply and demand, we will be uncertain of the equilibrium change in either price or quantity.Example: assume that wages in the auto industry increase, while incomes generally are falling.The wage increase would lead to a shift upwards of the supply (a decrease in supply) in the autoindustry; the decrease of incomes would lead to a decrease in demand (if autos are a normal good). The graphsbelow are meant to demonstrate that:a. We know that the quantity of automobiles will fall -- both producers and consumers would reducetheir quantities at any given price.b. Producers would require an increase in price at any given quantity; consumers would want a fall inprice in order to purchase the same quantity. What happens to price depends on the size of the shifts in supplyand demand.Graph 1 -- Demand shifts more than supplyQuantity and price both fallGraph 2 -- Supply shifts more than demandQuantity falls, price risesYou should draw a graph in which supply and demand shift equally, to show that price can remain unchangedwhile quantity falls.Also draw three graphs for each of the following double shifts:a. Demand and supply both increase (quantity increases, price uncertain)b. Demand increases, but supply decreases (price increases, quantity uncertain)c. Demand decreases, but supply increases (price decreases, quantity uncertain).
A free market, if out of equilibrium, tends toward equilibrium. . car dealers must pay interest to the bank on the loans they take out to buy the cars from GM or Honda. Consumers are always happier with lower prices, and storage and spoilage costs give producers a motive to