Transcription
Electronic Supplementary Material (ESI) for RSC Chemical Biology.This journal is The Royal Society of Chemistry 2022Supporting InformationMonitoring GAPDH activity and inhibition with cysteinereactive chemical probesSarah E. Canarelli,a Brooke M. Swalm,b Eric T. Larson,*b Michael J. Morrison,*c and EranthieWeerapana*aaDepartment of Chemistry, Boston College, Chestnut Hill, Massachusetts 02467, United StatesbRheos Medicines, Inc, Cambridge, Massachusetts 02142, United StatescFormer address: Rheos Medicines, Inc, Cambridge, Massachusetts 02142, United States*elarson@rheosrx.com; mmorrison57@gmail.com; eranthie@bc.edu
Supplemental Table 1. Complete ReDiMe abundance dataset for Jurkat cells treated withvehicle (light) and 100 μM SEC1 (heavy) (n 3, s.d. 25%).Supplemental Table 2. Filtered cysteine reactivity datasets for Jurkat cells treated with vehicle(IA-heavy) and KA (IA-light) at 1, 5, and 10 μM (n 3, s.d. 25%).Supplemental Table 3. Filtered cysteine reactivity dataset for HeLa cells treated with vehicle (IAheavy) and KA (IA-light) at 10 μM (n 3, s.d. 25%).Supplemental Table 4. Thermal shift analysis (TSA) of GAPDH in the presence of NAD and koningic acid (KA). GAPDH is stabilized by the cofactor NAD in a concentration-dependentmanner and is destabilized by KA in a concentration-independent manner even with addition ofexcess NAD . Neither NAD nor KA has an effect on the thermal stability of GAPDH that has theactive site cysteine mutated to either serine or alanine. (aaverage of 6 experiments, baverage of3 experiments, caverage of 2 experiments, dsingle experiment)Supplemental Table 5. KA binding does not affect GAPDH quaternary structure. Analyticalsize exclusion chromatography shows that thermal destabilization of GAPDH that is observedupon covalent binding of KA is not due to disruption of the biological tetramer.
Supplemental Figure 1. SEC6 is a fluorescent analog of SEC1 that maintains affinity toGAPDH. (A) Chemical structure of a fluorescent, truncated analog of SEC1 (B) In-gelfluorescence evaluation of HeLa lysates labeled with SEC6 (100 μM, 1h).
Supplemental Figure 2. KA is a potent and selective GAPDH inhibitor in HeLa cells. (A)HeLa cells were incubated with increasing concentrations of KA and lysates were labeled withSEC1 (100 μM, 1h). Protein labeling was evaluated by in-gel fluorescence. Error bars representthe standard deviation from three replicates. (B) Heavy:light log2R for all identified cysteines invehicle (heavy) and 10 μM KA (light) treated HeLa cells (n 3, s.d. 25%).
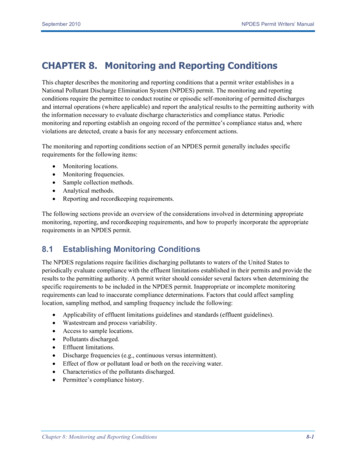
ABSupplemental Figure 3. KA binds irreversibly to wild-type GAPDH and reversibly to acatalytically-dead mutant (C152S). (A) Representative SPR sensorgram for wild-type proteinshowing covalent, irreversible binding upon addition of KA. (B) Multi-cycle kinetic analysis of KAbinding to GAPDH C152S. Binding to the protein was fast and reversible, KD 230 6 μM. Nterminal avi-tagged GAPDH was immobilized on a streptavidin-coated chip and varyingconcentrations of KA (3-fold, 7-point dilution series at a starting concentration of 1000 μM) wereinjected in the presence of saturating concentrations of NAD (100 μM). Standard deviation wascalculated based on two independent measurements of KA binding to GAPDH.
Supplemental Figure 4. KA is a potent irreversible inactivator of GAPDH. KA is a covalentinhibitor of GAPDH and inactivates the enzyme at a maximum potential rate (kinact) of 1.44 min-1with a binding constant (Ki) of 6.3 μM. Enzyme activity was measured over time at varyingconcentrations of KA (14-point, 2.5-fold dilution series, top concentration of 20 μM) underbalanced substrate conditions (24 μM NAD , 74 μM G3P, 6 mM Na2HAsO4). The pseudo-firstorder rate constant kobs was calculated from the progress curve with the following equation: [P] (vi/kobs)[1-exp(-kobs*t)]. For determination of kinact and Ki, kobs was plotted versus KA concentrationand fit with the equation kobs (kinact*[KA])/(Ki [KA]).
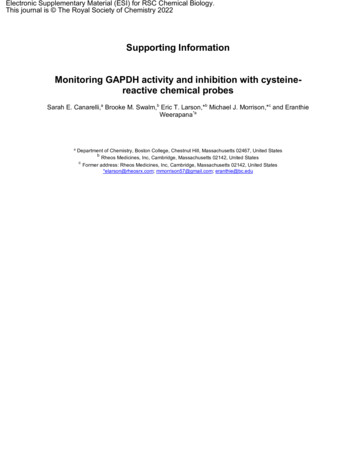
ABCNTC RestedNTC StimulatedZap70ko RestedZap70ko StimulatedSupplemental Figure 5. INFγ production decreases upon GAPDH knockout. CRISPR (cr)knockout of GAPDH results in the reduction of IFNγ production in CD4 T cells. All values aremeans S.E. (error bars) from six different donors replicates (n 6). NTC non-targeting control
Materials and MethodsAll chemical and biological materials were purchased from Sigma Aldrich or FisherScientific unless otherwise noted. Fmoc-protected amino acids, PyBOP, and Rink AmideMBHA resin were purchased from Novabiochem (San Diego, CA). Fetal bovine serum(FBS) was purchased from Atlanta Biologicals. IA-light and IA-heavy were synthesizedin-house according to Abo, M. et al.1 PC biotin azide was purchased from Click ChemistryTools and TAMRA azide was purchased from Lumiprobe. Anti-GAPDH (cat. 2118S), antimyc (cat. 2278S) and rabbit anti-IgG secondary antibody (cat. 7074S) were purchasedfrom Cell Signaling Technologies. Anti-ACTIVE MAPK (cat. V8031) was purchased fromPromega.I. Fmoc-solid-phase peptide synthesis (SPPS)General ProcedurePeptides were synthesized by manual solid-phase synthesis on Rink Amide MBHA Resinusing fluoren-9-ylmethoxycarbonyl (Fmoc) as the protecting group for all the a-aminofunctionalities. An OBzl side-chain protecting group was used on Fmoc-phosphoserineand a Trt side chain protecting group was used on Fmoc-serine. Amino acid coupling lidinophosphoniumhexafluorophosphate (PyBOP) as the coupling reagent. The chloroacetamide electrophile wasadded to each peptide following Scheme 1. Full length peptides were cleaved from theresin for 2 hr using a cleavage cocktail containing 90% trifluoroacetic acid (TFA), 5%dichloromethane (DCM), 2.5% triisopropylsilane (TIS) and 2.5% H2O. All peptides werepurified by preparative reverse-phased HPLC on a Waters 1525 HPLC with a Waters2489 UV/Vis Detector. Preparative HPLC was performed using a Waters XBridge PrepC18 Column (10 x 250 mm, 5µm) and a water-acetonitrile mobile phase with a gradientmoving from Buffer A (95% water, 5% acetonitrile, 0.1% TFA) to Buffer B (5% water, 95%acetonitrile, 0.1% TFA). The mobile phase was run at a flow rate of 5mL/min for 35 minand peptides were detected with UV detection at 220 nm and 280 nm. Mass spectrometrydata for each peptide was collected using an Agilent 6230 LC TOF mass spectrometerwith an Agilent Zorbax C18 column (2.1 x 150 mm, 5 µm). Peptides were eluted with awater-acetonitrile gradient moving from 5% to 95% acetonitrile (0.1% Formic acid) over30 minutes with a flow rate of 200 µL/min and UV and MS Detection.FmocFmocFmocSPPSSPPSSPPSH2HN2NH 2NOO OR3R3R3O O OR1R1R1O O OR1R1R1O O OR3R3R3HH HH H H ClCl ClHH HHH HClCl ClNN NNN NNN NNN NClCl ClH2HN2NH 2NNN NNNNNNNHH HTEA,TEA,TEA,DCMDCMDCMHH HHH HO O OR2R2R2OO OO O OR R ROO O2 2 2Scheme S1. Synthesis of peptide probes bearing chloroacetamide electrophile (SEC15)
Synthesis of SEC1Rink Amide MBHA resin was used with the following amino acid residues Fmoc-Phe-OH,Fmoc-Pra-OH, Fmoc-Pro-OH, and Fmoc-Ser(PO(OBzl)OH)-OH under standardsynthesis conditions. After the final coupling and deprotection step, the resin was driedby washing with dichloromethane (DCM). The resin was swelled in dry N,NDimethylformamide and chloroacetyl chloride (3 eq) followed by triethylamine (3 eq) wereadded to the vessel. The reaction vessel was capped and rocked for 16 hrs. The solventwas removed and the resin was washed with DMF (3 x 3 mL) and DCM (5 x 3 mL). Thepeptide was cleaved as described above and purified by HPLC to give the pure peptideSEC1. HPLC tR 17.85 min; (C33H40ClN6O10P) m/z calc’d 746.2232 ; obs’d 747.2024Synthesis of NJP14The standard procedure outlined for SEC1 was used except the Fmoc-Ser(PO(OBzl)OH)OH was replaced with Fmoc-Ser(Trt)-OH. The peptide was cleaved using the conditionsdescribed above and purified by HPLC to give the pure peptide NJP14.HPLC tR 19.19min; (C33H39ClN6O7) m/z calc’d 666.2569; obs’d 667.2581Synthesis of SEC2The standard procedure outlined for SEC1 was used except the first Phe residue wasreplaced with Fmoc-Ala-OH. The peptide was cleaved using the conditions describedabove and purified by HPLC to give the pure peptide SEC2. HPLC tR 15.37 min;(C27H36ClN6O10P) m/z calc’d 670.1919; obs’d 671.1998Synthesis of SEC3The standard procedure outlined for SEC1 was used except the second Phe residue wasreplaced with Fmoc-Ala-OH. The peptide was cleaved using the conditions describedabove and purified by HPLC to give the pure peptide SEC3. HPLC tR 15.97;(C27H36ClN6O10P) m/z calc’d 670.1919; obs’d 671.1879Synthesis of SEC4The standard procedure outlined for SEC1 was used except the Fmoc-Pro-OH residuewas replaced with Fmoc-Ala-OH. The peptide was cleaved using the conditions describedabove and purified by HPLC to give the pure peptide SEC4. HPLC tR 17.62 min;(C31H38ClN6O10P) m/z calc’d 720.2076; obs’d 721.2089Synthesis of SEC5The standard procedure outlined for SEC1 was used except the Fmoc-Ser(PO(OBzl)OH)OH was replaced with Fmoc-Ala-OH. The peptide was cleaved using the conditionsdescribed above and purified by HPLC to give the pure peptide SEC5. HPLC tR 19.80min; (C33H39ClN6O6) m/z calc’d 650.2620; obs’d 651.2577Synthesis of SEC6The standard procedure outlined for SEC6 was used except the Fmoc-Phe-OH residueswere not added. The peptide was cleaved using the conditions described above andpurified by HPLC to give the pure peptide. Following purification, the peptide (1eq) and
rhodamine-azide (1 eq) were dissolved in a 80% mixture of MeOH and water. Sodiumascorbate (200 mg/mL) and Copper (II) sulfate (85 mg/mL) were added to the solutionand the sample was stirred overnight. The solvent was evaporated to leave the crudepink solid. The fluorescent peptide was purified by HPLC to give the pure peptide SEC6.HPLC tR 18.29 min; (C43H50ClN10O12P) m/z calc’d 964.3036; obs’d 965.2888II. Cell culture and protein expressionCell cultureAll cell lines maintained at 37 C under 5% CO2. HeLa and HEK293T were grown inDMEM supplemented with 10% FBS and 1% antibiotic-antimycotic (Pen/Strep; 25 µg/mLAmphotecerin B, 10,000 units/mL Penicillin, 10,000 µg/mL Streptomycin). MCF10A andMCF10CA1a cells were grown in DMEM supplemented with 5% horse serum (HS), 1%Pen/Strep, EGF (20 ng/mL), Hydrocortisone (0.5 mg/mL), Cholera toxin (100 ng/mL) andInsulin (10 µg/mL). Jurkat cells were grown in RPMI 1640 supplemented with 10% FBSand 1% Pen/Strep.Preparation of lysatesThe cells were grown to 100% confluence before being harvested by scraping andpelleted. Cells were washed with Dulbecco’s phosphate buffered saline (DPBS) and thepellet was resuspended in an appropriate volume of DPBS. Cell suspensions were lysedby sonication using an ultrasonic tip sonicator (Cole Palmer). Whole cell lysates wereseparated into soluble and insoluble lysate fractions by centrifugation at 4 C (16,000 x g,15 min). The insoluble fraction was discarded and the protein concentration of the solublefraction was determined using the DC Protein Assay Kit (Bio-Rad).Overexpression of GAPDH in HEK293T cellsA pcDNA3.1-myc/His plasmid containing the ORF of GAPDH was used for transfectionand mutagenesis. The GAPDH C152S mutant was generated following the Quikchangeprocedure (Stratagene) using the primers: forward: �� and reverse: 5’- CAAGATCATCAGCAATGCCTCCAGCACCACCAACTGCTTAGC-3’. The mutant was sequenced and found to containonly the desired mutation. HEK293T cells were grown as described above. Transfectionwas performed in a 10cm plate of 70% confluent. Serum-free media (600 µL) andLipofectamine 3000 transfection reagent (40 µL) were combined. Plasmids for WTGAPDH and C152 mutant GAPDH (8.8 µg) were diluted in serum-free media (600 µL).Diluted plasmids and lipofectamine were combined in a 1:1 ratio and incubated at RT for5 minutes. The plasmid solution was added to the plate of HEK293T cells. Cells wereincubated for 48 hrs at 37 C under 5% CO2. For the mock transfection, water was addedin place of the plasmid. Lysates were prepared as described above and expression wasevaluated by western blot and in gel fluorescence.GAPDH Protein Expression/PurificationFull-length human GAPDH (https://www.uniprot.org/uniprot/P04406) was cloned into thepET21b E. coli expression vector with an N-terminal, TEV protease-cleavable 6xHis tag.
Recombinant protein was expressed in E. coli and purified initially from cell lysate by Niaffinity chromatography. The His tag was removed from GAPDH by incubating with Histagged TEV protease, which was then removed by passage over a second Ni-NTAcolumn. The flow through containing tag-free GAPDH was further purified by sizeexclusion chromatography over a HiLoad 16/600 Superdex 75 pg column into a buffercomposed of 50 mM Tris, pH 7.5, 150 mM NaCl, 1 mM DTT. Peak fractions containingGAPDH were pooled and concentrated to approximately 13 mg/ml using a MilliporeAmicon Ultra Centrifugal Filter (15mL, 30K MWCO). Purified protein was stored at -80 C.III. Peptide probe labeling, fluorescent gel analysis, and western blottingSEC1-5/NJP14 probe labelingHeLa cell lysates (50 µL, 2 mg/mL) were incubated with the peptide probe (SEC15/NJP14, 100 µM) at room temperature (RT) for 1 hr. Labeled lysates underwent clickchemistry and in-gel fluorescence analysis, TAMRA azide (Rh-N3), Tris(2carboxyethyl)phosphine hydrochloride (TCEP) (1 mM, 50X fresh stock in water), Tris[(1benzyl-1H-1,2,3-triazol-4-yl)methyl]amine (TBTA ligand) (100 µM, 17X stock in DMSO:tButanol 1:4), and Copper(II) sulfate (1 mM, 50X stock in water) were added to the lysates.The samples were incubated at room temperature for 1 hr.In-gel fluorescence analysis of SEC6HeLa cell lysates (50 µL, 2 mg/mL) in DPBS were treated with SEC6 (100 µM) at RT for1 hr. Labeled lysates were then subjected in-gel fluorescence analysis as describedabove.Fluorescent gel analysisSDS-PAGE loading buffer 2x (reducing, 50 µL) was added to the Rh-labeled samples and15 µL of this solution was separated by SDS-PAGE at 100 volts (V) for 2.5 hours on a12.5% polyacrylamide gel. Gels were visualized on a Bio-Rad ChemiDoc MP imagingsystem. After fluorescent visualization, gels underwent a typical procedure for Coomassiestaining and destaining. Stained gels were visualized on a Bio-Rad ChemiDoc MPimaging system.Western blottingCell lysates were prepared as described above. Normalized lysates were run on a 12.5%polyacrylamide gel at 150V. Proteins were transferred to a nitrocellulose membrane at75V for 90 min. Membranes were blocked with 5% bovine serum albumin (BSA) in Trisbuffered saline with 0.1% Tween20 (TBST) for 1 hr at RT, and then incubated withantibodies against GAPDH (1:1000), the myc epitope (1:1000), or ACTIVE MAPK(1:5000) overnight at 4 C. Membranes were washed 3 times with TBST and incubatedwith an HRP-linked secondary antibody (1:2000) for 1 hr at RT. Membranes were washed3 times with TBST and incubated with SuperSignal West Pico PLUS chemiluinescentsubstrate. The membranes were imaged with the Bio-Rad ChemiDoc MP imagingsystem.
IV. Mass spectrometry sample preparation and data analysis: Identification ofSEC1 targetsProbe labeling, click chemistry and streptavidin enrichmentJurkat cell lysates (500 µL, 2 mg/mL) in DPBS were treated with SEC1 (100 µM) or DMSOfor 1 hr at RT and then treated lysates underwent click chemistry. PC biotin azide (200µM, 100x stock in DMSO), Tris(2-carboxyethyl)phosphine hydrochloride (TCEP) (1 mM,50X fresh stock in water), Tris[(1-benzyl-1H-1,2,3-triazol-4-yl)methyl]amine (TBTA ligand)(100 µM, 17X stock in DMSO:t-Butanol 1:4), and Copper(II) sulfate (1 mM, 50X stock inwater) were added to the lysates. The probe -labeled samples were incubated at RT for1 hr and then spun down for 10 min at 4 C. The pellets were washed with cold MeOHand resuspended by sonication with the tip sonicator. Samples were centrifuged andwashed a second time with MeOH. The pellets were solubilized in DPBS containing 1.2%SDS via sonication and heating for 5 min at 85 C. The solubilized samples were dilutedto a final concentration of 0.2% SDS in DPBS (5 mL) and incubated with 100uL ofstreptavidin-agarose beads for 16 hrs at 4 C with rotation. The solutions were incubatedat RT for 3 hrs. The strep beads were washed with 0.2% SDS in DPBS (5 mL), DPBS (3x 5 mL), and water (3 x 5 mL). The beads were pelleted by centrifugation (1400 x g, 3min) between washes. Washed beads were carried through on-bead trypsin digestion.On-bead trypsin digestionWashed beads were resuspended in 6M urea/PBS (500 µL) containing 10mMdithiothreitol (DTT, 20X stock in water) and heated at 65 C for 20 min. 20 mMiodoacetamide (IA, 50X stock in water) was added to the samples and incubated at 37 Cfor 30 min. Following reduction and alkylation, the beads were pelleted by centrifugation(1400 x g, 3 min) and resuspended in 200µL of tetraethylammonium bicarbonate (TEAB,100mM), CaCl2 (1 mM, 100X stock in water), and trypsin (2 µg, Promega). Trypsindigestion was performed at 37 C overnight with shaking.On-bead ReDiMe labelingPost tryptic digestion, SEC1-labeled samples were labeled with 8 µL of light 20%formaldehyde and DMSO-treated samples were labeled with 8 µL of heavy 20%formaldehyde(13CD2O). 8 µL of 0.6 M sodium cyanoborohydride was added to eachsample and incubated at RT for 1 hr. Samples were placed on ice, and the reactions werequenched with 32 µL of 1% ammonium hydroxide. MS-grade formic acid (16 µL) wasadded to each sample and samples were combined pairwise (DMSO and SEC1-labeled)leaving the strep beads behind. Samples were desalted using Sep Pak C18 cartridges(Waters), eluted with 1.5 mL of Buffer B (20% water, 80% ACN, 0.1% formic acid), driedby speed-vac and resuspended in 25 µL of Buffer A (95% water, 5% ACN, 0.1% formicacid). Samples were stored at -20 C for future MS analysis.LC/LC-MS/MS analysisMass spectrometry analysis was performed on a Thermo Fisher Orbitrap Exploris 240mass spectrometer coupled to a Dionex Ultimate 3000 RSLnano UHPLC. Desaltedpeptide samples (5 µL) were loaded onto a 4 cm C18 trap column (Acclaim Pepmap 100)
and eluted onto a 15 cm C18 analytical column (Acclaim Pepmap RSLC) using a gradientof 0-100% Buffer B in Buffer A (Buffer A: 100% water, 0.1% formic acid; Buffer B: 20%water, 80% ACN, 0.1% formic acid). The flow rate through the column was set to 300nL/min with a spray voltage of 2.1 kV. One full MS scan was followed by 20 datadependent scans of the nth most intense ions with dynamic exclusion enabled.Data analysisProtein identification and quantification of SEC1 targets was performed using the SequestHT algorithm in Proteome Discoverer (PD; version 2.4; Thermo Fisher Scientific). Theraw data was searched using a concatenated target/decoy non-redundant variant of thehuman UniProt database. Trypsin was used as the protease, and the maximum numberof missed cleavages was set to 2. Peptide precursor mass tolerance was set to 10 ppm,and fragment mass tolerance was set to 0.02 Da. Acetylation and methionine-loss of theprotein N-terminus or a combination of the two were set as dynamic modifications, alongwith methionine oxidation. In addition to a static modification on cysteine, staticmodifications of 28.031 (light) or 34.063 (heavy) on the N-terminus of the peptide andon lysine were included to account for dimethylation of primary amines. The falsediscovery rate (FDR) of peptide identification was set to 1%. To identify protein targets ofSEC1, the resulting non-normalized light:heavy ratios were filtered for high protein FDRconfidence with abundance ratios in every run and a molecular weight (MW) between 30and 45 kDa as shown in Figure 1D. The full dataset can be found in Supplemental Table1.V. Gel-based experimentsIn gel-fluorescence: MCF10 cell linesMCF10A and MCF10CA1a cell lysates (50 µL, 2 mg/mL) in DPBS were treated with 10µMKA or DMSO as a control. Lysates were incubated at RT for 1 hr and then labeled withSEC1 (100 µM) at RT for 1 hr. Labeled lysates were then subjected to click chemistry andin-gel fluorescence analysis, as well as western blotting analysis, as described above.Competitive in-gel fluorescence: H2O2HeLa cell lysates (50 µL, 2 mg/mL) in DPBS were treated with increasing concentrationsof hydrogen peroxide (10, 100, 500 µM, 1 mM and 10 mM) or water as a control. Lysateswere incubated at RT for 1 hr and then labeled with SEC1 (100 µM) at RT for 1 hr. Labeledlysates were then subjected to click chemistry and in-gel fluorescence analysis asdescribed above.Competitive in-gel fluorescence: GAPDH inhibitorsJurkat cell lysates (50 µL, 2 mg/mL) in DPBS were treated with Iodoacetate (10 µM, 100Xstock in water), Bromopyruvic acid (10 µM, 100X stock in DMSO), Koningic acid (10 µM,100X stock in DMSO), DMF (10 µM, 50X stock in DMSO) or DMSO as a control. Lysateswere incubated at RT for 1 hr and then labeled with SEC1 (100 µM) or IA-light (100 µM)at RT for 1 hr. Labeled lysates were then subjected to click chemistry and in-gelfluorescence analysis as described above.
Competitive in-gel fluorescence: Koningic acidJurkat and HeLa cell lysates (50 µL, 2 mg/mL) in DPBS were treated with increasingconcentrations of Koningic acid (100, 500 nM, 1, 2, 4, 6, 8, 10 µM) or DMSO as a control.Lysates were incubated at RT for 1 hr and then labeled with SEC1 (100 µM) at RT for 1hr. Labeled lysates were then subjected to click chemistry and in-gel fluorescenceanalysis as described above.VI. Biochemical assaysMechanism of Inhibition Biochemical AssayKoningic acid mechanism of inhibition was determined by varying each substrateseparately and measuring GAPDH activity over time. One μL of KA in 100% DMSO wasadded to a 384-well polypropylene, clear microplate (Greiner, 781280) at varyingconcentrations (12-point, 3-fold dilution, top concentration of 120 μM). Ten μL of thevarying substrate (8-point, 2-fold dilution; top concentration of 600 μM for Dglyceraldehyde 3-phosphate (G3P) and 200 μM for NAD ) was dispensed into the plate.The reaction was initiated with 40 μL of enzyme and substrates (0.25 nM GAPDH, 6 mMsodium arsenate, and either 24 µM NAD or 74 µM G3P). The reaction was quenchedover the linear portion of the reaction curve with the addition of bromopyruvic acid at afinal concentration of 1 mM. Enzymatic activity was measured by the generation of NADHproduct using the NAD/NADH-Glo detection kit (Promega). Addition of 5 μL reaction mixwas combined with 5 μL of detection reagent and incubated for 45 minutes at roomtemperature in a 384-well polystyrene, white microplate (PerkinElmer ProxiPlate,6008280). Total bioluminescent signal was measured using an Envision multimode platereader (PerkinElmer). NAD and G3P data were globally fit to an uncompetitive andcompetitive inhibition model (respectively) using Prism 9.2 (GraphPad).Fractional Activity Biochemical AssayThe partition ratio was determined by measuring residual GAPDH activity at varyingconcentrations of KA following rapid dilution of enzyme-NAD -inhibitor complex. GAPDH(100x, 25 nM) was pre-incubated with NAD (100x, 4.8 mM) and varying concentrationsof inhibitor (100x, 7-point, 2-fold dilution, top concentration of 400 nM) for 60 minutes.The solution was then diluted in assay buffer (50 mM Bicine, pH 7.6, 0.004% Tween-20,and 0.005% bovine serum gelatin) 100-fold and enzymatic activity was measured by thegeneration of NADH product using the NAD/NADH-Glo detection kit (Promega). Theassay was performed in a 384-well polystyrene, white microplate (PerkinElmerProxiPlate, 6008280) under balanced conditions (74 µM G3P, 6 mM sodium arsenate,and 24 µM NAD ) at 0.25 nM enzyme. The reaction was quenched over the linear portionof the reaction curve with the addition of bromopyruvic acid at a final concentration of 1mM. Total bioluminescent signal was measured using an Envision multimode platereader (PerkinElmer). The partition ratio (r) was calculated using a simple linearregression and is equal to x-axis point of intersection minus 1.
Jump Dilution Biochemical AssayCompound reversibility was evaluated by measuring enzymatic activity of full-lengthGAPDH over time following the rapid dilution of the enzyme-inhibitor complex. GAPDH(100x, 25 nM) was pre-incubated with a saturating concentration of inhibitor (10x IC50,500 nM) and NAD (100x, 2.4 mM) for 30 minutes. The solution was then diluted in assaybuffer (50 mM Bicine, pH 7.6, 0.004% Tween-20, and 0.005% bovine serum gelatin) 100fold and enzymatic activity was measured by the generation of NADH product using theNAD/NADH-Glo detection kit (Promega). The assay was performed in a 384-wellpolystyrene, white microplate (PerkinElmer ProxiPlate, 6008280) under balancedconditions (74 µM G3P, 6 mM sodium arsenate, and 24 µM NAD ) at 0.25 nM enzyme.The reaction was quenched over the linear portion of the reaction curve with the additionof bromopyruvic acid at a final concentration of 1 mM. Total bioluminescent signal wasmeasured using an Envision multimode plate reader (PerkinElmer).Thermal Shift AssayAliquots of GAPDH were thawed from -80 C and centrifuged at 12,000 RPM for 5 minutesat 4 C. Clarified protein was diluted to 2.5 μM in the same buffer used for size exclusion(50 mM Tris, pH 7.5, 150 mM NaCl, 1 mM DTT). Stock solutions of cofactors andinhibitors were prepared at 50-fold the final desired assay concentration in DMSO.GAPDH protein was mixed with various inhibitors and/or cofactors and buffer, incubatedon ice for 2 hours, and centrifuged at 12,000 RPM for 5 minutes at 4 C. Finally, 24.5 μLof the clarified protein complexes were transferred to PCR tubes and 0.5 μL of 250XSYPRO Orange was added. The final 25 μL reaction mixture contained 2 μM GAPDH,various specified concentrations of cofactor and/or inhibitor (or 2% DMSO for compoundfree samples), and 5X SYPRO Orange. Reaction mixtures were heated in aLightCycler 480 II (Roche) from 20 C to 95 C in increments of 10 C /60 s andfluorescence emitted after excitation at 480nm was recorded at each step. Meltingtemperatures (Tm) were derived from the inflection point of the fluorescence vstemperature curves of each melting reaction.Surface Plasmon Resonance AssayFull-length, N-terminal avi-tagged GAPDH was diluted to 20 μg/mL and immobilized on astreptavidin sensor chip at a flow rate of 10 μL/min for 480 seconds. An average surfacedensity of 4.4 kRU was obtained. All experiments were performed using a Biacore 8Kinstrument (Cytiva). The characterization of KA-GAPDH interactions was conducted at25 C in 10 mM HEPES at pH 7.4, 150 mM NaCl, 0.05% P20, 100 μM NAD , and 2%DMSO. Compounds were injected in multi-cycle experiments for 90 s at a flow rate of 30μL/min, followed by a dissociation phase up to 270 s. KA was tested at a topconcentration of 1000 μM (7-point, 3-fold dilution series). Sensorgrams were doublereferenced (reference surface, blanks) prior to analysis. Kinetic parameters weredetermined as average values based on two replicate experimental series.
VII. Mass Spectrometry Sample Preparation: Identification of Koningic acidtargetsProbe labeling, click chemistry and streptavidin enrichmentJurkat and HeLa cell lysates (500 µL, 2 mg/mL) in DPBS were treated with Koningic acid(1, 5, or 10 µM) or DMSO as a control for 1 hr at RT. DMSO-treated lysates weresubsequently labeled with IA-heavy (100 µM) and Koningic acid-treated lysates werelabeled with IA-light (100 µM). Following probe labeling, lysates underwent clickchemistry. Diazobenzene biotin azide (azo-tag, 200 µM, 100x stock in DMSO), Tris(2carboxyethyl)phosphine hydrochloride (TCEP) (1 mM, 50X fresh stock in water), Tris[(1benzyl-1H-1,2,3-triazol-4-yl)methyl]amine (TBTA ligand) (100 µM, 17X stock in DMSO:tButanol 1:4), and Copper(II) sulfate (1 mM, 50X stock in water) were added to the lysates.The samples were incubated at RT for 1 hr and then spun down for 10 min at 4 C. Thepellets were washed with cold MeOH and resuspended by sonication with the tipsonicator. Samples were centrifuged and washed a second time with MeOH. The pelletswere solubilized in DPBS containing 1.2% SDS via sonication and heating for 5 min at85 C. The solubilized samples were diluted to a final concentration of 0.2% SDS in DPBS(5 mL) and incubated with 100uL of streptavidin-agarose beads for 16 hrs at 4 C withrotation. The samples were warmed to room temperature, pelleted by centrifugation (1400x g, 3 min) and the supernatant was discarded. The strep beads were washed with 0.2%SDS in DPBS (5 mL), DPBS (3 x 5 mL), and water (3 x 5 mL). The beads were pelletedby centrifugation (1400 x g, 3 min) between washes. Washed beads were carried throughon-bead trypsin digestion.On-bead trypsin digestion and diazobenzene cleavageWashed beads were resuspended in 6M urea/PBS (500 µL) containing 10mMdithiothreitol (DTT, 20X stock in water) and heated at 65 C for 20 min. IA (20mM, 50Xstock in water) was added to the samples and incubated at 37 C for 30 min. Followingreduction and alkylation, the beads were pelleted by centrifugation (1400 x g, 3 min) andresuspended in 200µL of 2M urea/PBS, CaCl2 (1 mM, 100X stock in water), and trypsin(2 µg, Promega). Trypsin digestion was performed at 37 C overnight with shaking. Beadswere pelleted by centrifugation (1400 x g, 3 min) and sequentially washed with PBS (500µL x 3) and H2O (500 µL x 3). Labeled peptides were eluted from the beads by sodiumdithionite-mediated cleavage of the diazobenzene of the azo-tag. For this, beads wereincubated with sodium dithionite (50µL, 50mM in PBS) for 1 h at RT. Beads were pelletedby centrifugation (1400 rcf x 3 min) and the supernatant was collected. The cleavageprocess was repeated twice more with 50 mM sodium dithionite (75 µL) and supernatantswere combined with the previous. The beads were then washed twice with water (75 µL)and supernatants were collected and combined with previous. Formic acid (17.5 µL) wasadded to the combined supernatants and the samples we
I. Fmoc-solid-phase peptide synthesis (SPPS) General Procedure Peptides were synthesized by manual solid-phase synthesis on Rink Amide MBHA Resin using fluoren-9-ylmethoxycarbonyl (Fmoc) as the protecting group for all the a-amino functionalities. An OBzl side-chain protecting group was used on Fmoc-phosphoserine