Transcription
Arizona Department of Health ServicesOffice of Prevention and Health PromotionDiabetes Control ProgramDouglas Community Health Survey ReportDouglas, Arizona – 1998November 1999
Jane Dee HullGovernorState of ArizonaJames L. Schamadan, M.D.Acting DirectorArizona Department of Health ServicesThe Arizona Department of Health Services does not discriminate on basis of disability in theadministration of its programs and services as prescribed by Title II of the Americans withDisabilities Act of 1990 and Section 504 of Rehabilitation Act of 1973Suggested citation: Binational Technical Team Working Group. Douglas, Arizona CommunityHealth Survey of 1998, Final Report. Arizona Department of Health Services, Office of Preventionand Health Promotion, Diabetes Control Program. November 1999.Permission to quote from or reproduce from this publication is granted. Acknowledgment andreference to this publication is appreciated.contact person:Tim Flood, MD; Bureau of Public Health Statistics; Arizona Department of Health Services; 2700 NThird Street; Suite #4075; Phoenix, AZ 85004-1186; tflood@hs.state.az.us (602)-542-7333
Final ReportDouglas, Arizona Community Health Survey of 1998This report summarizes the work carried out by the Binational Technical Team Working Group(BWG). The following participating agencies donated personnel time or financial resources to theproject:ADHS, Diabetes Control ProgramADHS, Office of Border HealthADHS, Office of Chronic Disease EpidemiologyCochise County Health Departmentthe Douglas communityOficina de Salud Pública de la Frontera, Sonora-ArizonaSecretaría de Salud de Sonora, MexicoUniversity of Arizona, Arizona Prevention CenterUniversity of Arizona, Rural Health OfficeWe thank all those who worked with the BWG, either representing their organization, providingtheir expertise and/or contributing to the collection of information, including: Jesús Velarde, and JillGuernsey de Zapien, Carol Huddleston, Dra. Mercedes Gameros, Liz Cartwright, Allison Connolly,Katie Careaga, Caroline Hoteling, Dr. Pedro Hoyos, Dr. Mike Lebowitz, Dr. Luis Ortega, NormanPetersen, Dr. Lisa Staten, Dr. Gerardo Mada, Dr. Rene Navarro and Dr. Peter Bennett. This reportwas prepared by staff of the Arizona Department of Health Services: Emma Viera-Negrón, Dr.Cecilia Rosales, Beverly Judie, and Dr. Tim Flood.Funding for the project also was derived in part from the U.S. Centers for Disease Control andPrevention, State-Based Programs to Reduce the Burden of Diabetes and the National Breast andCervical Cancer Early Detection Program (Cooperative Agreements between the ArizonaDepartment of Health Services and CDC).
Table of ContentsABSTRACT . . . . . . . . . . . . . . . . . . . . . . . . . . . . . . . . . . . . . . . . . . . . . . . . . . . . . . . . . . . . . . . . . . 1SURVEY FOR DIABETES AND ITS RISK FACTORS . . . . . . . . . . . . . . . . . . . . . . . . . . . . . . . 2Introduction . . . . . . . . . . . . . . . . . . . . . . . . . . . . . . . . . . . . . . . . . . . . . . . . . . . . . . . . . . . . 2Methods . . . . . . . . . . . . . . . . . . . . . . . . . . . . . . . . . . . . . . . . . . . . . . . . . . . . . . . . . . . . . . . 3Results . . . . . . . . . . . . . . . . . . . . . . . . . . . . . . . . . . . . . . . . . . . . . . . . . . . . . . . . . . . . . . . . 4Demographics . . . . . . . . . . . . . . . . . . . . . . . . . . . . . . . . . . . . . . . . . . . . . . . . . . . . 4Population-Based Information . . . . . . . . . . . . . . . . . . . . . . . . . . . . . . . . . . . . . . . . 5General Health Status and Health Care . . . . . . . . . . . . . . . . . . . . . . . . . . . . . . . . . 5Risk Factors . . . . . . . . . . . . . . . . . . . . . . . . . . . . . . . . . . . . . . . . . . . . . . . . . . . . . . 6Previously Diagnosed Diabetics . . . . . . . . . . . . . . . . . . . . . . . . . . . . . . . . . . . . . . 8Blood Glucose Screen . . . . . . . . . . . . . . . . . . . . . . . . . . . . . . . . . . . . . . . . . . . . . . 8Presumed Diabetics . . . . . . . . . . . . . . . . . . . . . . . . . . . . . . . . . . . . . . . . . . . . . . . . 9Follow-up of Abnormal Glucose Levels . . . . . . . . . . . . . . . . . . . . . . . . . . . . . . . 10Attitude toward Diabetes . . . . . . . . . . . . . . . . . . . . . . . . . . . . . . . . . . . . . . . . . . . 11Discussion . . . . . . . . . . . . . . . . . . . . . . . . . . . . . . . . . . . . . . . . . . . . . . . . . . . . . . . . . . . . 11Limitations of the Diabetes Study . . . . . . . . . . . . . . . . . . . . . . . . . . . . . . . . . . . . 12Comparison to Other Border Communities . . . . . . . . . . . . . . . . . . . . . . . . . . . . . 12Conclusions and Recommendations . . . . . . . . . . . . . . . . . . . . . . . . . . . . . . . . . . . . . . . . 13OTHER HEALTH CONDITIONS STUDIED . . . . . . . . . . . . . . . . . . . . . . . . . . . . . . . . . . . . . . 15Breast and Cervical Cancer Screening . . . . . . . . . . . . . . . . . . . . . . . . . . . . . . . . . . . . . . 15Systemic Lupus Erythematosus (SLE) . . . . . . . . . . . . . . . . . . . . . . . . . . . . . . . . . . . . . . 15ENDNOTES . . . . . . . . . . . . . . . . . . . . . . . . . . . . . . . . . . . . . . . . . . . . . . . . . . . . . . . . . . . . . . . . 17APPENDICES . . . . . . . . . . . . . . . . . . . . . . . . . . . . . . . . . . . . . . . . . . . . . . . . . . . . . . . . . . . . . . . 201.2.3.4.5.6.7.8.Map of US - Mexico Border, including Douglas - Agua PrietaInvitation Letter from Cochise CountyQuestionnaire used in Douglas Community Health SurveyHas a doctor ever told you have.(chronic disease list)Are You Overweight? - Dietary Guidelines for AmericansKey Risk Factors for Diabetes, Arizona BRFS, 1992-1998Explanations From Respondents Who Did Not Believe They Could Do Somethingto Prevent DiabetesDouglas Rate, Age-Adjusted to US Year 2000 population.
ABSTRACTThis report presents the results of a survey that measured the prevalence of diabetes and itsassociated risk factors in Douglas, Arizona, a community bordering the state of Sonora, Mexico.Trained, community surveyors conducted a cross sectional study, using face-to-face interviewsof 915 participants, 20 years of age or older. The study participants were selected from astratified sample of residents of Douglas, Arizona. Data were collected on demographics,medical history, physical activity, nutrition, and body mass index. In addition, the participantsgave a sample of capillary blood that was tested using a portable glucometer. Study participantswith abnormal findings were referred for follow-up with their local physicians.Of the 915 persons interviewed, 93% were of Hispanic origin and 66% were females. Of thetotal number of participants, 102 (11.1%) said they had been diagnosed previously with diabetes.Of the 813 persons who said they were not previously diagnosed, 803 agreed to give a blood testfor glucose. Of these 803 participants who were tested, 21 (2.6%) had elevated glucose levelssuggestive of undiagnosed diabetes mellitus (fasting plasma glucose levels above 110 mg/dl orrandom glucose levels above 200 mg/dl). Follow-up of persons who screened abnormally highwas incomplete, but revealed additional cases of diabetes that we did not count in the estimate ofthe prevalence of diabetes in the community.A diabetes prevalence of at least 13.6% was found among the surveyed population of personsage 20 or older. The blood glucose of 78% of persons previously diagnosed with diabetics wasnot under proper control. Our study methods underestimated the prevalence of undiagnoseddiabetes. Based on the incomplete follow-up of persons with abnormal glucose screening tests,around 20% of persons who said they had not previously been told they had diabetes weresuspected to have diabetes. These findings indicate a need for increased clinical servicesfocused on diabetes.The Douglas community would benefit from health promotion programs that reduce the riskfactors for diabetes. These risk factors include a low level of physical activity, a high prevalenceof overweight and obesity, cigarette smoking, and lack of awareness about consuming a healthfuldiet. We recommend improved care to persons already diagnosed with diabetes. We alsobelieve it is imperative to reduce the risk factors for diabetes among residents who do not yethave diabetes.The report also presents information about medical care and screening for breast and cervicalcancer and lupus received by Douglas residents.1
SURVEY FOR DIABETES AND ITS RISK FACTORSIntroductionThis survey addresses perceptions that the prevalence of type 2 diabetes and its associatedcomplications is elevated in the area of Douglas, Arizona, an Hispanic community at the borderbetween the United States and Mexico.Previous studies have assessed the rate of diabetes in Hispanics, but these studies were notspecific for the border region. For example, the Behavioral Risk Factor Survey (BRFS) inArizona has estimated the prevalence of diabetes among all state residents age 18 and older to beabout 3%.1 The Hispanic Health and Nutrition Examination Survey (HHANES) conductedacross the United States during 1982-84 estimated that the prevalence of previously diagnosedtype 2 diabetes was 2-3% for Hispanic persons ages 20-44, and 14% among those 45-74.Inclusion of undiagnosed cases raised the total prevalence of type 2 diabetes to 3.8% and 24% ofHispanics in those respective age groups.2 The rate of diabetes for Mexican-Americans has beenestimated to be almost twice that of Non-Hispanic Whites.3 Health officials in Douglas perceivethat the prevalence of diabetes is even more common than has been reported in the current BRFSor HHANES of 1982-1984.Risk factors such as hypertension, obesity, early-life weight gain, poor diet, and inactivity havebeen associated with type 2 diabetes. Current literature notes that Mexican-Americans exhibitgreater prevalence of certain type 2-associated conditions (e.g., obesity, hypercholesterolemia)and higher rates of complications (renal failure, amputation, peripheral vascular disease)4,5 andtype 2-related mortality than Anglo diabetics.6 While lower rates of cardiovascularcomplications were once reported for some southwest Hispanics, Arizona Hispanics now exhibitcomparable incidence rates of heart disease and stroke as Non-Hispanic Whites.7Communities along the Arizona-Mexico border (see Appendix 1 for map of the border)increasingly recognize diabetes as a major health issue. They also are interested in knowing theoverall health profile of their inhabitants and the challenges and opportunities available tointervene at the community level. For instance, the community is interested in measuring thelevel of breast and cervical cancer screening and prevalence of lupus erythematosus.To address these issues and specifically to determine the prevalence of diabetes in this area, aBinational Technical Team Working Group (BWG) was formed. The BWG consists ofacademicians, healthcare professionals, and community representatives from Arizona, USA andSonora, Mexico. At the invitation of the Cochise County Health Department (Appendix 2), theBWG chose Douglas, AZ (directly across the border from Agua Prieta, Sonora) as thecommunity to be studied. The BWG developed the study protocol, sampling frame, and datacollection instruments. The BWG currently also is studying diabetes in Agua Prieta, the sistercity to Douglas.2
The town of Douglas covers an 8 square mile area and is located 118 miles southeast of Tucson.Douglas was founded in 1901 as the site for a copper smelter and the city was incorporated in1905. The estimated population of Douglas in 1998 was 15,150 permanent residents.8International commerce is an important part of the local economy; Douglas also has 15manufacturing plants.9MethodsThis study was conducted using a stratified, random, cluster sample, based on US census blocksin Douglas, Az and in the neighboring community of Pirtleville, AZ. (We collectively refer tothese communities as “Douglas.”) Strata were identified by ethnicity (Hispanic/Non-Hispanic)and socio-economic status (SES), as indicated by census block information. The sampling unitwas an occupied housing unit, which was randomly chosen from selected census areas. After 3unsuccessful visits, replacement sampling was used in cases of unoccupied or non-contactedhousing units. Once allowed into a house, the interviewers explained the nature of the study andtook a census of all adult residents. Each adult 20 years of age or older then was asked toparticipate in the study.* That is, more than one person from each household could be eligiblefor participation if they met the age criteria.The BWG developed, translated, and piloted a face-to-face questionnaire during the summer of1997 (see Appendix 3). The survey was conducted by 11 interviewers who were residents ofDouglas. They received three days of training on questionnaire administration, bodymeasurements, pricking a finger to take a sample of capillary blood, and measuring the bloodlevel of glucose by using a portable glucose monitoring device (Sure-Step meter). Datacollection for Douglas, Arizona was conducted from December 1997 to May 1998. Theinterviewers asked about standard demographic items and various health risk factors, such asphysical activity, nutrition, family history, and health practices. The interviewers conducted theglucose screening test and other measurements on the spot at the home of the subjects. The datawere entered into Epi-Info version 6.04, and analyzed using SPSS version 8, and dBase version5.5.*Initially we excluded persons age 75 or older as ineligible for the survey, but about halfway through theproject we allowed persons in this age group to be eligible for inclusion in the sample.3
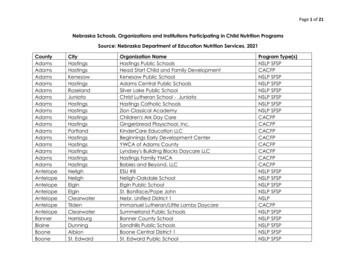
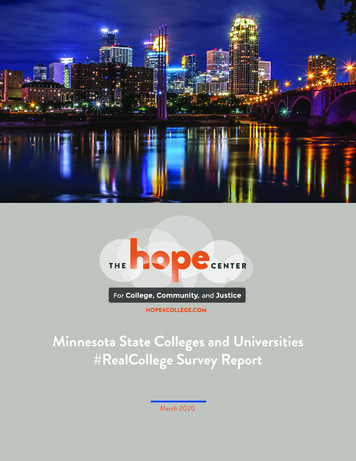
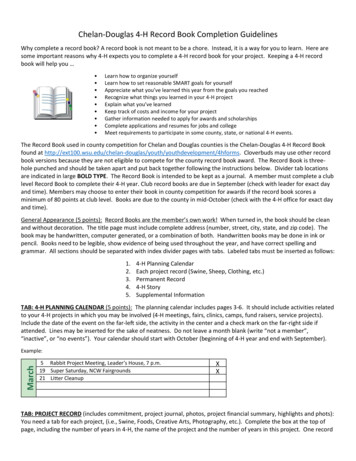
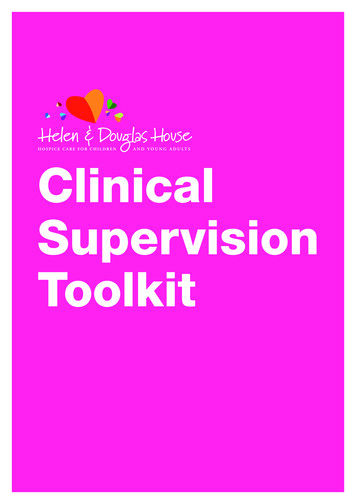
ResultsThe identification, selection, and participationof households and subjects are shown inFigure 1. As indicated in the figure, a total of567 households participated in the survey anda total of 915 persons completed the interviewand provided data for analysis.DemographicsOf the 915 persons interviewed, 608 (66%)were females and 307 (34%) were males. Theage of participants ranged from 20 to 82 yearsof age, with a mean of 45 years and a medianof 43 years. Ninety-three percent (848) of theparticipants said they were of Hispanic originand fifty-nine percent were born in Mexico.Although 70% of the participants read andspoke English, 48% preferred Spanish as thelanguage of communication. In this study,68% of the participants had a spouse or wereliving in consensual union.Figure 1. Selection of participants in the Douglascommunity health survey, 1997-1998.Residents of Douglas displayed a wide rangeof educational experience.Presumably, this reflects awide range of readingcomprehension: 37.5% hadnot completed high school,37% had completed eitherhigh school or vocationaleducation, 17% had a collegeeducation and 9% had eitherno schooling or did notrespond to the question(Figure 2).Figure 2. Educational characteristics of Douglas participants.4Of the 915 participants, 378(41%) were employed outsideof the home, 340 (37%) werehomemakers, 23 (3%) werestudents, 38 (4%) wereunemployed, 58 (6%) were
disabled from working, and 78 (9%) were retired.Population-Based InformationWe compared the demographic information obtained in this Douglas study to the informationfrom the 1990 US Census (Table 1). In ourTable 1. Demographic information.sample, a lower proportion of malesparticipated (34%) than were present in the US1990DouglasCensusStudycensus (47%). However, the age and ethnicGendercomposition of respondents matched well withMales47%34%the 1990 census. This implies that the sampleFemales53%66%was a good representation of the populationfrom Douglas.EthnicityHispanic84%93%General Health Status and Health CareNon-Hispanic16%7%Of the 915 persons interviewed, 72% felt theyAge Groupwere in good, very good, or excellent health20 - 2919.8%18.6%condition. Of the total participants 34% did not30 - 3920.2%23.2%have any health insurance, 23% were enrolled40 - 4915.8%20.9%in Medicaid (AHCCCS) and 18% were enrolled50 - 5914.1%15.8%in a group health plan such as: Cigna,60 - 6915.1%14.5%Intergroup, or others. Of the 915 subjects, 65070 or more15.0%7.0%(71%) said they received their health care in theUnited States and although less than 1% hadMexican health insurance, 196 (21%)mentioned going to Mexico for their healthcare. Of the 650 persons receiving their health care in the U.S., 80% listed the Arizona FamilyCare Association (a local clinic) as their first source of care. Of the 196 respondents receivingtheir health care in Mexico, 94% go to private doctors. Although 92% of the participantsmentioned having a clinic or health center in case of emergency or for routine health care, 19.2%also noted problems getting or using medical services during the past 12 months. The threemajor reasons why people would not get care or health services were: “Did not have insurance,”“No physicians available,” and “The office wait was too long.”Various chronic diseases were identified among this population. Twenty-five percent said theyhad been diagnosed with high blood pressure, 12.8% mentioned circulatory problems, and 23.4%noted arthritis (see Appendix 4).As a measure of encounters with health care systems, the survey asked respondents whether theyhad any visit to a health care provider in the past 12 months. Six hundred sixty-nine persons(73.1% of the entire sample) had a visit during the past year. About one-half or more of the5
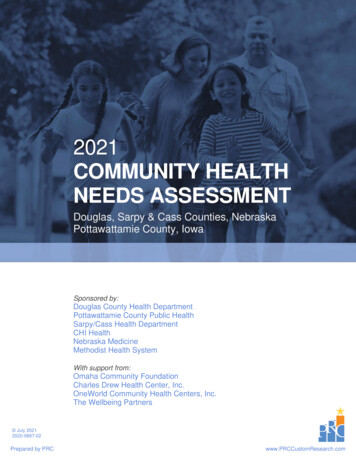
respondents recalled having one or more of the Table 2. Various tests performed during the past 12months among the 915 respondents in Douglas.tests shown in Table 2.Risk FactorsModifiable risk factors play an important role in Blood pressure checkedTest for blood sugardelaying the onset of diabetes and controllingUrine testdiabetes once it occurs. These risk factorsinclude overweight (as measured by a person’s Vision testBody Mass Index, BMI), physical activity,consumption of a healthy diet, smoking, and alcohol consumption.Number and percenttested.695 (76%)470 (52%)484 (53%)409 (45%)Overweight: The BMI describes the relationship between weight and height (namely, a person’sweight in kilograms divided by height in meters squared). The BMI correlates with the amountof body fat. The American Health Foundation recommends a “healthy weight range,” defined asa BMI less than 25 for individuals 20 years of age or older. A BMI between 19 and 25 is definedas the “healthy weight range” in the Dietary Guidelines for Americans (see Appendix 5).10Among participants in this study, the median weight was 75.2 kilograms (165 pounds), and themedian height was 64.2 inches (5'4").This translates to a median communityBMI of 28.3 among the persons surveyed.An ideal weight for this height should bebetween 105 - 140 pounds to produce aBMI between 19 and 25. As shown inFigure 3 there were 344 (38.2%)participants who were overweight (BMI25 - 29.9), and 311 (34.5%) participantswho were obese (BMI of 30 or more).Alternatively, the Behavioral Risk FactorSurvey classifies a person as overweightif a man’s BMI exceeds 27.8 or awoman’s BMI exceeds 27.3. Accordingto these criteria, 49.2% of the men and54.8% of the women in the Douglassurvey were overweight. For comparison,the BRFS in 1998 has found that 21.6%of adult Arizonans are overweight,according to these criteria.11Figure 3. Classification of interviewed subjects fromDouglas according to their Body Mass Index (BMI) andthe new Dietary Guidelines for Americans.6
Physical activity: Physical activity was measured through various factors such as means oftransportation, work activities, home activities and leisure activities. After combining thesefactors in the analysis, only 32.6% of the population are considered to be physically active withdaily physical activity that lasted 20 minutes or more (Figure 4). However, 83% of theparticipants said they walked, moved or lifted objects at their work place. The most commonoccupations were housewife, construction, and factory work. The most common leisureactivities among the participants wererunning, dancing, and bicycling. Thecommunity appears to be a logical place toPhysical Activityimplement a program to address the high rate70%of obesity and sedentary lifestyle using some67.4%60%existing intervention programs and models.1250%Fruit and vegetable consumption: Of the 915participants, only 229 (25%) think that 5 or32.6%30%more servings of fruits and vegetables shouldbe eaten each day for good health. An even20%lower proportion (24%) of the previously10%diagnosed diabetics thought that 5 or more0%servings should be eaten for good health.ActiveNot ActiveNevertheless, we calculate that 34% of the915 participants are eating 5 or more servingsFigure 4. Activity level of subjects interviewed fromDouglas in 1998.of fruits and vegetables per day, 5% of theparticipants eat less than one or no serving offruits and vegetables per day, 29.5% eat one but less than 3 servings per day, and 31.6% eat 3 to4 servings of fruits and vegetables per day.40%Appendix 6 summarizes the statewide information from the Behavioral Risk Factor Survey aboutBMI, physical inactivity, and lack of consumption of 5-a-day.Tobacco and alcohol use: Additional risk factors for diabetes and other chronic diseases aresmoking and alcohol consumption. Of the total respondents, 23.2% currently smoked, and anadditional 19% had smoked in the past. Among current smokers, the average number ofcigarettes smoked was one-half pack per day. For comparison, the 1997 BRFS found that about21.0% of Arizona adults are currently smokers. Of the 915 respondents, 78 (8.5%) reportedchronic drinking behavior (two or more drinks of alcohol per day, i.e., 60 or more per month).This percent is higher than the 2.6% reported in the 1997 Arizona BRFS.13 In terms of bingedrinking behavior, 13.9% of the respondents mentioned drinking five or more drinks on one ormore occasions during the previous month. In contrast, 8.8% of the Arizona adult populationreported such binge intake in the 1997 BRFS.Previously Diagnosed Diabetics7
Of the 915 subjects interviewed, 102 (11.1%) replied that they had been told by a physician theyhad diabetes or high blood sugar.* The mean age was 57 years for the 102 participants that selfreported a diagnosis of diabetes. Their median age was 58 years. Of the 102 individualspreviously told they had diabetes, 75 (73.5%) were presently under medical treatment for theirdiabetes, 14 (13.7%) were medically treated at one time but not at the present time and 13(12.7%) had never being medically treated. Of these 102 subjects, 69 (67.6%) went to a healthcare provider for care related to their diabetes during the last 12 months.Of those presently under medical treatment, 59 (57.8%) used pills, 14 (13.7%) used insulin, and3 (2.9%) used both a combination of pills and insulin. Seventy-three (71.6%) diabetics said thatthe health care provider gave them instructions about dietary control, but only 48 (65%)mentioned they always followed the recommendations. Seventeen of the diabetics reportedusing alternative treatments (e.g., herbs, teas, or other non medical treatments) in addition to theuse of pills, insulin or dietary control. Only 45 (44.1%) individuals noted that a doctor hadexamined their feet during the past 12 months.Blood Glucose ScreenOf all the 915 participants, 903 (99%) agreed to give a drop of capillary blood from a finger stickto be used for a blood glucose screening test. The results of this test ranged from 24 mg/dl to498 mg/dl. The distribution of glucose results is shown in Table 3. Of the 903 persons tested,only 76 (8.4%) were fasting at the time of the finger stick. The fasting results ranged from 28mg/dl to 333 mg/dl. Of the participants screened under fasting conditions, 14 (18.4%) had anelevated glucose level ( 110 mg/dl).Table 3. Glucose level of participants, by fasting and diabetes status.Previously Diagnosed with Diabetes,n 100*Glucose Level,mg/dlFastingNo. (%)Not Previously Diagnosed withDiabetes, n 803**RandomNo. (%)FastingNo. (%)RandomNo. (%)1 (1)9 (1)19 (2)14 (14)52 (6)433 (54)110 - 1253 (3)4 (0.5)141 (18)126 - 1393 (3)2 (0.2)70 (9)1 (0.1)56 (7)Less than 7070 - 1091 (1)140 - 1994 (4)21 (21)200 or more3 (3)50 (50)Total8 (8)92 (92)16 (2)68 (8.5)735 (91.5)**10 persons refused testing and are not counted here.*2 persons refused testing and are not counted here.The table shows that 78 (78%) of the persons previously diagnosed with diabetes did not have*An additional 19 persons said a doctor had told them they had diabetes, but it was during a pregnancy andnot at any other time. We did not consider this information by itself as sufficient to classify these persons as havingdiabetes.8
their glucose under control (i.e., fasting glucose level 80-120 mg/dl; random glucose level 100140 mg/dl). Of the participants saying they had not been diagnosed with diabetes, 149 (18.6%)were found to have elevated glucose levels (fasting level 110 or random level 126 mg/dl).Presumed DiabeticsFor the purpose of analysis in this section, we define a person to have diabetes or an abnormalglucose test if: 1) they said a doctor previously told them they had diabetes or high blood sugar,*or 2) we found a fasting glucose level of 126 mg/dl or higher on our screening test, or 3) wefound a random glucose level of 200 mg/dl or higher. We defined a person to have ImpairedFasting Glucose if the fasting level was greater than or equal to 110 mg/dl and less than 126mg/dl . Based on these criteria, there were 123 persons surveyed whom we classify as diabeticor whose glucose result was abnormal (Table 4). For purposes of analysis, we defined these 123persons as “presumed diabetics.” Of the 123 persons, 102 were previously known to havediabetes, and 21 were not previously known to have diabetes.Table 4. Number, with percentage of each age group shown in (), of surveyed population from Douglas, 20 years of age, with diabetes mellitus or an abnormal glucose screening test.&AGE GROUPn number in samplePreviously Diagnosed with Diabetes20-39n 37940-49n 18850-59n 14460-74n 18975 n 5 20n 90512 (3.2)13 (6.9)29 (20.1)46 (24.3)2 (40)102 (11.3)Abnormal Glucose Test, but Not Previously Known to be DiabeticSuspected Undiagnosed Diabetic(Fasting 126)Elevated Random Glucose(Random 200)Impaired Glucose Tolerance(Fasting 110 and 126)&1 (0.3)02 (1.4)003 (0.3)01 (0.5)4 (2.8)9 (4.8)014 (1.5)1 (0.3)1 (0.5)1 (0.7)1 (0.5)04 (0.4)The figures exclude ten persons who refused to take the screening glucose test.The glucose test in this study was used for screening and to establish an epidemiologic,presumptive diagnosis of diabetes as described above. However, a definitive, clinical diagnosiswould require an elevated fasting plasma glucose level found on different days.14 Theuncertainties inherent in the device used to measure blood glucose also should be consideredhere. Glucose was measured by using a monitoring device (glucometer) approved by the Foodand Drug Administration. Like many of these meters, the Sure-Step meter tests for the level ofglucose in capillary (whole) blood. It does not measure glucose in the plasma. Plasma glucosevalues are 10-15% higher than whole blood values.14*The 19 women who said they only were told they had diabetes or high blood sugar during a pregnancybut not at another time are not presumed to be diabetics unless their screening glucose test was elevated.9
Table 5. Profile of the presumed diabetics compared to nonThe profile of the 123 presumed diabetics (as defined in the previous diabetics from Douglas, 1998.PresumedNon Diabeticstable) compared to persons withoutDiabetics n 123n 782diabetes is shown in Table 5. TheMale48 (39.2%)253 (32.4%)presumed diabetics appear to be75 (60.9%)529 (67.6%)considerably older, but are similar in Femaleother demographic characteristics.Among persons with diabetes, 70.7%have insurance. This is similar to the65.7% of persons without diabeteswho have insurance. This findingmay reflect the older median age ofthe presumed diabetics, and a highernumber who are insured throughMedicare.Hispanic117 (95.1%)722 (92.3%)6 ( 4.9%)60 ( 7.7%)20-3914 (11.4%)365 (46.7%)40-4915 (12.2%)173 (22.1%)50-5936 (29.3%)108 (13.8%)60-7456 (45.5%)133 (17.0%)Non HispanicAge GroupOf the 123 presumed diabetics, there75 2 ( 1.6%)3 ( 0.4%)were at least 109 who responded thatMedian age58 years old41 years oldthey had any visit to a health careprovider in the past year. Thisagrees with our finding that a veryInsured87 (70.7%)514 (65.7%)high proportion (93.5%; 115 of theNot Insured36 (29.3%)278 (35.5%)123) of persons whom we presume The figures exclude 10 persons who refused theto have diabetes also said they had ascreening glucose test.one or more of the screening tests(Table 2) performed in the past 12months. A lower proportion (77.8%) of the presumed non diabetics had one of these tests.In contrast, of the 102 persons with previously diagnosed diabetes only 69 (67.6%) say they hada health care visit for care related to their diabetes. Current recommendations are for medicalevaluation directed toward diabetes at least annually. The findings in our study indicate that thepreviously diagnosed diabetics are not receiving care directed toward controlling diabetes asfrequently as is recommended.Follow-up of Abnormal Glucose LevelsThere were 149 subjects not previously known to have diabetes whose screening glucose levelwas elevated: fasting levels 110 mg/dl or random levels 126 mg/dl. The interviewersinstructed these persons to see a physician for follow-up evaluation. Three months afterconducting the glucose test in the home, the interviewers attempted to re-visit these participantsto verify whether they followed the recommendation to “see a physician.” Ninety-one of these149 participants either were untraceable (25 persons), or had not yet followed ourrecommendat
The Arizona Department of Health Services does not discriminate on basis of disability in the administration of its programs and services as prescribed by Title II of the Americans with Disabilities Act of 1990 and Section 504 of Rehabilitation Act of 1973 Suggested citation: Binational Technical Team Working Group. Douglas, Arizona Community