Transcription
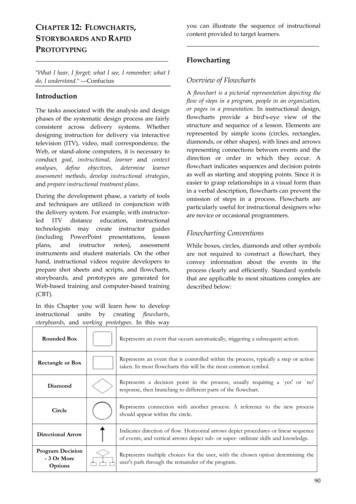
CHAPTER 12: FLOWCHARTS,STORYBOARDS AND RAPIDPROTOTYPINGyou can illustrate the sequence of instructionalcontent provided to target -------------------------Flowcharting"What I hear, I forget; what I see, I remember; what Ido, I understand." ---ConfuciusOverview of FlowchartsIntroductionThe tasks associated with the analysis and designphases of the systematic design process are fairlyconsistent across delivery systems. Whetherdesigning instruction for delivery via interactivetelevision (ITV), video, mail correspondence, theWeb, or stand-alone computers, it is necessary toconduct goal, instructional, learner and contextanalyses, define objectives, determine learnerassessment methods, develop instructional strategies,and prepare instructional treatment plans.During the development phase, a variety of toolsand techniques are utilized in conjunction withthe delivery system. For example, with instructorled ITV distance education, instructionaltechnologists may create instructor guides(including PowerPoint presentations, lessonplans, and instructor notes), assessmentinstruments and student materials. On the otherhand, instructional videos require developers toprepare shot sheets and scripts, and flowcharts,storyboards, and prototypes are generated forWeb-based training and computer-based ------------------------------A flowchart is a pictorial representation depicting theflow of steps in a program, people in an organization,or pages in a presentation. In instructional design,flowcharts provide a bird's-eye view of thestructure and sequence of a lesson. Elements arerepresented by simple icons (circles, rectangles,diamonds, or other shapes), with lines and arrowsrepresenting connections between events and thedirection or order in which they occur. Aflowchart indicates sequences and decision pointsas well as starting and stopping points. Since it iseasier to grasp relationships in a visual form thanin a verbal description, flowcharts can prevent theomission of steps in a process. Flowcharts areparticularly useful for instructional designers whoare novice or occasional programmers.Flowcharting ConventionsWhile boxes, circles, diamonds and other symbolsare not required to construct a flowchart, theyconvey information about the events in theprocess clearly and efficiently. Standard symbolsthat are applicable to most situations complex aredescribed below:In this Chapter you will learn how to developinstructional units by creating flowcharts,storyboards, and working prototypes. In this wayRounded BoxRepresents an event that occurs automatically, triggering a subsequent action.Rectangle or BoxRepresents an event that is controlled within the process, typically a step or actiontaken. In most flowcharts this will be the most common symbol.DiamondRepresents a decision point in the process, usually requiring a yes' or no'response, then branching to different parts of the flowchart.CircleRepresents connection with another process. A reference to the new processshould appear within the circle.Directional ArrowIndicates direction of flow. Horizontal arrows depict procedures or linear sequenceof events, and vertical arrows depict sub- or super- ordinate skills and knowledge.Program Decision- 3 Or MoreOptionsRepresents multiple choices for the user, with the chosen option determining theuser's path through the remainder of the program.90
Why Flowchart?The ability to construct, read, and interpretflowcharts is a necessary skill for all instructionaltechnologists. Flowchart symbols are universallyrecognized across multiple disciplines, and will allowan instructional designer to communicate a great dealof information accurately, efficiently, and succinctly.In addition, programmers and software andmultimedia designers routinely use flowcharts toillustrate software capabilities, required userperformance (input), and computer response(output). The high level of interactivity andbranching involved in educational software inparticular belies the need for instructionaltechnologists to be comfortable with flowchartingprotocol.The following text conveys the same instructionsas the flowchart that follows it. Which do youthink provides a better understanding of theinstructional flow?Dial 0, then your friend's number. You will hear atone. If you have a calling card number, dial your homephone number and the PIN number. If you don't havea calling card number, dial the 800 collect number.When the computer voice asks you to say your name,say your name. Wait for your friend to answer. If youhave a calling card number, leave a message on yourfriend's answering machine. If you don't have a callingcard number, hang up.Drawing FlowchartsThere is not a rigid set of rules for constructingflowcharts, but the following six steps serve asguidelines to ensure consistency and accuracy.Note how each step has been applied in theexample, and consider the implications for thedifferent phases in the systematic design process.1.Describe the process to be charted in aone-line statement. Example: "How to fillthe car's petrol tank."2.Start with the 'trigger' event that initiatesthe process. Example: "Low fuel warninglight comes on."3.Note each successive action in conciseterms, avoiding ambiguous descriptions.Example: "Locate and drive into servicestation," etc.4.When the flowchart branches into acomplex number of options, choose themost important alternative and continue.Additional detail can be provided in othercharts without subverting the efficiency ofthe main idea. Example: "Decisionrequired: Quantity of fuel to be put intotank."5.Make cross references to supportinginformation. Example: A cross-referencemay be made to a list of cars requiringunleaded fuel, a table of preferred brandsof fuel.6.Continue describing each event, action, ordecision as it occurs in sequence, until theprocess is concluded (a 'target' point).Example: "Fuel is paid for, tank is filled,customer exits the station."
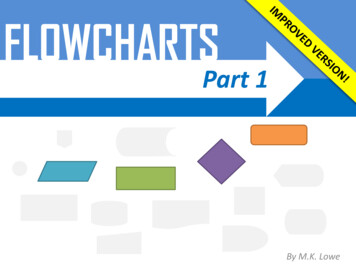
calendars are added, culminating in a simulatorrunning the process to indicate the movement ofinformation.For more information about flowchartingsoftware, check the following Web aProject osoft.com/office/visio/Guidelines for Flowcharting in InstructionalDesignFlowcharting SoftwareMany think of flowcharts in terms of their originalform, depictions of an algorithm's logic path,hand-drawnbycomputerprogrammers.However, a flowchart's usefulness goes wellbeyond mathematical functions. As a means ofrepresenting a process from beginning to end,whether that process is an algorithm, procedure, or aninstructional unit, the tool once used exclusively byprogrammers has become a fundamental part ofinstructional design.When flowcharts were constructed by hand,making changes was difficult and messy. Asgraphic programs became easier to manipulate,and the educational and business communitiesrealized flowcharting software's potential,enterprising developers responded with a varietyof packages for desktop computers.Applications that include real-time or time-criticalprocesses require dynamic process modeling.Programs such as ProcessCharter and Optima!allow users to create complex interactive modelsand observe how they perform over time. Aprocess flowchart is created, and resources andTo flowchart an entire course, it would benecessary to establish a complete sequence offrames and a navigation scheme. Depending uponthe scope of the course and the number of useroptions, this can be a time consuming process,requiring extensive organization and foresight.Without a clear and intuitive structure andnavigation system, visitors to the site will havedifficulty maneuvering and will either get lost orleave in frustration. One benefit of authoringsystems is that this job is usually simplified by apre-existing framework.Figure 11.1: An example of Flowchart in InstructionalDesignDistance learning instruction typically consists ofmultiple, linked pages, with a clear and intuitivenavigation scheme. In creating flowcharts forinstructional units, you examine the content todetermine the number and sequence of sections,92
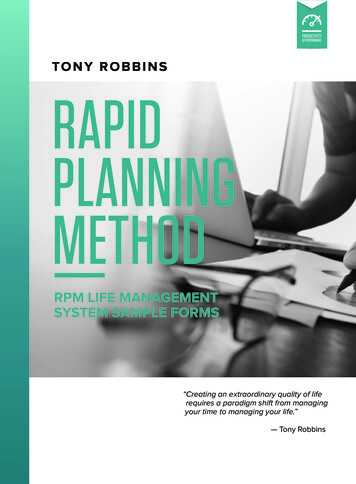
using the events and interactions defined in theInstructional Treatment Plan (resuly of GoalAnalysis). Each event or related group of events isusually represented by one box. As you constructyour flowcharts, check for clarity and accuracy inthedepictionofthesequenceandinterrelationship of the Web pages.instructional strategy created in Table 11.1, anadditional column has been added to illustrate thegrouping of information and events. Typicalcourses would also include separate pages foreach event as indicated in the "Media Selection"column.Figure 11.2: Example of Flowchart in InstructionalDesignThe flowcharting process should be informed bythe specifications, events, and interactionsidentified in the instructional treatment plan andthe instructional strategy. In the samplePageEventFigure 11.3: Example of Flowchart in Virtual 1Provide TaskOverviewSet analysis in context of previous tasks and systematic design process.Describe analysis tasks, provide rationale for completing tasks anddelineate time requirements.LearnerContentWeb Page1Inform Learnersof ObjectivesList terminal and enabling objectives.LearnerContentWeb Page1Inform Learnersof PrerequisitesDescribe desired prior skills and knowledge related to systematic design(goal, instructional, learner and context analyses). Also list requiredknowledge or access subject matter expertise, target audience and context.LearnerContentWeb PageLearnerContentWeb PageLearnerContentWeb PageLearnerContentWeb Page EMail BBSList Required Materials.1.11List RequiredMaterialsDescribe Processincluding use ofPerformanceSupportInterfaceRead Dick, Carey and Carey (2000) Chapter 1Introduction to Instructional Design (p. 2-13).2.Alternative forms of performance support for eachtype of analysis; and3.Training modules provided for each analysis.Inform learners to start by reviewing the performance criteria, job aidsand some examples associated with the task. Tell learners that if theyfeel confident in their ability to complete the task and meet theperformance criteria, they should go directly to the assignment. However,if learners are not confident in their ability to complete the task, suggestthat they discuss the task with others (using the communications link)and/or go through the available training.Present learners with direct links to:1Provide DirectAccess toPerformanceSupport Tools TaskPerformance CriteriaExamplesGoal statement and analysis chartInstructional analysis map93
Learner analysis report Context analysis report Communication links Email to instructor Email to follow classmates Email to others Course BBS Job Aids Job aid for clarifying fuzzy goals Flowcharting conventions Learner analysis template Context analysis template Training Goal statement & analysis Instructional analysis Learner analysis Context analysisIf learners are working in a group, instruct them to review and discussthe individual analysis reports generated by teammates and determineprocess for generating and posting one report for your team.LearnerLearnerE-MailStudent WebSitesInform learners to post at least one question or comment about goal,instructional, learner or context analyses and respond to at least oneother posting in the appropriate location of the course bulletin ruct learners to complete assignment and provide directions forsubmitting and/or posting their work.LearnerInstructorWeb PageStudent WebSites3PerformanceSupportPresent performance criteria for assessing the quality of completedassignments.LearnerContentWeb Page20AssessPerformance &ProvideFeedbackAssess learners’ assignments and provide feedback based on performancecriteria as soon as possible.LearnerInstructorStudent WebSitesEmail1Promote SocialInteraction1Promote SocialInteraction2Table 11.1 - Instructional Strategy ExampleFlowcharts should depict the sequence of theinstruction in the instructional unit in a clear andunambiguous manner. Figure 11.4(a) illustratesframes or pages presented to students in a linearformat, while Figure 11.4(b) depicts a non-linearnavigation scheme. A linear format decreases thechances that students will accidentally miss orskip information. However it also restrictsstudents to viewing and reviewing content in aparticular order and format. Non-linearnavigation provides students with greaterflexibility, but requires careful planning to ensurethat information is divided into logical andmeaningful "chunks." It is also important toensure that students can navigate through all ofthe pages without getting lost or overwhelmed bythe sheer volume of information.Figure 11.4(a):Linear navigationFigure 11.4(b): Non-linearnavigationOrganizing content into hierarchies (Figure 11.5)facilitates effective design and management ofinformation. With a typical, multiple page site,determining the most appropriate way forstudents to progress through the information iscritical. A thoughtful analysis of the flowchartprovides perspective on the balance of depth (thenumber of levels of content) and breadth (thenumber of aspects or topics covered) of thecontent.94
StoryboardingOverview of StoryboardingFigure 11.5: Example of a content hierarchySummarySince humans are primarily a visual species, apicture of a process conveys information moreefficiently than a written or verbal description.Making a process visible also renders it easier tomanage and captures the subtle interactionsamong components. Flowcharts iden
Overview of Flowcharts A flowchart is a pictorial representation depicting the flow of steps in a program, people in an organization, or pages in a presentation. In instructional design, flowcharts provide a bird's-eye view of the structure and sequence of a lesson. Elements are