Transcription
TSX: LUN Nasdaq Stockholm: LUMIBank of America Merrill LynchGlobal Metals, Mining & Steel ConferenceMay 2019Candelaria, Atacama Region, Chile
Cautionary StatementsCaution Regarding Forward-Looking Information and Non-GAAP Performance MeasuresCertain of the statements made and information contained herein, other than statements of historical fact and historical information, is “forward-looking information” within the meaning of applicable Canadian securities laws.Forward-looking information includes, but is not limited to, statements with respect to the intentions of Lundin Mining Corporation (the “Company” or “Lundin Mining”) regarding the acquisition of the Chapada Mine (the“Acquisition“) and other strategic growth opportunities, the anticipated timing and completion of the Acquisition, the ability of Lundin Mining to complete the transactions contemplated by the Acquisition, life of mine, delivery ofshareholder returns and value added by projects. Words such as “advancing”, “believe”, “benefits”, “contingent”, “creating”, “delivery”, “expandable”, “expansions”, “expected”, “further”, “future”, “grow”, “guidance”, “improve”,“increase”, “intend”, “leading”, “may”, “opportunities”, “potential” and “project” or variations of these terms or similar terminology or statements that certain actions, events or results will, could or may occur or be achieved areintended to identify such forward-looking information. Although the Company believes that the expectations reflected in the forward-looking information contained herein are reasonable, these statements by their natureinvolve risks and uncertainties, and are not guarantees of future performance. Forward-looking information is based on a number of assumptions, and subject to a variety of risks and uncertainties which could cause actualevents or results to differ from those reflected in the forward-looking statements. Risks include but are not limited to the risk that the conditions to the Acquisition will not be satisfied on a timely basis or at all and the failure ofthe Acquisition to be consummated for any other reason, competitive responses to the announcement of the Acquisition, actions that may be taken by Yamana or by its security holders in respect of the Acquisition, as well asadditional risks disclosed in filings made by the Company with Canadian securities regulatory authorities. There can be no assurance that the Acquisition will be successful or that, if successful, the combination of theoperations of Lundin Mining and the Chapada mine will achieve the anticipated benefits. Should one or more of these risks and uncertainties materialize, or should underlying assumptions prove incorrect, actual results mayvary materially from those described in forward-looking statements. Accordingly, readers should not place undue reliance on forward-looking statements. The Company disclaims any intention or obligation to update or reviseany forward-looking statements or to explain any material difference between subsequent actual events and such forward- looking statements, except to the extent required by applicable law.Forward-looking information and statements are subject to a variety of known and unknown risks and uncertainties, and ultimately, actual events or results may differ materially from those reflected in the forward-lookinginformation. Risks and uncertainties that may impact the Company’s performance include, without limitation, risks associated with operating in foreign countries; uncertain political and economic environments; communityactivism, shareholder activism and risks related to negative publicity with respect to the Company or the mining industry in general; changes in laws, regulations or policies including but not limited to those related tooperations, permitting and approvals, environmental management, labour, trade relations, and transportation; risks associated with business arrangements and partners over which the Company does not have full control;risks associated with acquisitions and related integration efforts; competition; development or mining results not being consistent with the Company’s expectations; estimates of future production; operating and cash costsestimates; allocation of resources and capital; litigation; uninsurable risks; volatility in metal prices; the estimation of asset carrying values; funding requirements and availability of financing; indebtedness; foreign currencyfluctuations; interest rate volatility; changes in the Company’s share price, and equity markets, in general; changing taxation regimes; counterparty and credit risks; health and safety risks; risks related to the environmentalimpact of the Company’s operations and products and management thereof; unavailable or inaccessible infrastructure and risks related to ageing infrastructure; risks inherent in mining including but not limited to risks to theenvironment, industrial accidents, catastrophic equipment failures, unusual or unexpected geological formations, or unstable ground conditions; actual ore mined varying from estimates of grade, tonnage, dilution andmetallurgical and other characteristics; ore processing efficiency; risks relating to attracting and retaining of highly skilled employees; ability to retain key personnel; the potential for and effects of labour disputes or otherunanticipated difficulties with or shortages of labour or interruptions in production; the price and availability of energy and key operating supplies or services; the inherent uncertainty of exploration and development, and thepotential for unexpected costs and expenses; risks associated with the estimation of Mineral Resources and Mineral Reserves and the geology, grade and continuity of mineral deposits including but not limited to modelsrelating thereto; natural phenomena such as earthquakes, flooding, and unusually severe weather; potential for the allegation of fraud and corruption involving the Company, its customers, suppliers or employees, or theallegation of improper or discriminatory employment practices, or human rights violations; security at the Company’s operations; breach or compromise of key information technology systems; materially increased orunanticipated reclamation obligations; risks related to mine closure activities; risks related to closed and historical sites; title risk and the potential of undetected encumbrances; risks associated with the structural stability ofwaste rock dumps or tailings storage facilities; and other risks and uncertainties, including but not limited to those described in the “Risk and Uncertainties” section of the Company’s AIF and the “Managing Risks” section ofthe Company’s annual MD&A, which are available on SEDAR at www.sedar.com under the Company’s profile. Readers are cautioned that the foregoing list is not exhaustive of all factors and assumptions which may havebeen used. Should one or more of these risks and uncertainties materialize, or should underlying assumptions prove incorrect, actual results may vary materially from those described in forward-looking information.Accordingly, there can be no assurance that forward-looking information will prove to be accurate, and so readers are advised not to place undue reliance on forward-looking information. The forward-looking informationcontained herein speaks only as of the date of this presentation. The Company does not undertake to update such forward-looking information unless required under applicable laws.This presentation may contains certain financial measures such as net cash, net debt, operating cash flow per share, co-product cash costs and cash costs which have no standardized meaning within generally acceptedaccounting principles under IFRS and therefore amounts presented may not be comparable to similar data presented by other mining companies. This data is intended to provide additional information and should not beconsidered in isolation or as a substitute for measures or performance prepared in accordance with IFRS.Note: All dollar amounts are in US dollars unless otherwise denoted.2
Lundin MiningOur StrategyOperate, upgrade and grow abase metal portfolio that providesleading returns for ourshareholders throughout the cycle– copper dominant– competitive cost position– low-risk mining jurisdictions,leverage current geographies– pipeline of development andexploration projects– maintain low leverage andflexible balance sheetOur OperationsFreeport Cobalt1Cobalt opper-Gold-Silver(Chile)1. Lundin Mining holds an indirect 24% equity stake in the Freeport Cobalt Oy business which includes a cobalt refinery located in Kokkola, Finland.2. Lundin Mining holds an 80% interest in Candelaria.3. Announced acquisition. Please refer to press release “Lundin Mining to Acquire Chapada Copper-Gold Mine in Brazil” dated April 15, 2019.3
Responsible MiningSafety– overall safety performance betterthan target for sixth consecutive year– first-quartile performanceSocial– positive stakeholder engagementand increased social investment– achieved top ISS Environment &Social Quality ScoresEnvironmental– robust risk and compliancemanagement programs in place– excellent track record and improvingperformance each yearTotal Recordable Injury Frequencyper 200,000 person hours 1420150.60.60.7201620172018
Q1 2019 Summary ResultsProduction––––46,122 t of copper40,446 t of zinc4,213 t of nickel7,485 t of leadSales (payable)––––41,830 t of copper31,423 t of zinc1,691 t of nickel5,150 t of lead 416M in Sales––––Candelaria Open Pit564% copper20% zinc6% nickel2% lead
Financial HighlightsRealized Metal Prices1Q1 2019Q1 2018ΔCopper 3.11/lb 2.93/lb6%Nickel 8.37/lb 6.04/lb39%Zinc 1.38/lb 1.51/lb(9%)Q1 2019Q1 2018ΔRevenue 416M 470M(11%)Gross Profit 141M 150M(6%) 52M 0.07/sh 81M 0.11/sh(36%)( 0.04/sh) 62M 173M(64%) 139M 0.19/sh 170M 0.23/sh(18%)( 0.04/sh)C 0.03/shC 0.03/sh-Summarized Financial Results2Attributable Net Earnings from Continuing OperationsCash Flow from OperationsOperating Cash Flow (before working capital)Dividends Declared1. LUN average realized price, including impact of provisional price adjustments.2. Operating Cash Flow is a non-GAAP measures. Please see Lundin Mining’s MD&A for the three months ended March 31, 2019 for discussion on non-GAAP measures.6
CandelariaOn Track to Achieve Full-Year Guidance– mill throughput and mining rates exceeded plan– produced 32,778 t of copper at 1.62/lb cash cost– copper head grades to increase in the H2 as moremill feed is sourced directly from open pitCopper Production & Cash Cost Outlook(100% basis; kt & /lb Cu, net of by-product credits)175-185165-175Fleet Reinvestment, Mill Optimization and SouthSector Development Progressing Well– 70% of new open pit mine fleet received and inservice. Remaining equipment to be deliveredmainly in 2019145-155135 1.68– Candelaria Mill Optimization Project 45% complete– South Sector underground development continuesto progress well with start-up projected by end of Q32018A 1.6020192020202168% of Candelaria’s total gold and silver production are subject to a streaming agreement and as such 2019 C1 cash costs guidance is based on receipt of 408/oz and 4.08/oz respectively, on the streamed portion gold and silver sales.7
Neves-Corvo & ZEPStrong Mine and Mill Operating Performance– produced 8,868 t of copper and 18,773 t of zinc at 0.92/lb copper cash cost– ore mined and processed greater than planned– copper grade lower than plan on resequencing ofmassive sulphide stopesCopper, Zinc Production & Cash Cost Outlook(kt & /lb Cu, net of by-product credits)155-160120-130Zinc Expansion Project Advancing– overall 54% complete at quarter end– 170M spent through Q1 2019 of 385M ( 320M) totalproject capital cost (preproduction of 365M or 305M)– careful monitoring of timeline and cost is ongoing toensure the project remains on track– scheduled to commence commissioning in the firstquarter of 2020871-767546 1.282018A40-4541-4641-46 1.702019Copper2020ZincCash Cost2021
ZEP – Underground ConstructionBreakthrough of Ramps 6 and 7Development of Under Ground Electrical Room9
ZEP – Underground ConstructionTransfer Tower #3Transfer Tower #310
ZEP – Zinc Plant & Surface ConstructionFlotation and Filtration BuildingsFlotation Cell Installation11Paste Thickener
Eagle & Eagle EastStrong Performance Despite Weather Impacts– produced 4,213 t of nickel and 3,897 t of copper at 0.37/lb nickel cash cost– ore transport to mill and concentrate transportimpacted by extreme weather conditionsin first quarterNickel, Copper Production & Cash Cost Outlook(kt & /lb Ni, net of by-product credits)19-221816-191813-1612-15 12-15Strong Progress Advancing Eagle East– ramp and vertical raise developmentprogressed well– first ore expected in Q4 201914-17 2.20 1.01Refocused Exploration Program2018A– four rigs drilled over 8,850 m in Q1– focus shifting from near-mine to regional targets.30,000 m of drilling planned– exploration cost guidance reduced to 15M2019Nickel12Copper2020Cash Cost2021
ZinkgruvanRecord Zinc Production in March– produced 21,673 t of zinc, 5,832 t of lead and579 t of copper at 0.44/lb zinc cash costZinc Production & Cash Cost Outlook(kt & /lb Zn, net of by-product credits)– remain focused on mine planning andexecution76-8175-8076-812020202177Ramp-Up of Exploration Activities– over 12,400 m drilled in first quarter with sixsurface and three underground rigs 0.34– 2019 23M budget with 78,000 m of drillingplanned from surface and underground– highest exploration priority to expand andupgrade the Mineral Resource estimate of theDalby mineralization12018A1. Refer to news release “Lundin Mining Announces 2018 Mineral Resource and Mineral Reserve Estimates” dated September 6, 2018. See also slide 29.13 0.402019
2019 Capital & Exploration Expenditure GuidanceCapital Expenditures– unchanged from previous guidanceExploration– 70M to be invested in 2019 in exploration programs,reduced from previous guidance of 80M– change in focus from near-mine targets at Eagle toregional targets with fewer drill rigs– over 200,000 m of drilling plannedCapital Expenditures1 (US M)Capitalized Stripping2130Los Diques TSF10New Mine Fleet Investment75Candelaria Mill Optimization Project50Candelaria UG South Development40Other Candelaria Sustaining70Total Candelaria (100% basis)375Eagle Sustaining15Neves-Corvo Sustaining65Zinkgruvan Sustaining50Total SustainingEagle East50530ZEP (Neves-Corvo)210Total Expansionary240Total Capital Expenditures1. Excludes capitalized interest. Amounts forecast above are on a cash basis and may vary from accrual based estimates.2. During the production phase, waste stripping costs which provide probable future economic benefits and improved access to the orebody are capitalized to mineral properties.The Company capitalizes waste costs when experienced strip ratios are above the average planned strip ratio for each open pit phase under development. 745M14
Chapada Acquisition HighlightsFurthers Strategic Goals high-quality, long-life, expandable complements existing assetsImmediately Accretive on key financial and operating metrics financial strength utilized whilemaintaining low leverage and flexibilityIncreased Copper& Gold Cash FlowsSignificant Upside Opportunities copper-focused exploration expansion studies underwayAsset Diversification15Chapada Open Pit
Increasing Production Profile1 (kt)CopperZincForecast 50% increase on Candelariainvestments and Chapada AcquisitionForecast 55% increase primarily onNeves-Corvo Zinc Expansion Project231 25%263 26%191821015 26%237161619524213121522092002018AEagle East planned on-line in Q4 2019241302298Nickel1571472019E 2Pro Forma32020EPro Forma32021EPro Forma2018A2019202020212018A2019202020211. Production guidance is based on certain estimates and assumptions, including but not limited to; Mineral Resource and Mineral Reserve estimates (see slide 29), geological formations, grade and continuity of deposits and metallurgical characteristics. The 2019-2021guidance was originally announced by news release on November 28, 2018. Copper production profile based on midpoint of 3-year guidance provided November 2018.2. Reflects full-year production from the Chapada Mine as most recently guided by Yamana Gold Inc. (“Yamana”).3. Derived from or is based on the “Technical Report on the Chapada Mine, Goiás State, Brazil” dated March 21, 2018 (the “Chapada Technical Report”), prepared by or under the supervision of Hugo M. Miranda, ChMC (RM), Chester M. Moore, P.Eng., Avakash Patel, P.Eng.,and Luiz E. C. Pignatari, ChMC (RM), of Roscoe Postle Associates Inc., who are qualified persons pursuant to National Instrument 43-101 – Standards of Disclosure for Mineral Projects (“NI 43-101”) or other Yamana public disclosure.16
Diversified in Established Jurisdictions2019E Copper Equivalent Production by Country 1, 2CurrentPro Portugal19%Portugal24%Brazil20%Notes:(1) Based on midpoint of 2019E production guidance provided by Lundin Mining and 2019E Chapada production guidance provided by Yamana Gold Inc. Only includes commodities for which public guidance is provided.(2) Equivalency calculated according to Lundin Mining price assumptions as follows: US 2.80/lb copper, US 6.00/lb nickel, US 1.10/lb zinc and US 1,250/oz gold.17
Transaction SummaryTransactionLundin Mining to acquire 100% interest in Chapada copper-gold mineUS 800M in cash at closing, subject to customary adjustmentsPurchasePriceContingent gold price payments – annual payment if the gold price averages at least thethreshold in any sequential annual period over the five years commencing on closing: US 10M if the price averages at least US 1,350/oz US 10M if the price averages at least US 1,400/oz US 5M if the price averages at least US 1,450/ozContingent consideration of US 100 million on potential construction of a pyrite roasterYamana to retain a 2.0% net smelter return royalty on any future gold production from theSuruca gold depositFundingConditionsClosingExpected from current cash balance and a portion from undrawn US 550M revolving creditfacilityTypical closing conditions, including third-party and requisite regulatory approvalsExpected early Q3 201918
Chapada OverviewHigh-Quality Producer inExcellent JurisdictionEstablished Minewith Long Life RemainingProduction Expansion andMine Life Extension PotentialPotential to sustain production in the range of 68.0 to 72.5 ktpacopper and 100 to 110 koz gold under expansion scenariothrough at least 2034Competitive cash cost profile over life of mineCurrent copper Mineral Reserves support 28 year operational life 0.25% copper grades with 0.16 g/t gold grades life of mineOpportunities to expand throughput and increase productionHighly prospective mineral property position19
Long-Life, Expandable OperationCopper Production (kt) & Co-Product Cash Cost ( /lb)Attractive co-product cash costs.Guided to 1.60- 1.80/lb copperand 430/oz gold equivalent in2019E28 year life on copper MineralReserves at current throughputrate with significant potential toextend595852 1.58 1.542016A2017A68 - 72.5626054 1.74 1.60 - 1.802018A2019E(1)2020E(2)2021E(2)Potential to SustainThrough 2034(3)Gold Production (koz) & Co-Product Cash Cost ( /oz gold equivalent)Potential to increase throughputand sustain production abovecurrent levels leveraging our: technical expertise financial strength copper-focused explorationNote: figures sourced from Yamana public disclosures(1) Reflects production and cash costs from Chapada as guided by Yamana.(2) Reflects production as outlined in the Chapada Technical Report.(3) Reflects disclosure by Yamana on expansionary study work underway.107121120 359 3342016A2017A 3882018A20100 - 11010510087 4302019E(1)2020E(2)2021E(2)Potential to SustainThrough 2034(3)
Mine thPitLarge copper-gold mineralized systemConventional drill and blast, load and haul open pitsOwner-operated and contractor mining21Chapada open pits:LOM strip ratioAvg. remaining LOM copper gradeAvg. remaining LOM gold grade1.3:10.25%0.16 g/t
Processing tiesROM OreStockpilePower Substation230/13.8kVIn Pit CrusherConveyorCrushed OreStockpileMMD CrusherJaw Crusher22
Processing FacilitiesConventional Crush, Grind, FloatThroughput65 ktpd or 23.4 MtpaCopper recovery82% in 2018Gold recovery63% in 2018Copper concentrate 25% copperGold in concentrate 10-15 g/tGrid PowerConnected to national grid via 84 kmprivate 230 kV lineCurrent total demand 46 MWCapacity limit2018 power costIn Pit CrusherCrushed StockpileSAG Mill – 34 ft x 19 ftColumn Flotation 100 MW 0.06/kWh4 Cell ScavengerWater Balance6 Cell RougherRecycled water constitutes 86% ofprocess requirements 1,500 mm of rainfall per yearPermitted to withdrawal from local river,though not typically requiredBall Mill – 24 ft x 40 ft23Flotation Cells
Current Mineral Reserves Support Long LifeOver 1.68 Mt of contained copperand 4.5 Moz of contained gold inMineral ReservesMineral Reserves estimated usingUS 3.00/lb copper price andUS 1,250/oz gold for ChapadaZone, and US 1,300/oz gold forSuruca ZoneSignificant potential to increaseMineral Reserves with conversionof current Mineral Resources andexploration success(1)(2)(3)Mineral Reserve Statement, effective December 31, 1,549Proven CopperGold (only)Contained MetalCuAuktkozChapada ZoneSuruca 5,1950.511,062Notes:1. All figures are rounded to reflect the relative accuracy of the estimates.2. Chapada Zone open pit Mineral Reserves are reported at US 4.06 per tonne cut-off. Metallurgical recoveries at Chapada are dependent on zone and average 83.1% for copper and 56.9% for gold. Suruca Zone open pit MineralReserves are reported at 0.19 g/t gold cut-off for oxides and 0.3 g/t gold for sulphides. Metallurgical recoveries for Suruca oxide average 85% for gold and for Suruca sulphide average 88% gold.3. The qualified person responsible for the Mineral Reserve estimate is Luiz Pignatari, Registered Member of Chilean Mining Commission, EDEM Engenharia.24
Mineral Resources Offer Upside PotentialApproximately 920 kt ofcontained copper and 1.9 Moz ofcontained gold estimated incopper M&I Mineral Resources inaddition to those MineralReservesExcellent copper-focusedexploration potential to furtherexpand Mineral Resource baseMineral Resources estimatedusing US 4.00/lb copper priceand US 1,600/oz gold forChapada and Suruca Zones(1)(2)(3)Mineral Resource Statement, effective December 31, 9290.220.148011,676Measured and 30.08354422CategoryCopperChapada ZoneMeasuredIndicatedGold (only)Contained MetalCuAuktkoz(5)Suruca sured and :1. Mineral Resources are exclusive of Mineral Reserves.2. All figures are rounded to reflect the relative accuracy of the estimates.3. Chapada Zone Mineral Resources have been prepared using US 1,600/oz gold and US 4.00/lb copper price assumptions. Suruca Zone Mineral Resource have been prepared using US 1,600/oz gold.4. Chapada open pit cut-off at US 4.06/t (Chapada pits and Suruca SW). Metallurgical recoveries at Chapada are dependent on zone and average 83.11% for copper and 56.94% for gold.5. Cut-off grade 0.19g/t gold for Suruca oxide and 0.23 g/t for Suruca sulphide. Metallurgical recoveries for Suruca oxide average 85% for gold and for Suruca sulphide average 88% for gold.6. The qualified person responsible for the Mineral Resource estimate is Felipe Machado de Araujo, Registered Member of Chilean Mining Commission, Mineral Resources Coordinator Brazil, Yamana Gold Inc.25
Tailings Storage Facility26
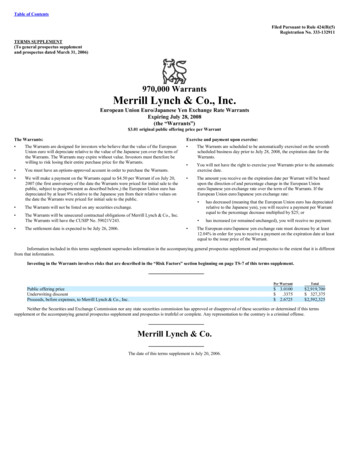
Tailings Storage FacilityTailings storage facility (TSF) is locatednorthwest of Chapada open pitMainDamAll dams raised by centerline methodsMain Dam and Dyke III comprisecompacted earth fill starter damsraised with cyclone tailingsDyke II is a compacted earth fill damfor water retentionSpillwayCurrent permitted capacity for threeyearsWater Reservoir(10/12/18)Sufficient footprint and design capacityfor life of mine productionDyke IIIWater PumpingStationDyke II27
Lundin MiningHigh QualityCompetitive Mines– strong margins at alloperations– demonstrated operationalexcellence and culture ofcontinuous improvement– low-risk miningjurisdictionsMeaningful ScaleGrowth Oriented– exploration upside andhigh value expansionprojects underway– advancing externalacquisition initiatives withdisciplined criteria28Financial Strength– proven track record forrigorous investmentapproach, focused onvalue creation– substantial balance sheetstrength and flexibility torespond to opportunities
NI 43-101 ComplianceUnless otherwise indicated, Lundin Mining Corporation (the “Company”) has prepared the technical information in this presentation including Mineral Reserve and Mineral Resource estimates (“TechnicalInformation”) based on information contained in the technical reports and news releases (collectively the “Disclosure Documents”) available under the Company’s profile and the profile of Yamana GoldInc. (“Yamana”) on SEDAR at www.sedar.com. Each Disclosure Document was prepared by or under the supervision of a qualified person (“Qualified Person”) as defined in National Instrument 43-101 –Standards of Disclosure for Mineral Projects of the Canadian Securities Administrators (“NI 43-101”). For readers to fully understand the information in this presentation, they should read the technicalreports identified below in their entirety, including all qualifications, assumptions and exclusions that relate to the information set out in this presentation which qualifies the Technical Information. Readersare advised that Mineral Resource estimates that are not Mineral Reserves do not have demonstrated economic viability. The Disclosure Documents are each intended to be read as a whole, andsections should not be read or relied upon out of context. The Technical Information is subject to the assumptions and qualifications contained in the Disclosure Documents.The Technical Information in this presentation has been prepared in accordance NI 43-101 and has been reviewed and approved by Stephen Gatley, BSc (Eng), C.Eng. Vice President - TechnicalServices of the Company, a "Qualified Person" under NI 43-101. Mr. Gatley has verified the data disclosed in this presentation and no limitations were imposed on his verification process.Mineral Reserve and Mineral Resource estimates of the Company are shown on a 100 percent basis for each mine. The Measured and Indicated Mineral Resource estimates of the Company areinclusive of those Mineral Resources estimates modified to produce the Mineral Reserve estimates. All estimates of the Company are prepared as at June 30, 2018. Estimates for all majority ownedoperations of the Company are prepared by or under the supervision of a Qualified Person as defined in NI 43-101, or have been audited by independent Qualified Persons on behalf of the Company.Unless indicated otherwise in the “Notes on Mineral Resource and Reserve Table” in the Company’s news release dated September 6, 2018, Mineral Reserve estimates have been calculated using metalprices of US 2.75/lb copper, US 1.00/lb zinc, US 1.00/lb lead, US 8.00/lb nickel, US1,000/oz gold and exchange rates of EUR/US 1.25, US /SEK 7.00 and Chilean Peso/US 550. Refer to theCompany’s news release dated September 6, 2018 entitled “Lundin Mining Announces 2018 Mineral Resource and Mineral Reserve Estimates” on the Company’s website (www.lundinmining.com).Mineral Reserve and Mineral Resource estimates of Yamana Gold Inc. are shown on a 100 percent basis. The Measured and Indicated Mineral Resource estimates of Yamana are reported exclusivethose Mineral Resources estimates modified to produce the Mineral Reserve estimates. All estimates of Yamana are reported as at December 31, 2018. The Qualified Person responsible for the MineralReserve estimate of the Chapada Mine is Luiz Pignatari, Registered Member of Chilean Mining Commission, EDEM Engenharia. The Qualified Person responsible for the Mineral Resource estimate ofthe Chapada Mine is Felipe Machado de Araujo, Registered Member of Chilean Mining Commission, Mineral Resources Coordinator Brazil, Yamana. Chapada Zone open pit Mineral Reserves estimatedusing US 3.00/lb copper price and US 1,250/oz gold for Chapada Zone, and US 1,300/oz gold for Suruca Zone. Chapada Zone open pit Mineral Reserves are reported at US 4.06 per tonne cut-off.Metallurgical recoveries at the Chapada Mine are dependent on zone and average 83.1% for copper and 56.9% for gold. Suruca Zone open pit Mineral Reserves are reported at 0.19 g/t gold cut-off foroxides and 0.3 g/t gold for sulphides. Metallurgical recoveries for Suruca oxide average 85% for gold and for Suruca sulphide average 88% gold. Chapada Zone Mineral Resources have been preparedusing US 1,600/oz gold and US 4.00/lb copper price assumptions. Suruca Zone Mineral Resources have been prepared using US 1,600/oz gold. Chapada open pit cut-off at US 4.06/t (Chapada pitsand Suruca SW). Cut-off grade 0.19g/t gold for Suruca oxide and 0.23 g/t for Suruca sulphide. Metallurgical recoveries for Suruca oxide average 85% for gold and for Suruca sulphide average 88% forgold. Refer to Yamana’s news release dated February 14, 2019 entitled “Yamana Gold Anno
Bank of America Merrill Lynch Global Metals, Mining & Steel Conference May 2019 TSX: LUN Nasdaq Stockholm: LUMI . This data is intended to provide additional information and should not be . Breakthrough of Ramps 6 and 7 Development of Under Ground Electrical Room 9. ZEP - Underground Construction .