Transcription
Oral Health Status ofFlorida’s Older Adult Population2015-20161
Acknowledgements:Authors:Christina Vracar, DA, MPHAbigail Holicky, MPHJennifer Wahby, MPHJasmine Calhoun Bee, CFM, MPHSurvey Planning and Design:Tami Miller, RDH, BSChristina Vracar, DA, MPHJennifer Wahby, MPHDonna Solovan-Gleason, RDH, PhDTechnical Assistance:Christine Wood, RDH, BSMichael C. Manz, DDS, MPH, DrPHCollette Vallee, BSMadeleine Nobles, RN, CPHMImplementation and Screening:Jan Barrett, RDHShelley Bergholcs, CRDH, BASDHDulce Calva, RDHJoleyn Carriveau, RDH, BS, PDHCNorine Dowd, CRDH, BHScDanielle Driscoll, CRDH, MHSKaren Hodge, RDH, MHScBeryl Sue Kassoff-Correia, CRDH, BSRhoda Kublickis, RDH, MHS, FAADHCynthia Lineberger, CRDHKimberly Reams, RDHPamela Ridilla, CRDH, MSMichelle Ryan, CRDH, MEdPamela Sandy, CRDH, MAPaula Schad, RDHRebecca Smith, CRDH, EdDDebra Vitale, RDH, BSDaytona Beach State College, Eastern Florida State College, Miami-Dade College, Palm Beach StateCollege, Pensacola State College, South Florida State College, and Valencia College Dental HygieneStudentsThank you to the regional Area Agencies on Aging, the selected congregate meal sites, and older adultsfor your assistance and participation in this project.This project is supported in part by the Health Resources and Services Administration State Oral HealthWorkforce Grant (T12HP27541) funds provided through the University of Florida, College of Dentistry.Suggested Citation: Florida Department of Health. (2016). The Oral Health Status of Florida’s Older AdultPopulation 2015-2016.The Public Health Dental Program: www.flhealth.gov/dentalContact us at dental@flhealth.gov or 850-245-43332
Table of ContentsExecutive Summary . 4Key Findings. 4Introduction . 5Methodology. 6Basic Screening Survey . 6Sampling Procedure . 6Screening Methods. 7Data Analysis . 8Results . 9Demographic Characteristics of Participating Older Adults . 9Oral Health Indicators-Overall .11Oral Health Indicators-Race/Ethnicity .12Oral Health Indicators-Region .13Oral Health Indicators-Education Level.13Vulnerable Population-Dental Insurance .15Chronic Disease Indicators .15National Status .17Limitations.17Recommendations .17References .19Appendices .20Appendix A: Consent and Questionnaire Form-Page 1 .20Appendix A: Consent and Questionnaire Form-Page 2 .21Appendix B: Older Adult Oral Health Screening Form .22Appendix C: Screening Results Letter Sent to Parents .23Appendix D: Other Indicators from Parent Questionnaire .24Toothache .24Last Dental Visit .24Follow-Up Care .25Reason for Last Dental Visit .25Reason for Not Seeking Care .26Avoiding Food Due to Teeth or Dentures .263
Executive SummaryDuring the 2015-2016 state fiscal year, the Florida Department of Health’s (DOH) Public HealthDental Program (PHDP) completed the first statewide oral health surveillance of Florida’s olderadult population attending congregate meal sites. The 2015-2016 Older Adult Oral HealthScreening Project was conducted in 35 congregate meal sites across 19 Florida counties.Out of 3,288 older adults attending the 35 selected Florida congregate meal sites, there were674 older adults screened to gain a representative sample of Florida’s older adult population.Overall, 21.6% of consent forms were returned and of those, 95.6% were returned with positiveconsent. In total, 20.5% of the sampled population were screened. Dental screenings wereprovided by contracted Florida Dental Hygienists’ Association registered dental hygienistsfollowing the Association of State and Territorial Dental Directors' (ASTDD) Basic ScreeningSurvey (BSS) protocols.Key FindingsOf Florida’s older adults ages 60 and older: The average number of natural teeth present were 15.2 out of a maximum of 32 teeth. Suspicious soft tissue lesions were present in 5.5% of Florida’s older adults. The early dental treatment need among Florida’s older adult population was 28.8%. The urgent dental treatment need among Florida’s older adult population was 5.0%. Approximately one in four older adults (28.4%) reported having no insurance coveragefor dental care and only 10% had private dental insurance.Of Florida’s older adults without any teeth (edentate; 19.2%): Those with a higher education status reported a lower prevalence of edentulism. Approximately one in three older adults (34.4%) reported the use of an upper and lowerdenture.Of Florida’s older adults with at least one tooth (80.8%): One in five older adults (22.9%) presented with untreated decay.o Untreated decay was the highest among non-Hispanic Blacks (32.2%). Almost half of older adults (46.7%) reported the use of an upper denture (or partial) andover one in three older adults (39.5%) reported the use of a lower denture (or partial). The need for periodontal care was 17.2%. Root fragments were present in 21.3% of older adults.According to Oral Health America’s A State of Decay: Are Older Americans Coming of Agewithout Oral Healthcare report, Florida ranks 7th nationally (84%, good category) on a compositescore based on five variables: edentulism, adult Medicaid dental benefits, community waterfluoridation, BSS history and status, and state oral health plans.11“A State of Decay”, 20164
IntroductionOral health is essential to overall health and well-being across the life span. There is a strongcorrelation between poor oral health status and other systemic and chronic conditions, such asdiabetes, heart disease, and stroke.2 Older adults experiencing poor oral health tend to bedisabled, homebound, institutionalized, economically disadvantaged, lack insurance, and aremembers of racial and ethnic minorities.3 Many older Americans do not have dental insuranceas they lose these benefits when they retire and leave the work force.2Florida’s older adults are a growing vulnerable population with unique oral health needs. In2010, Florida older adults ages 60 and older comprised approximately 36% of the state’spopulation. By 2020, it is estimated that there will be more than 8 million older adults in thestate, comprising 42% of the state’s population.4 According to the 2014 Florida Behavioral RiskFactor Surveillance System (BRFSS) survey, 13.2% of those ages 65 and older areexperiencing complete tooth loss5, affecting the ability to carry on basic human functions suchas chewing, swallowing, speaking, smiling, and singing.Oral health data are needed for ongoing surveillance, establishing the burden of oral healthdisease, and to inform statewide programmatic planning efforts. To address the need for statelevel oral health surveillance data, the Florida Department of Health (DOH) Public Health DentalProgram (PHDP) has established a surveillance system for monitoring oral health status, riskfactors, and access to dental services among various populations. Florida’s older adultpopulation was the third in a series of three ongoing statewide oral health surveillance projectsto determine the oral health status of Floridians. The purpose of this project was to determinethe current oral health status of Florida’s oldest population (ages 60 and older) attending Floridacongregate meal sites, identifying gaps in access to care and unmet dental needs, and toprovide additional information for future prevention programs.The Florida Department of Elder Affairs, through the Area Agencies on Aging, provides stateand federally funded meal and nutrition education programs with outreach services.6 There areapproximately 425 congregate meal sites in Florida that serve thousands of meals daily.5 Atthese congregate meal sites, Floridians 60 years and older and their spouses receivenutritionally balanced meals, nutrition education, and nutrition risk screening.5 Floridacongregate meal sites can function in several different types of dining facilities including seniorcenters, churches, senior housing facilities, and other community focal points.The following sections of this report detail specifics about this project including the methodology,results, limitations, and recommendations from Florida’s first Older Adult Oral Health ScreeningProject.2U.S. Department of Health and Human Services, 2000“Oral Health for Older Americans,” 20134 Florida CHARTS Query, 20165 BRFSS, 20146 “Congregate Meal and Nutrition Sites”35
MethodologyBasic Screening SurveyThe 2015-2016 Older Adult Oral Health Screening Project (Project) was based on the BSS toolsupported by ASTDD. The primary purpose of the BSS tool is to provide state and local healthjurisdictions with a consistent model for monitoring oral disease in a timely manner, at thelowest possible cost, with minimum burden on survey participants, and that will supportcomparisons within and between states.7 The goal of the BSS is to obtain standardized regionaland statewide estimates of the oral health status in specific populations.The BSS is designed to capture information on the following dental indicators that are directlyrelated to oral health in older adults8:1. Dentures and denture use: presence and use of full or partial removable dentures in theupper and lower arch.2. Number of natural teeth: total number of teeth present in the upper and lower arch,including third molars, retained primary teeth, and root fragments. Teeth that may beused as part of an “over denture” are not included in the number of natural teeth.a. Dentate: having at least one natural toothb. Edentate: loss of all natural teeth (without teeth)93. Untreated decay: visible breakdown of the enamel surface.4. Root fragments: visible root fragments or teeth where the crown has fractured off at orbelow the gum line.5. Need for periodontal care: need to have teeth cleaned before the next regularlyscheduled dental appointment or more advanced periodontal treatment is needed.6. Suspicious soft tissue lesions: presence of a soft tissue lesion that should be evaluatedby a health professional including red and white lesions plus conditions or infectionssuch as Candidiasis.7. Urgency of need for dental care:a. Early dental care: needs to see a dentist within several weeks because ofuntreated decay or broken restorations.b. Urgent dental care: needs dental care as soon as possible because of signs andsymptoms that include pain, infection, or swelling.Sampling ProcedureA representative statewide sample of older adults attending Florida congregate meal sites wasused for the Project. The average daily meal enrollment (average daily attendance) data werecollected through the Area Agencies on Aging offices and individual congregate meal sites asthere is not one centralized database housing this information for Florida. A Stratified ProbabilityProportional to Size sample (PPS) design was used to select the representative statewidesample of sites and the meal enrollment data were used to construct the population sampleframe. The list of sites was sorted by region and then by average meal enrollment within eachregion to achieve geographic stratification. A systematic sample interval was drawn with a7ASTDD, 2011ASTDD, 20109 “Healthy People 2010: Oral Health Toolkit,” 200786
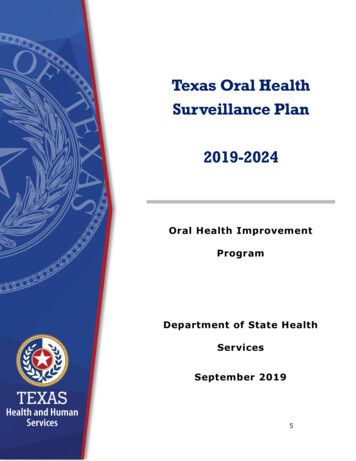
calculated sampling proportional to the region population (based on total average mealenrollment) to ensure a minimum of two sites were selected within each region of the state.With a random start, the sampling interval was then repeatedly added with selections madebased on where the sampling intervals fell in cumulative enrollment, for a total of 35 selections.Sites were contacted and consented to participate in the screening project. Sites that declinedparticipation were replaced with a random PPS site selection from the same interval.Figure 1 illustrates the regional designations and the number of counties and sites within eachregion for the Project.Screening MethodsAfter obtaining permission from the selected sites, older adults were given the opportunity forindividual participation in the project. Consent form questionnaire (Appendix A), data collectionforms (Appendix B), and screening results letters (Appendix C) were created based on BSSguidelines.10 Consent forms were sent to the 35 participating sites and distributed to the olderadults prior to the scheduled screening date. Older adults were encouraged to complete andreturn the consent form questionnaire even if they did not want to participate in the screening.10ASTDD, 20107
The older adult screenings took place before and after the scheduled congregate meal times.Only those older adults returning a positive consent questionnaire form with a signature werescreened.Florida Dental Hygienist’s Association licensed dental hygienists were trained in BSS guidelinesand provided screenings to participants following procedures to prevent the spread of diseaseas set by the Centers for Disease Control and Prevention (CDC) for this type of oral healthscreening. Dental gloves and masks were worn, and the dental hygienists used a disposablemirror for each participant, which was thrown away after each screening. The screening was notintended to take the place of a regular dental checkup or an exam by a dentist. There were 17hygienists who collected information on the presence of all seven indicators: dentures anddenture use, number of natural teeth, untreated decay, root fragments, need for periodontalcare, suspicious soft tissue lesions, and urgency of need for dental care. The screenings anddata were collected at the participant level and the tooth level, depending on the indicator and inaccordance with BSS guidance.Maintaining screening and data collection consistency across calibrated screeners was thefoundation of the Project. The BSS provided a framework to collect data in a consistent mannerand overview trainings were provided to all screeners. Data were collected in accordance withall the guidelines and policies defined in the BSS for the older adult population. This was across-sectional (looking at a specific population at a point in time) and descriptive (intended todetermine estimates of oral health status for a defined population) survey.Data AnalysisData analysis was completed utilizing Statistical Analysis Software (SAS) version 9.4, a highlevel data analysis tool. Outcome data were weighted and adjusted for non-response basedupon the Stratified Probability Proportional to Size sample design with a 95% ConfidenceInterval (CI). This sample design allows for the reporting of state-level and regional-level data.Demographic indicators of age, race/ethnicity, gender, education level, and insurance status ofthe participating adults were obtained from the consent form questionnaire (Appendix A). Due tolow participation of older adults identifying as American Indian/Alaska Native, NativeHawaiian/Pacific Islander, and Asian, these individuals were combined with those identifying as“Other” into the “Other Race” category for analysis and reporting. Those participants identifyingas “Multi-Racial” on the consent questionnaire or those who checked multiple boxes for therace/ethnicity question were displayed as “Multi-Racial” in the following results.8
ResultsThere were 3,228 consent forms provided to adults attending the 35 sampled congregate mealsites. Of the 3,228 consent forms, 709 consent forms were returned (21.6%) and of those, 678(95.6%) were positive consent.For the purposes of analysis and reporting, 668 of the 678 screened adults were included. Tobe included in this report, adults had to be aged 60 years or older (to align with eligibility criteriaof congregate meal sites) and not missing data on key oral health indicators.Demographic Characteristics of Participating AdultsThe breakdown of demographic characteristics of the participating adults screened is shown inTable 1. Please note these data are unweighted.Table 1. Demographic Characteristics of Adults Screened during theFlorida Older Adult Oral Health Screening Project 2015-2016, n 668CharacteristicN (%)Age60-69 years176 (26.4%)70-79 years269 (40.3%)80-89 years195 (29.2%)90 years and older28 (4.2%)GenderMale224 (33.5%)Female442 (66.2%)Missing2 (0.3%)Race/EthnicityWhite237 (35.5%)Black60 (9.0 %)Hispanic278 (41.6%)Multi-Racial66 (9.9%)Other Race20 (3.0%)Missing7 (1.1%)The majority of participants screened were age 70-79 years (40.3%), female (66.2%), andHispanic (41.6%). The BSS data were weighted to achieve regional and state-level estimates ofthe various indicators. The data shown in the rest of the report represent the population of olderadults attending congregate meal sites across Florida. Prevalence estimates are provided alongwith 95% Confidence Intervals (CIs).Natural Teeth and Denture UseA key determinant in oral health status and function is an individual’s number of natural teeth.Having adequate dentition (teeth in the dental arch)11 is vital to quality of life and personal wellbeing.11American Dental Association Glossary9
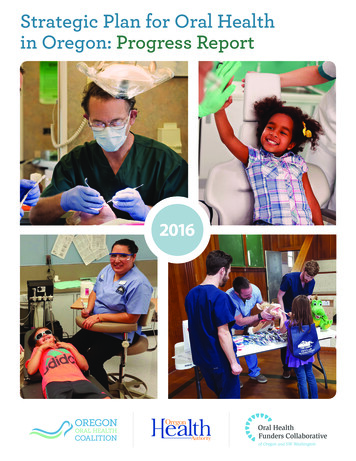
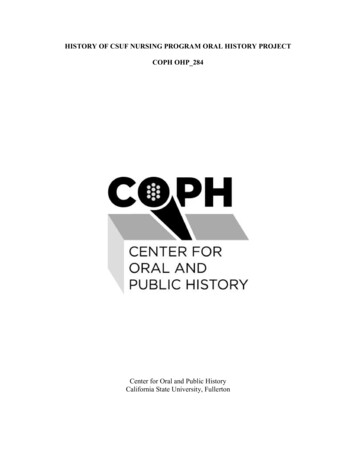
Most adults have a total of 32 permanent teeth. If an individual has retained some or most oftheir natural teeth, they are considered dentate. If an individual does not have any natural teeth,they are considered edentate. ASTDD’s BSS Older Adult Manual includes screening questionsto determine the number of natural teeth retained to determine dentate status in addition tocollecting data on the use of upper and/or lower dentures.The data from the Project reveal that the average number of teeth for the older adult populationis 15.2 teeth and that this number decreases with age. Almost one in five (19.2%) wereedentate. Approximately 47% used upper dentures, 40% used lower dentures, and 35% usedboth upper and lower dentures (Figure 2).Figure 2. Denture Use of Florida's Older Adults, Total and byEducation Status, 7.3%22.4%20.0%10.0%0.0%Upper DentureLess than HS DegreeLower DentureHS DegreeSome CollegeBoth Upper and Lower DentureAdvanced DegreeTotalThis project revealed that the number of natural teeth (and subsequent denture use for toothloss) is correlated with education status. Education status was categorized into four groups: lessthan high school (HS) degree, HS degree, some college, and advanced degree (i.e. Masters’,Professional, and Doctoral).When comparing average number of teeth by education status, a higher education status isindicative of a lower edentate status. On average, those with an advanced degree retainedmore than half of their teeth (19 out of 32) as compared to those with less than a HS degree (11out of 32) and those with a HS degree (15 out of 32). When comparing other demographicfactors, such as gender or race/ethnicity, by the average number of natural teeth, the level ofdisparity was not significant enough to represent graphically.Denture use indicated a similar dynamic to natural teeth when assessing education status. For aparticipant with an advanced degree, usage in all denture categories drops by nearly half. Inaddition, over half of those with less than a high school education used both upper and lowerdentures, a 30% increase from individuals with a high school diploma (Table 2).Prevalence estimates of the denture use indicators by education status are provided along with95% CIs in Table 2.10
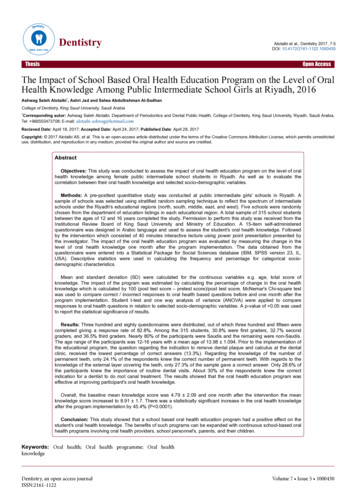
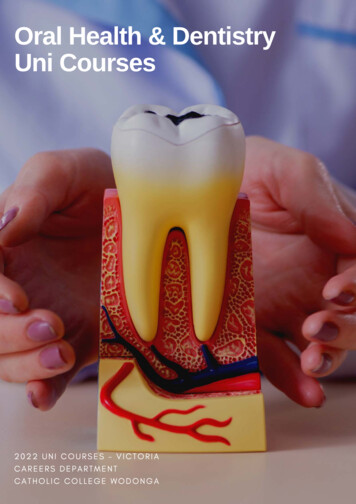
Table 2. Prevalence (95% CI) of Denture Use among Florida’s Older Adults, byEducation StatusOral Health Indicator (95% CI)Education StatusUpper Denture Lower DentureBoth Upper and LowerLess than HS Degree65.4(55.2, 75.6)57.0(46.3, 67.6)53.3(42.9, 63.6)HS Degree46.3(39.2, 53.4)38.1(30.3, 46.0)36.4(29.9, 42.9)33.6(25.5, 41.8)32.1(25.5, 38.6)27.3(18.7, 35.8)Advanced Degree34.4(21.9, 46.8)29.4(17.9, 40.9)22.4(10.8, 33.9)Total46.7(41.5, 51.9)39.5(34.7, 44.4)34.4(29.3, 39.5)Some CollegeOral Health IndicatorsAccording to BSS guidelines, untreated decay, root fragments, and need for periodontal careare all indicators that should be restricted to the dentate population when reported and do notinclude any edentate adults. Suspicious soft tissue lesions and urgency of dental care arereported for the entire population. These criteria are reflected in all subsequent figures andtables shown. In Florida, the oral health indicators with the highest prevalence were need forearly dental care (28.8%) and untreated decay (22.9%) (Figure 3). Approximately, 21.3% hadroot fragments, 17.1% had a need for periodontal care, 5.5% had soft tissue lesions, and 5.0%were in need of urgent dental care.Figure 3. Overall Oral Health Indicators of Florida's Older %17.1%15.0%10.0%5.5%5.0%5.0%0.0%Untreated DecayRoot FragmentsNeed forPeriodontal CareSoft TissueLesions*Early Dental Care*Urgent DentalCare**Per the 2010 Older Adult BSS manual, soft tissue lesions, early dental care, and urgent dental care indicators areinclusive of all participants, including the edentate population. All other indicators in figure are reported for dentatepopulation only.11
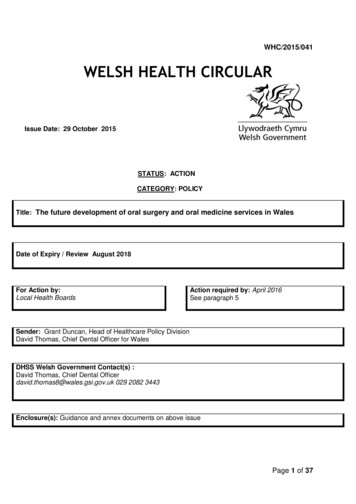
Prevalence estimates of the various oral health indicators by population are provided along with95% CIs in Table 3.Table 3. Prevalence of (95% CI) of Oral Health IndicatorsOral Health Indicator, Prevalence (95% CI)PopulationUntreatedDecayRootNeed forSoftFragments Periodontal TissueCareLesionsEarlyNeed forDentalCareUrgentNeed forDentalCareAllParticipants---5.5%(3.3, 7.7 )28.8%(22.3, 35.2)5.0%(2.6, 7.4)Dentate Only22.9%(18.0, 27.8)21.3%(16.1, 26.5)17.2%(12.3, 22.0)---Oral Health Indicators-Race/EthnicityOral health status varied by race/ethnicity, especially for root fragments (Figure 4). NonHispanic Black adults had almost two times higher prevalence of root fragments (44.4%) whencompared to their non-Hispanic White counterparts (25.5%). Non-Hispanic Blacks also had thehighest prevalence of untreated decay (32.2%). Multi-racial adults had the highest prevalence ofneed for early dental care (37.3%) and need for periodontal care (25.0%). Suspicious soft tissuelesions and need for urgent dental care were low among all race/ethnic groups.FIgure 4. Oral Health Indicators of Florida's Older Adults, byRace/Ethnicity 4.2%32.0%30.0%26.2%18.1%16.8%12.9%10.3%10.0%5.7% 6.6%5.2%3.2%1.6%3.4%5.0%7.4%6.1% 4.5%0.8%0.0%Untreated DecayRoot FragmentsWhiteNeed forPeriodontal CareBlackHispanicSoft TissueLesions*Multi-RacialEarly Dental Care*Urgent DentalCare*Other*Per the 2010 Older Adult BSS manual, soft tissue lesions, early dental care, and urgent dental care indicators areinclusive of all participants, including the edentate population. All other indicators in table are reported for dentatepopulation only.Prevalence estimates and 95% CIs are provided for all oral health indicators by race/ethnicity inTable 4.12
Table 4. Prevalence (95% CI) of the Oral Health Indicators, by Race/EthnicityOral Health Indicator, Prevalence (95% CI)Race/EthnicityUntreatedDecayRootFragmentsNeed e*UrgentDentalCare*White24.6(16.5, 32.6)25.5(18.3, 32.7)18.1(8.8, 27.4)5.7(1.0, 10.5)30.0(21.8, 38.2)6.1(1.6, 10.6)Black32.2(19.1, 45.3)44.4(27.3, 61.6)12.9(0.7, 25.0)1.6(0.0, 3.9)32.0(7.9, 56.1)7.4(0.3, 14.5)Hispanic18.6(10.6, 26.5)23.1(8.8, 37.5)15.7(4.9, 26.6)14.2(6.3, 22.1)3.4(0.0, 7.6)24.8(0.0, 55.5)16.8(7.7, 25.8)25.0(5.9, 44.1)-6.6(4.3, 9.0)5.2(0.0, 10.3)3.2(0.0, 9.6)26.2(17.6, 34.8)37.3(27.3, 47.2)10.3(0.1, 20.2)4.5(1.6, 7.5)0.8(0.0, 2.6)-MultiRacialOther*Per the 2010 Older Adult BSS manual, soft tissue lesions, early dental care, and urgent dental care indicators areinclusive of all participants, including the edentulous population. All other indicators in table are reported for dentatepopulation only.Oral Health Indicators-RegionThe PHDP stratified the survey sample into six regions in order to observe regional estimatesand assess if geographic disparities exist. These results are shown in Table 5 and reveal thatgeographic disparities exist. Untreated decay and root fragments were highest in the Northwestregion, and need for periodontal care and need for early dental care were highest in the Atlanticregion. Due to the overall low prevalence of soft tissue lesions, regional estimates were notavailable for all regions. Prevalence estimates and 95% CIs are provided for all oral healthindicators by region in Table 5.Table 5. Prevalence (95% CI) of the Oral Health Indicators, by RegionRegionUntreatedDecayOral Health Indicator, Prevalence (95% CI)RootNeed forSoftEarlyFragments Periodontal TissueDentalCareLesions*Care*Northwest28.6(15.5, 41.7)27.7(13.9, 41.5)18.8(14.3, 23.3)45.3(24.3, 66.3)20.8(10.0, 31.6)18.0(7.0, 29.0)2.5(0.0, 7.6)12.5(1.8, 23.2)7.0(0.0, 14.1)3.6(0.0, 8.6)3.1(0.0, 7.4)35.2(0.0, 76.7)32.6(18.6, 46.6)25.6(18.7, 32.5)15.4(3.3, 27.5)18.5(16.8, 20.3)15.5(9.7, 21.3)18.9(7.0, 30.7)19.3(0.0, 39.4)11.0(5.7, 16.3)1.1(0.0, 3.3)41.6(40.8, 42.3)20.1(11.8, 28.4)8.1(0.0, 7.4)3.3(0.0, 9.9)6.5(4.1, 8.9)22.7(1.1, 44.3)47.5(11.6, 83.3)27.9(21.4, entalCare*5.0(0.0, 15.2)3.3(0.0, 7.6)4.5(0.0, 10.4)4.1(0.0, 11.3)7.8(3.9, 11.7)5.7(2.2, 9.3)*Per the 2010 Older Adult BSS manual, soft tissue lesions, early dental care, and urgent dental care indicators areinclusive of all participants, including the edentate population. All other indicators in table are reported for dentatepopulation only.13
Oral Health Indicators-Education StatusProject data have already shown a disparity in number of natural teeth and denture use byeducation status. When the other oral health indicators are stratified by education status, not aslarge of a disparity is seen (Figure 5). It is important to note that the first three oral healthindicators shown here (untreated decay, root fragments, and need for periodontal care) werehighest among those with the highest level of education. This is in part due to their low rate ofedentulism.Figure 5. Oral Health Indicators for Florida's Older Adults, byEducation Status 18.1%17.5% 17.1%14.4% 13.3%15.00%10.00%5.5%6.4%2.7%3.3%5.8% 5.3%3.6% 5.2%5.00%0.00%Untreated Decay Root FragmentsNeed forPeriodontal CareLess than HS DiplomaSoft TissueLesions*High School DiplomaEarly DentalCare*Some CollegeUrgent DentalCare*Advanced*Per the 2010 Older Adult BSS manual, soft tissue lesions, early dental care, and urgent dental care indicators areinclusive of all participants, including the edentate population. All other indicators in figure are reported for dentatepopulation only.Prevalence estimates and 95% CIs are provided for all oral health indicators by education statusin Table 6.Table 6. Prevalence (95% CI) of the Oral Health Indicators, by Education StatusOral Health Indicator, Prevalence (95% CI)EducationUntreated RootNeed forSoftEarlyUrgentStatusDecayFragments Periodontal TissueDentalDentalCareLesions* Care*Care*19.5
Program (PHDP) has established a surveillance system for monitoring oral health status, risk factors, and access to dental services among various populations. Florida's older adult population was the third in a series of three ongoing statewide oral health surveillance projects to determine the oral health status of Floridians.