Transcription
STATE OF LATINOENTREPRENEURSHIPStanford Latino Entrepreneurship Initiative
Table of Contents020304050708About This ReportAcknowledgments0912LBANExecutive SummarySection IIntroductionSection IIPopulation Growth:The Latino Population,Market & Power143132Section IIICurrent State of LOBs- Current Data- Number of LOBs- Sales & EmployeesSection IVWhat FutureCan Look Like- Economic ImpactSection VWhy areLOBs Smaller?- Industry, Customers .- Capacity for GrowthSection VIConclusionsAppendix
AboutThis ReportThe Stanford Latino Entrepreneurship Initiative(SLEI), a collaboration between the Latino BusinessAction Network (LBAN) and Stanford University,housed within the Stanford Graduate Schoolof Business, created this report on the State ofLatino Entrepreneurship in the United States. Theinformation contained in this report was preparedfrom sources and data that we believe to be reliable,but we make no representation as to its accuracy orcompleteness and we assume neither responsibilitynor liability for any damages of any type resultingfrom any errors or omissions. Projected to bepublished annually, this first report is published inNovember, 2015.Principal InvestigatorsDr. Douglas Rivers, a senior fellow at the HooverInstitution and a professor of political science atStanford University, designed the research study,Section I2and implemented the data collection.Dr. Jerry Porras is the cofounder and chairmanof the board of LBAN, co-author of the businessbestseller, Built to Last: Successful Habits ofVisionary Companies, and the Lane Professor ofOrganizational Behavior, Emeritus at the StanfordGraduate School of Business.Other ContributorsRemy Arteaga is the Executive Director of theLBAN, co-author of the Wiley published book,Pivot: How Top Entrepreneurs Adapt and ChangeCourse to Find Ultimate Success.Tiq Chapa is the Program Manager of SLEI.Jessica Salinas is the Community & MarketingManager of LBAN.
AcknowledgmentsJust as growing a business would not be possiblewithout a network of support, SLEI has many tothank for its development and results.We would also like to thank all the hard-workingLatino entrepreneurs of the research panel who arehelping build America’s economy.First, LBAN would like to thank 21st Century Fox,Wells Fargo Bank, State Farm Insurance, Pitch Johnson,John Arrillaga, Microsoft, Comcast, Latino DonorCollaborative, and The Gilbert and Jacki CisnerosFoundation for their generous funding and support.Finally, we would also like to thank BarbiBistrowitz (bb@barbibistrowitz.com), who donatedher time as art director to design this report.Second, we want to thank our Board of Directorsfor their guidance and insights. The LBAN board:Victor Arias, Korn Ferry InternationalPhil Pompa, International Accelerator, Inc.Jerry I. Porras, Stanford Graduate School ofBusiness (Chairman - LBAN)Frank Ramirez, EntrepreneurDavid Segura, VisionITSol Trujillo, Trujillo Investments3
LBANThe Stanford Latino Entrepreneurship Initiative(SLEI) is a research collaboration between StanfordUniversity housed at the Graduate School ofBusiness and the Latino Business Action Network(LBAN), a 501(c)3 not for profit organizationlocated in Palo Alto, CA.VisionThe vision to make America stronger byempowering Latino entrepreneurs to grow largebusinesses through entrepreneurship research,education and networks.GoalThe Goal is to grow the American economy bydoubling the number of 10 million, 100 million, and 1 Billion Latino-owned businessesby 2020.Section I4For more on information, please visitwww.LatinoEI.org.
ExecutiveSummaryWith this report, Stanford Latino EntrepreneurshipInitiative (SLEI) provides the first annual Stateof Latino Entrepreneurship report. It providesacademic researchers, policy makers and businessleaders with a timely update of SLEI’s researchresults.The report finds that even as the Latino population(currently at 17%) is growing at an undeniablyfast rate (estimated to be 30% by 2060), and withit, an explosion in the number of Latino OwnedBusinesses (LOBs), there is a multi trillion dollaropportunity gap between Latino Owned Businessesand Non-Latino Owned Businesses (NLOBs),driven by the dramatic difference in size betweenthe two.What can explain this difference? To answer thatquestion, SLEI has created a carefully cleaneddatabase of 1,432,746 Latino businesses, fromwhich two panels of Latino businesses owners- 1,831 and 368 - who agreed to participate inongoing surveys and research was created. Thisreport expands on the U.S. Census based reports,including the Kauffman Foundation report, byexamining the economic impact of LOBs onthe American economy and issues related togrowing large LOBs. For the first time, a deeperexamination into the drivers that lead to smallerLOBs is analyzed.Key InsightsMulti Trillion Dollar Opportunity GapThe current gap between the average yearly salesgenerated by LOBs and NLOBs points to anexciting opportunity for significant growth in the1U.S. economy. The potential impact on the U.S.economy if LOBs generated the same level of salesas NLOBs was calculated over the period of 20022012. A pattern was found to exist over these years.For example, in 2012 alone, if all LOBs averagedthe same yearly sales per firm as all NLOBs, 1.38trillion would have been added to the economy.This difference is named the Opportunity Gap andrepresents the potential economic impact of scalingLOBs to the same average level of NLOBs.Diverse Customers & IndustriesOur research also found that reasons often citedfor lack of large size for LOBs- industry selectionand customer base- are without merit. Whencomparing the mixture of industries of LOBs toNLOBs in industries with either high averagesales per firm or high growth rates, SLEI found nodiscernible differences between the two groups inthe percentage of firms within industries. On thesecond point, SLEI found that 80% of LOBs sell toa mixture of both Latino and non-Latino customers.The results counter the perception that LOBs aresmall because Latino entrepreneurs choose to openbusinesses in small industries or because of a lackof diverse customer base.An Entrepreneurial MindsetThe data speak to an interesting misalignmentbetween the mindset of the Latino business ownerand the reality of the state of their business.Although the growth mentality is present, the realityis that more than half (54%) of the surveyed LBOshave businesses that are either growing slowly,staying stagnant or shrinking, revealing a cleardisconnect between goals and reality.5
ExecutiveSummaryInternal Motivations AffectOwnership and CapitalFurther, our results indicate that Latino businessowners are motivated primarily by internal, noneconomic factors. When asked, only 37% of Latinoentrepreneurs responded that external marketopportunity was a key inspiration for becomingbusiness owners. Instead, Latino business ownerspoint to reasons based on internal impact-- buildingsomething to pass down to children, parents orfamily members, working with family or friends, orhaving control of their financial future.Personal motivations contribute to more thanbusiness creation, also influencing ownership andcapital decisions. When it comes to ownership,the results show that LOBs are predominantlyfamily owned with only 8% non-family ownership,compared to 15% of NLOBs. Additionally,although over half of respondents believe that theycould grow faster if they had additional capital, 67%are concerned about losing control of their businessif during fundraising, they sold a share to someoneelse or brought in a partner.Capital Awareness & EngagementCompared to NLOBs, LOBs were less likely tolook to conventional institutional capital sources,like banks, for funding and were more likely to usecredit cards. However, while taking a closer lookat capital and LOBs, our survey found that ⅓ ofrespondents have been turned down for funding,with the majority of those being declined by banks.Further, while the SBA, SBIC and SBIR grantsare three of the largest and most well-known62government funding programs for small businesses,according to our survey respondents, many Latinobusiness owners are totally unaware of thesegovernment funds and programs. In fact, 22% havenever heard of the SBA, 51% have never heard ofthe SBIC, and 56% have never heard of SBIR.Next StepsLatino business owners are having a significantimpact on the economy, and there is an opportunityto have an even greater impact by understandingthe factors that inhibit growth. This report isa first step in improving the lives of Latinosthrough entrepreneurship, as it gives us a betterunderstanding of the potential economic impactLOBs can have in the U.S. economy and thechallenges that need to be addressed to get there.In addition to the research, the Latino businessdatabase and research panel can help policymakersand business leaders understand and thenaccelerate the engines of job creation and wealthformation latent in the surging rates of Latinoentrepreneurship. This report can also providegovernment agencies - such as the SBA, SBIC,SBIR - venture capitalists, banks and othercommercial institutions, and nonprofits theopportunity to engage deeper with the Latinopopulation, and specifically, the Latino entrepreneur.In turn, further surveys and work with this researchpanel of LOBs can track the successes created bychanges in public policy and public investments.
IntroductionThe Stanford Latino Entrepreneurship Initiative(SLEI) will conduct annual surveys of Latinobusiness owners in the United States and providetimely reports on its findings. This document,the first State of Latino Entrepreneurship Report,provides academic researchers, policy makers andbusiness leaders with a timely update of SLEI’sresearch results.The research report’s data is derived from thefollowing: a) a carefully cleaned database of1,432,746 LOBs compiled from an aggregation ofseven commercial databases provided the contactlist for an initial survey of business owners and b)two survey panels were created--of 1,831 and 368Latino business owners drawn from the databasewho agreed to participate in ongoing surveys andresearch. This panel, believed to be the largeststatistically significant panel on LOBs ever created,provided the data for our initial analysis. Datamodels, using government surveys as the basis,were used to calibrate and weight the panel dataand estimate more representative results. All furthermention of the “research panel’s data” in this reportrefers to model corrected data.The lead researcher for this report, Dr. Doug Rivers,senior fellow at the Hoover Institution and professorof political science at Stanford University, is oneof the world’s leading experts on survey research.Previously, Dr. Rivers taught at Harvard Universityand at the California Institute of Technology.7Section I
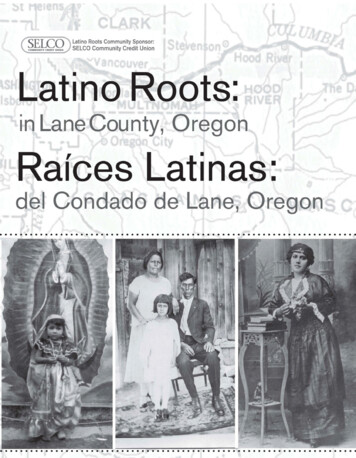
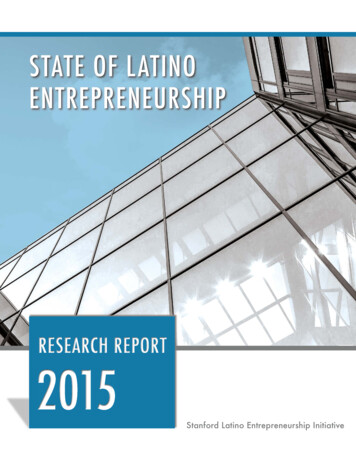
PopulationThe Latino Population, Market & PowerLatinos, a growing force in United Stateseconomy, currently represent 17% of the overallU.S. population (2013) and by 2060, Latinos willrepresent 30% of the U.S. population.1 Accordingto the Pew Research Center (PRC), the Hispanicpopulation has grown 592% since 1970, comparedto only 56% for the overall U.S. population.2 In oneof its demographic studies, the PRC determined thatthe average age of native born Latinos is 18 years ofage with roughly 1 million entering adulthood everyyear.3 Clearly, the U.S. economy faces a future inwhich almost one out of every three workers andone out of every three consumers will be Latino.Their ability to provide skilled labor and to havesufficient resources to consume will determine thefuture health of our national economy.Nielsen, a leading global information andmeasurement firm, adds that Latinos are considered“the most influential segment since the BabySection II8Boomers,” and “will drive shifts in purchasingbehavior and brand relationship.”4 In fact, thegrowth in population has created a 1.5 trillionLatino consumer market,5 a market that, in 2014,was larger than the economy of all but 15 countriesin the world.6The influence of the Latino population on theeconomy is undeniable - from purchasing power tothe labor supply. Yet, of potentially more interestis the recent explosion in the number of LatinoOwned Businesses (LOBs). According to a recentnews report, the number of Latino small businessesis growing at three times the rate of the nationalaverage,7 an extraordinary level of entrepreneurshipthat suggests Latinos play a substantial role in localjob creation and economic development. SLEIseeks to more fully understand this rapidly growingsegment of our economy in an effort to betterpromote its development and impact.
CurrentState of LOBs3.1 Current DataMuch of the data on LOBs is out of date. Mostgenerally comes from the Survey of BusinessOwners (SBO), conducted by the U.S. CensusBureau every five years with results reported threeyears after the data are collected. For example, the2007 SBO report was made available in 2010, andthe 2012 report was issued in August 2015. Beyondthe basic questions addressed by this Census, littleis known about the particulars of U.S. LOBs.In 1997, Latinos owned an estimated 1.2 millionbusinesses. The number grew to 1.5 million by2002, increased to 2.3 million in 2007, and by 2012,increased to 3.3 million (which represents 12% ofthe 27.6 million businesses in existence in the U.S.that year).The growth rate of the number of LOBs went from43.6% (2002-2007) to 46.9% (2007-2012), a 3.3%increase over the two time periods. This is in sharpcontrast to the growth rate of the number of NonLatino Owned Businesses (NLOBs), which wentfrom 4.4% (2002-2007) to 0.7% (2007-2012), adrop of 3.6%.An important metric to put the LOB growth incontext is the Kauffman Index of Entrepreneurshipdeveloped by the Kauffman Foundation. This metricfocuses on “entrepreneurial outcomes, as opposedto inputs.” This index takes into account the birthrate of new entrepreneurs, the opportunity share ofnew entrepreneurs, and startup density.According to Kauffman’s 2015 report, in 2014,Latinos had the highest rate of new entrepreneurs,with an index of 0.46 compared to 0.29 for Whitesand 0.22 for African Americans.8continued on page 109Section III
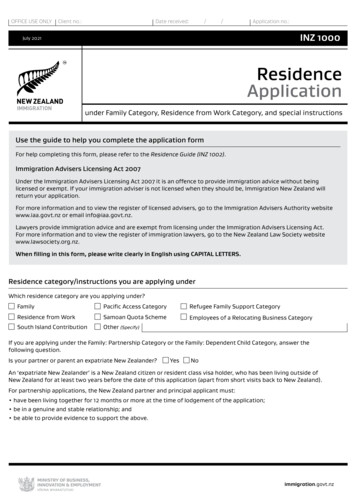
CurrentState of LOBs3.3 Sales & EmployeesNLOBs average sale per firm increased from 426,482 to 573,209 between 1997 to 2012 - anincrease of 146,727 - LOBs average sales per firmwent from 155,242 in 1997 to 155,806 in 2012- an increase of only 564. This gap in averageperformance between LOBs and NLOBs has been asignificant pattern over at least the last decade and ahalf. As such, it represents a significant opportunityfor the future growth and development of ouroverall U.S. economy.In 2012, the 3.3 million LOBs had an average of8.6 employees per firm, 18,027 per employee,an average of 155,806 in annual sales per firm,employing 2.5 million workers and generating atotal of 517 billion in sales. This accounted for1.5% of the 34 trillion sales by all businesses. Bycomparison, the 24 million NLOBs averaged 12employees per firm, 47,677 per employee, and 573, 209 in annual sales per firm-- over 3.5 timesmore than the average LOB.Perhaps most significant, only 1.9% of LOBsgrossed over 1 million in revenue, roughly 2.5times lower than the 4.9% of NLOBs who reachedthat mark in 2007.9Figure 1 compares the average sales per firm forLOBs and NLOBs from 1997 through 2012. While10Average Salesper Firm ComparisonNon LatinoOwned BusinessChange in Average SalesLatino-OwnedBusiness 130,083 69,6380199720022007 426,482 155,242 373,487 6640 141,044- 14,198 443,125 155,141 573,2092012Section III 14,098 155,806- 52,9941997 -2002Figure 12002-20072007-2012
PERCENTAGE OF LATINOS OFTHE OVERALL U.S. POPULATION201317% 13%206030%AVERAGE AGE OFNATIVE BORN LATINOSLATINOSOTHERPOPULATION GROWTH SINCE 1970According the Pew Research Center0Latinos592%18OtherYEARSOLD56%According to NielsenBUSINESSLatinos are consideredIn 2012NUMBER OF ALL BUSINESSES“the most influentialsegment since theBaby Boomers”12%and“will drive shifts in purchasing behaviorand brand relationship.”The growth in population hascreated a: 1.5TRILLIONLATINOCONSUMERMARKETNon LatinoOwnedLatinoOwned1127.6million86.8%Public &Non-ProfitsGROWTH RATE CHANGEFrom 2007 to 2012Latino-Owned0Non Latino-Owned3.3%-3.6%Figure 2Section IIIa market larger than the economyof all but 15 countries in the world1.2%
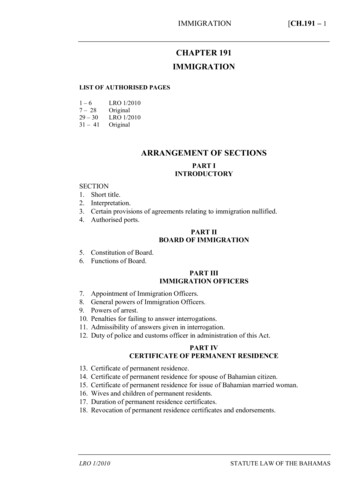
What FutureCan Look Like4.1 Economic ImpactAs the Latino population grows and Latinobusinesses emerge at an even faster rate, a timelyunderstanding of who these entrepreneurs areand how to support their growth is necessary tostrengthen the economic fabric of the nation. Toaddress these issues this initiative has created threecomplementary data sources to help researchers,policymakers and business leaders understand thecurrent generation of Latino Owned Businesses(LOBs.) These are 1) the 2012 U.S. Census SBOdataset; 2) the 2014 initiative’s database of LOBs;and 3) the 2014/15 initiative’s survey panels ofLOBs.The current gap between the average yearly salesper firm generated by LOBs and NLOBs points toan exciting opportunity for significant growth inthe U.S. economy. Our analysis first focused onachieving a better understanding of the impact ofthe current gap as well as its potential impact from2002 to 2012.The potential impact on the U.S. economy wascalculated by determining the total sales in a givenyear if LOBs generated the same level of averagesales per firm as NLOBs over the period from 2002to 2012. The LOBs’ average sales per firm werethe actual average sales per firm reported in U.S.Census SBO for those years. The gap betweenpotential total sales and LOBs total sales is namedthe Opportunity Gap.continued on page 13The data sources will expand throughout the years,yet they already provide insight on the economicforce of the Latino entrepreneur, and the resultshighlight opportunities for impact.12Total Sales Actual vs PotentialOpportunity Gap 2002 - 2012(trillions USD) 1.90 1.38trillon 1.00Potential 0.42trillon 0.52 0.64 0.65trillon 0.35 0.220LOBs20022007020122002If LOBs Average Sales per Firm NLOBs Average Sales per FirmSection IVActual Total Sales for LOBsFigure 320072012
What FutureCan Look LikeAs shown in Figure 1, the average sales per firm ofNLOBs grew by roughly 200 thousand from 1997to 2012, while the average sales per firm for LOBsgrew by roughly 563. The total potential sales forLOBs in 2012 was 1.90 trillion - an opportunitygap of over 1.38 trillion. This gap grew from just 0.42 trillion to 1.38 trillion from 2002 to 2012(see Figure 3).U.S. economy is evident; however, to effectively doso, additional insight is needed to better understandwhy LOBs are smaller. This report addresses thisquestion in Section V.To further put the opportunity gap in perspective,an independent economic analysis conducted byLBAN determined that after eliminating the effectsof industry and regions, LOBs’ impact to GDPgrowth, in contrast to total sales, in 2009 wouldhave increased it by 40% if LOBs’ output were thesame as the output of NLOBs in that year.We can expect this Opportunity Gap to widen asthe population and number of LOBs continues togrow. The economic impact of scaling LOBs on the13Section IV
Why areLOBS Smaller?In the first phase of the research - the first annualLatino Owned Business (LOB) survey - respondentswere asked about industry, customer base, companysize, age, ownership structure, source of capital, andbusiness challenges.All of this report’s research analysis indicates thatLOBs are dramatically smaller in size than NLOBs,although Latinos rank highest in entrepreneurialactivity. But why are they smaller? Reasons oftencited for lack of size are industries LOBs competein and the customer base they target. However, theresearch challenges these perceptions and adds newexplanations for why Latinos have been relativelyunsuccessful in effectively scaling their companies.Section V145.1 Industry, Customers, Capitaland OwnershipIndustriesThe survey data on LOBs paints a picture ofdiversity of industries and integration into theeconomy. When comparing the mixture ofindustries of LOBs to NLOBs (Figure 4), the resultscounter the perception that LOBs are small becauseLatino entrepreneurs choose to open businesses insmall industries (measured by Average Sales perFirm).Figure 4 shows that in the top 5 industries inAverage Sales per Firm, the difference in thepercentages of LOBs and NLOBs in each of thoseindustries is less than 1%. The data also show thatof the bottom 5 industries in Average Sales percontinued on page 16
INDUSTRIES LOBS & NLOBSAVERAGESALESIn percentage 2012(millions USD)Latino Owned BusinessNon Latino Owned BusinessUtilities0.1%0.07%1.9%2.6%Wholesale tradeInformationManagement ofcompanies 11.51.5%2.1%ManufacturingMining. quarringand oil and gas 11.8 80.1%0.5% 7.90.9%1.4% 5.10.01%0.07% 4.77.7%Retail trade1.6%Finance andinsurance 2.43.7%7.3%Transportation andwarehousing 2.34%14.3%Construction15.9%7.3%3%Arts. entertainmentand recreation10.5% 1.18.9%8.4%Professional. scientificand technical 1.3 1.25%Health care andsocial assistance15 1.114.9%0.5%0.9% 1.14%Real estate andrental and leasing 1.110.4%Accommodationand food services3%3%Educationalservices1.6%2.4% 1 0.816.7%Other services(except public)12.8%0.01%0.03% 0.5 0.1Figure 4Section VIndustries notclassified 1.810.2%Administrative andsupport and wasteAgriculture.forestry. fishing 3.49.3%
Why areLOBS Smaller?Figure 6 shows the percentages of LOBs andNLOBs by industry as compared to ProjectedGrowth Rates. It reveals that LOBs are surprisinglyoversubscribed in the industries with the highestprojected growth rates and have less or similarpercentages of businesses in the industries with thelowest growth rates-- further challenging the notionthat LOBs concentrate in industries that are small ornot growing rapidly.Firm, the difference in the percentages of LOBs andNLOBs in each of those industries is less than 7%.The most visible differences are in the ProfessionalServices and Real Estate industries. In the former,over 14% of NLOBs are in that industry, comparedto 8% of LOBs. In the latter, there is a 6% gapbetween NLOBs and LOBs. However, Figure 4shows that Real Estate and Professional Servicesrank 14th and 16th out of the top 20 industries inAverage Sales per Firm.CustomersThe two industries where LOBs have a higherpercentage than NLOBs - Construction andAdministrative Support - are ranked 10th and 11thin Average Sales per Firm. Both LOBs and NLOBshave a small percentage of firms in the top fourindustries in Average Sales per Firm - Utilities,Wholesale, Manufacturing, Mining.A second common explanation of why LOBsremain small points to the perception that theymainly serve Latino customers and even thoughthis segment of the U.S. population is growingrapidly it still is a relatively small proportion ofall consumers. We investigated the reality of thisperception by examining the profile of the customercontinued on page 1816CUSTOMERSMostlyNot on20%Figure 5
INDUSTRIES FOR LOBS & NLOBSGROWTHRATESIn percentage 2012Projected for NLOBs2012 - 2020Latino Owned BusinessNon Latino Owned Business14.3%Construction26%10.2%Health care andsocial assistance10.5%24%8.9%Administrative andsupport and waste15.9%7.3%16.7%Other services(except public)12.8%8.4%Professional. scientificand technical14.9%23%22%21%Mining. quarringand oil and gas0.1%0.5%18%Industries 9%2.6%Wholesale trade17%Management ransportation andwarehousingAgriculture.forestry. fishingFinance %9%9%Figure 6Section VAccommodationand food services11%11%5%Retail trade1712%3.7%Real estate andrental and leasingArts. entertainmentand recreation15%4%
Why areLOBs Smallerbase of LOBs.We found that LOBs demonstrate a significantamount of integration into the broader economyas measured by the mix of customers they serve.As shown in Figure 5, only 20% of LOBs have a“Mostly Latino” customer base, and roughly 80%of LOBs have either predominantly “Not Latino”or an equal mixture of “Latino” and “Non-Latino”customers. It is clear that, overall, LOBs do notdepend totally on the Latino consumer for theirsuccess. As such, this does not appear to be a robustexplanation for their average smaller size.We then explored the possibility that age of a firmmight influence the customer base and explain whyLOBs are systematically smaller than NLOBs.Since older firms would normally tend to be largerthan younger firms, one might predict that the olderfirms focus more on a Latino customer than theyounger firm and that is why they remain relativelysmall to in relation to NLOBs of the same age.Our analysis yielded the exact opposite results.Comparing mature firms, defined as those with30 years in business, and younger firms, definedas those with less than 5 years in business, fewermature LOBs (7.6%) serviced a “Mostly Latino”customer base than younger LOBs (22.5%). So, theolder firms are not being restricted in their growthby the type of customer they serve. In fact, sincethey serve both Latinos and non-Latinos, one wouldexpect them to be able to grow more easily than ifthey were only serving Latinos.continued on page 19Equalmixture47%MostlyNot Latino1833%MostlyLatino20%YOUNGMATUREUnder 6 years oldSection V48.5%Over 30 years old49%37.1%7.6%22.5%Figure 755.4%
Why areLOBs SmallerCapital SourcesPerhaps the most commonly accepted explanationof why LOBs remain small is that they do not haveaccess to capital. We asked our survey participantsto identify their primary sources of capital. Theirresponses are summarized in Figure 8. Please notethat respondents identified more than one source fortheir financial support.As illustrated in Figure 8, the most commonsource of capital, cited by almost 70% of LOBrespondents, was “Personal Savings.” The nextthree most common sources—very distant runnerups—were “Credit Cards” and “Friends” and“Personal Bank Loans.” Surprisingly, only 6.1%of LOBs in this panel have financed their businesswith a commercial loan and roughly 2.4% havefinanced their business with a Government Loan(see Figure 8.), Indicating a near-absence ofcontinued on page 20LATINOOWNEDBUSINESSNON rsonalSavingsCredit CardsFriends19PersonalBank LoanNoneNeededCommercialBank Loan13.4%6.5%20.8%6.1%10.8%2.4%1.3%Figure 8Section VGovernmentLoan10.7%
Why areLOBs Smallerconventional institutional capital sources.More specifically, the venture capital world hasbeen almost totally absent in the funding of LOBs.A recent 2014 study focusing on analyzing thetargets of funding in the VC industry found thatless than 1% of venture-backed startups are foundedby Latinos.10In contrast, NLOBs were more likely to look toconventional institutional capital sources, likeBanks, for funding. Moreover, 20.8% of NLOBsclaim that they do not need any funding, comparedto only 6.5% of LOBs reported in our survey.11Clearly a stark difference in funding sources andneeds between LOBs and NLOBs exists.OwnershipOwnership patterns could potentially affect acompany’s ability to grow. If founders wereSection V20unwilling to allow outside investors to provide thecapital needed to fund growth because it wouldmean having to give up part ownership of this firm,then scaling becomes more difficult. An explorationof the ownership patterns was thus undertakento determine if they might potentially be anotherinhibitor to LOB growth.We found that LOBs are predominantly familyowned. As illustrated in Figure 9, approximately75% of LOBs are solely owned. “Husbandand Wife” joint ownership and “Other FamilyMembers” ownership combine for 17%, leaving“Non-Family” ownership at 8%. There are alsodifferences between LOBs and NLOBs, with92% of LOBs compared to 85% of NLOBs beingfamily owned.continued on page 22
FIRM OWNERSHIPPercentageNon Latino OwnedBusinessLatino y8%15%Sole OwnerHusbandand Wife8%5%2175%12%OWNEROF LOBsNon-FamilyOther FamilyMembersSection VFigure 9
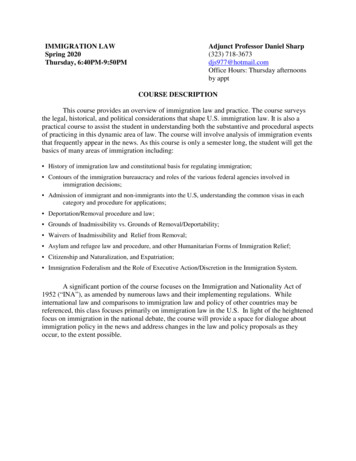
Why areLOBs Smaller5.2 Capacity for GrowthExternal ContributionsOur study indicates that Latino business ownersare motivated to become entrepreneurs byinternal factors. When asked, only 37% of Latinoentrepreneurs responded that external marketopportunity was a key inspiration for becomingbusiness owners. As shown in Figure 10, all otherresponses from Latino business owners pointto reasons based on internal impact-- buildingsomething to pass down to children, parents orfamily members, working with family or friends, orhaving control of their financial future. These resultsare consistent with a 2011 study, which found thatLatinos were 16% more likely to start a business toprovide financially for their family than the generalpopulation. The same study found that LatinosSection V22were 57% more likely to start a business to havesomething tangible to pass on to their children.12These inspirations are further affirmed by themanner in which businesses were started, with68% of respondents launching their businessalone. When new businesses are driven by marketopportunity, the market dictates the skill set of thefounders, increasing the likelihood of multiplebusiness owners. This is evident by taking a lookat the top 100 Silicon Valley startups, where solofounders are rare.Personal motivations contribute to more thanbusiness creation. They also influence ownershipand capital decisions. As seen in Figure 11, 88%of respondents own their business either alone orwith an immediate family member, demonstratinga desire to keep the business close and within theircontinued on page 25
INSPIRATIONWhich of the followingthings inspired you tobecome a business owner?37%Marketplaceopportunity0Build something to pass
Further, our results indicate that Latino business owners are motivated primarily by internal, non-economic factors. When asked, only 37% of Latino entrepreneurs responded that external market opportunity was a key inspiration for becoming business owners. Instead, Latino business owners point to reasons based on internal impact-- building