Transcription
FOOD INSECURITY DURING PREGNANCY IN CANADABYJORDAN MAKA THESIS SUBMITTED IN CONFORMITY WITH THEREQUIREMENTS FOR THE DEGREE OF MASTER OF SCIENCEDEPARTMENT OF NUTRITIONAL SCIENCESUNIVERSITY OF TORONTO COPYRIGHT BY JORDAN MAK 2019
Food Insecurity During Pregnancy in CanadaJordan MakMaster of SciencesDepartment of Nutritional SciencesUniversity of Toronto2019ABSTRACTUsing the Canadian Community Health Surveys (2005-2014), the objectives of this thesiswere to characterize the relationship between household economic circumstances and foodinsecurity during pregnancy; and to explore the health and well-being of food-insecure pregnantwomen. 13% of pregnant women reported experiences of food insecurity in this pan-Canadiansample (n 4,817). Adjusting for confounding sociodemographic variables, lower household income,reliance on social assistance, renting one’s dwelling and the presence of children in the householdwere associated with moderate-severe food insecurity. Moderate-severe food insecurity wasassociated with greater adjusted odds of multiple measures of poorer mental health. Food insecurityduring pregnancy is a public health problem, requiring evidence-informed policy solutions explicitlyaimed to reduce food insecurity. Specifically, policy action should focus on factors associated withvulnerability identified in this study, such as low income and reliance on social assistance.ii
ACKNOWLDGEMENTSI would like to thank the following for making this thesis possible:My thesis supervisor, Valerie Tarasuk, who through her mentorship in this project, taught me howto use science to advocate for healthier, more equitable communities.My advisory committee members, Prof. Deborah O’Connor and Dr. Daniel Roth, whose feedbackwas invaluable in improving the research methods and statistical analyses used in this thesis.The Canadian Community Health Survey participants, who took the time to share their experiencesof food insecurity and health.My graduate student colleagues, for their camaraderie through the challenges of this degreeprogram.My parents, for providing me with the opportunities that have led to my pursuit of this degree.And finally, my chosen family, especially my partner Kristian, whose love and encouragementsupported me in the completion of this degree.iii
TABLE OF CONTENTS1.INTRODUCTION . 12.LITERATURE REVIEW . 22.1. Measurement of Food Insecurity in Canada . 22.1.1.Definition . 22.1.2.Monitoring . 32.1.3.Classification . 42.2. Epidemiology of Household Food Insecurity in Canada . 72.2.1.Prevalence . 72.2.2.Predictors . 92.2.3.Public Policy and Food Insecurity . 132.2.4.Public Policy and Food Insecurity During Pregnancy . 162.3. Food Insecurity and Health . 213.2.3.1.General Population . 212.3.2.Health During Pregnancy . 242.3.3.Birth Outcomes . 27RATIONALE AND OBJECTIVES . 293.1. Rationale. 293.2. Objectives . 294.DATA AND METHODS . 304.1. Data Source . 304.1.1.Canadian Community Health Survey . 304.1.2.Analytic Sample. 314.2. Measures. 32iv
4.2.1.Food Insecurity . 324.2.2.Economic and Sociodemographic Measures . 334.2.3.Health and Well-Being . 354.3. Statistical Analysis . 375.4.3.1.Household Economic Predictors of Food Insecurity . 374.3.2.Food Insecurity during Pregnancy and Health . 38RESULTS . 405.1. Prevalence of Food Insecurity during Pregnancy in Canada . 405.2. Sociodemographic Characteristics of Analytic Sample . 415.3. Household Economic Predictors of Food Insecurity. 455.4. Health & Well-Being of Food-Insecure Pregnant Women . 496.DISCUSSION . 526.1. Summary of Key Findings . 526.2. Household Economic Predictors of Food Insecurity. 526.3. Health & Well-Being of Food-Insecure Pregnant Women . 566.4. Study Limitations . 606.5. Implications for Policy . 656.6. Implications for Healthcare Providers. 676.7. Directions for Future Research . 677.CONCLUSIONS . 698.REFERENCES. 70APPENDIX A: HOUSEHOLD FOOD SECURITY SURVEY MODULE . 79APPENDIX B: EXTENDED TABLE 5.4 . 86APPENDIX C: SENSITIVITY ANALYSES . 88v
List of TablesTable 2.1 Household food insecurity status as defined by Health CanadaTable 2.2. Relative adjusted odds of experiencing food insecurity by severity, compared toOntario in 2011-2012Table 2.3 Income Supplements for Pregnant Women in Manitoba, New Brunswick, andNewfoundland and LabradorTable 2.4 Value of additional income supplements for pregnant women receiving socialassistanceTable 4.1 Provinces and Territories Monitoring Household Food Insecurity by CCHS CyclesTable 4.2 Summary of food insecurity coding using responses from the 10-item adultcomponent of the HFSSMTable 4.3 Summary of health and well-being variablesTable 4.4 Summary of model used to determine household economic predictors of foodinsecurity amongst pregnant adult womenTable 4.5 Summary of model used to determine associations between food insecurity andhealth during pregnancyTable 5.1 National Prevalence of Food Insecurity by Two-Year Cycle Amongst PregnantAdult WomenTable 5.2 Percentage of respondents experiencing food insecurity as described on the 10-itemadult food security scale due to a lack of money in the past yearTable 5.3. Weighted proportion of adult pregnant women by sociodemographic characteristic,CCHS 2005-2014 (n 4,817)Table 5.4 Adjusted odds of food insecurity by severity of food insecurity, pregnant women inCanada, CCHS 2005-2014 (n 4,817)Table 5.5 Correlation coefficients of household economic model covariates (n 4,817)Table 5.6 Variance inflation factors of household economic model covariates (n 4,817)Table 5.7 Weighted prevalence of poor health and well-being amongst pregnant food-insecurewomen compared to food-secure women, CCHS 2005-2014 (n 4,754)Table 5.8 Adjusted odds of poor health and well-being amongst pregnant food-insecurewomen compared to food-secure women, CCHS 2005-2014vi
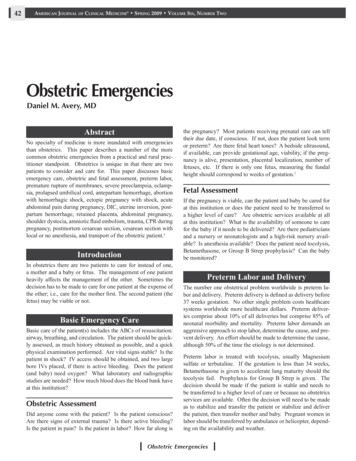
List of FiguresFigure 2.1 Percent of Canadians in moderate and severe food-insecure households by age andgender (CCHS 2011/2012)Figure 5.1 Prevalence of marginal, moderate-severe and total food insecurity amongst pregnantwomen by sociodemographic characteristic, CCHS 2005-2014 (n 4,817)vii
List of AbbreviationsAHEI-PAlternate Healthy Eating Index modified for PregnancyCCHSCanadian Community Health SurveyCPNPCanada Prenatal Nutrition ProgramHFSSMHousehold Food Security Survey ModuleNHANESNational Health and Nutrition Examination SurveyUSDAUnited States Department of Agricultureviii
1. INTRODUCTIONHousehold food insecurity, the inadequate or insecure access to food due to financialconstraints, is a public health problem in Canada, affecting 12.6% or approximately 4 millionCanadians in 2012 (1). Food insecurity encompasses a range of experiences beginning with anxietyover potential food insufficiency, qualitative compromises in food selection, and in its mostextreme forms, quantitative compromises such as skipping meals due to a lack of money.Evidence from the US and UK suggests food insecurity during pregnancy is associatedwith higher odds of poor maternal mental health, pregnancy complications and poor birthoutcomes (2-8). However, no research has evaluated the social epidemiology or the health andwell-being of food-insecure pregnant women in Canada. Current public policies recognize the needfor additional supports during this critical period of development, with programs on the federaland provincial level providing income and food supplements to pregnant low-income women.Although these programs are designed with the vaguely-defined goal of assisting recipients to eathealthy foods during pregnancy, none of these policies are designed explicitly to reduce oreliminate food insecurity.The purpose of this thesis is to begin characterizing food insecurity during pregnancy inCanada by i) elucidating the relationship between household economic circumstances and foodinsecurity; and ii) comparing the health and well-being of food-insecure and food-secure womenduring this life stage. Results from this study may be used to identify areas for further research andstart to illustrate the health and well-being of pregnant food-insecure women.1
2. LITERATURE REVIEWIn order to contextualize research on food insecurity during pregnancy, this literaturereview begins with how household food insecurity is defined, measured and classified. As nostudies have been conducted on food insecurity during pregnancy in Canada, current knowledgeon the epidemiology of food insecurity in the general population is discussed. Then, research onthe relationship between public policy and household food insecurity is described in order toconsider how policies to support low-income women during pregnancy could impact foodinsecurity.In the last section of the literature review, studies on associations between food insecurityand health are reviewed, beginning with findings in the general Canadian population. This isfollowed by studies on food insecurity during pregnancy and health from other high-incomecountries to highlight the potential for similar relationships in Canada.2.1. Measurement of Food Insecurity in Canada2.1.1. DefinitionHousehold food insecurity in Canada is defined as the inadequate or insecure access tofood due to financial constraints (1). In high-income countries, food insecurity is measured at thehousehold level and focuses on the economic ability of households to reliably access food.Household food insecurity is a distinct aspect of food security that is more broadly definedby the Food and Agriculture Organization of the United Nations, where ‘all people, at all times,have physical, social and economic access to sufficient, safe, and nutritious food that meets theirfood preferences and dietary needs for an active and healthy life (9).’ While this definition can beused generally to conceptualize food security, operationalized measurement in Canada focuses on2
the financial inability to access food, which is the aspect of food security that has been identifiedas an urgent public health problem.2.1.2. MonitoringThe measurement of income-related household food insecurity on national surveys inCanada has varied over the past 25 years. The first survey measuring food insecurity in Canadaexplored experiences of severe food insecurity in children on the 1994 National LongitudinalSurvey of Children and Youth (10). This question looked into the most extreme manifestation offood insecurity – hunger – amongst children, asking a single question: ‘has your child everexperienced being hungry because the family has run out of food or money to buy food?’This measure was followed by surveys with more sophisticated measures of food insecurityat the household level in 1996 and 1998 on the National Population Health Survey (11). Ratherthan assessing severe food insecurity as a binary experience of hunger, the 1998 surveydifferentiated experiences of insecure food access based on i) worry of inadequate food access, ii)compromise in the quality or variety of foods, or iii) a lack of quantity of food on the householdlevel due to a lack of money.Since 2004, Statistics Canada has monitored household food insecurity on the nationallevel using the Household Food Security Survey Module (HFSSM), which measures “uncertaintyand insufficiency of food availability and access that are limited by resource constraints, and theworry or anxiety and hunger that may result from it (12, 13).” The use of this household measurehas remained consistent since, allowing for the monitoring of changes over time and the ability topool samples of sub-populations for more detailed study.The HFSSM was developed by the United States Department of Agriculture and consistsof 18 self-reported questions pertaining to the experience of food insecurity amongst adults and3
children in a household over the past twelve months (14). Questions are deliberately sequencedusing Rasch modelling and a skip pattern is used for the 18 questions to reduce respondent burden.Questions on more severe experiences of food insecurity are not asked if less severe experiencesare not affirmed (see Appendix A for all 18 questions on the HFSSM and skip pattern).Questions on the HFSSM relate to the presence and frequency of a variety of experiencesrelating to poor food access in the household. These include worrying that food would run outbefore obtaining money to buy more, not being able to consume balanced meals, cutting the sizeof meals, skipping meals, and at its most extreme, going a whole day without eating. All questionsare asked in the context of not having enough money to ensure experiences were due to a lack offinances as opposed to experiences of time restraints or voluntary dieting.Ten questions relate to the experiences of adults and the remaining eight questions relateto the experiences of children. The combination of affirmative responses can be used to determinefood insecurity for adults in a household, children in a household if present, and an overall statusfor the household. In cases where more than one adult or one child is present in the household, themodule is not able to determine the food insecurity status of one single individual.2.1.3. ClassificationHealth CanadaUsing responses from the HFSSM, Health Canada categorizes households into threecategories: i) food-secure, ii) moderately food-insecure and iii) severely food-insecure (15). Table2.1 shows the classification of food security status by the number of affirmative responses to the18-item module. If adult household food security differs from child household food security, themore severe of the two determines household food insecurity status.4
Table 2.1 Household food insecurity status as defined by Health Canada (15)StatusFood-SecureModerate foodinsecuritySevere foodinsecurityInterpretationNo or one indicationof difficulty withincome-related foodaccessCompromise inquality and/orquantity of foodconsumedIndication of reducedfood intake ordisrupted eatingpatterns10-item adult scale8-item child scale0 or 1 item on either scale2 to 5 positiveresponses2 to 4 positiveresponses6 or more positiveresponses5 or more positiveresponsesUnited States Department of Agriculture (USDA)The USDA classifies household food insecurity differently than Health Canada. Mostnotably, categorization of a household as food-insecure begins at a higher threshold, with 3 ormore responses to the HFSSM considered food-insecure. For ease of understanding, where USliterature is presented in this thesis, the number of affirmative responses to the HFSSM used todefine food insecurity is specified.Marginal Food InsecurityArguments for the inclusion of marginal food insecurity (defined by one affirmativeresponse in Canada or one to two affirmative responses in the US) as a separate category fromfully food-secure and moderate-severely food-insecure households have been discussedextensively in the literature due to their distinct vulnerability (5, 16, 17). Supporting evidenceincludes separate and discretely intermediate differences between individuals living in householdswith no affirmative responses and greater than one or two responses in measures of health,healthcare utilization, material hardships, spending patterns and household characteristics (18-21).5
Studies examining the health and well-being of individuals from infancy to adulthoodliving in marginally food-insecure households have identified poorer physical and mental healthdistinct from those in fully food-secure and moderate-severely food-insecure households (18, 2224). A greater description on the impacts of food insecurity on health occurs in Section 2.3.1. Inbrief, living in a marginally food-insecure household is associated distinctly with poorer physicalhealth such as number of chronic conditions, poorer mental health such as mood and anxietydisorders, and greater behavioural problems amongst children such as inattention and academicdifficulties (18, 22-24). Furthermore, an Ontario study demonstrated total healthcare costs over a12 month period per adult living in marginally food-insecure households to be significantly morethan those living in food-secure households and significantly less than those in moderately foodinsecure households in unadjusted and adjusted models (21).A study conducted amongst low-income families in an urban centre in Canadademonstrated that households with one or two affirmative responses to the HFSSM hadsignificantly greater odds of experiencing material hardships and constrained food purchasingcompared to households with no affirmative responses (20). This study also suggested that anincreasing number of affirmative responses was associated with an increasing burden of materialhardships, suggesting that the experience of marginal food insecurity is distinct from experiencesof moderate-severe food insecurity.In the US, an analysis of households with one or two affirmative responses on the HFSSMsuggests that their household characteristics are significantly distinct from households with noaffirmative responses and more similar to those with greater than two affirmative responses (16).In a study of pregnant women in the US, socioeconomic and demographic variables wereassociated with both marginal food insecurity (1-2 affirmative responses to HFSSM) and6
moderate-severe food insecurity, suggesting that differences exist between marginally foodinsecure and fully food-secure households with pregnant women (5). Although distinctionsbetween marginally food-insecure and fully food-secure households have been made amongstpregnant women in the US, no Canadian studies have highlighted differences between the twoclassifications amongst households with pregnant women in Canada.Weekly household food expenditures amongst marginally food-insecure households (1-2affirmative responses to HFSSM) in the US are significantly less than food-secure households andsignificantly more than food-insecure households, suggesting marginally food-insecurehouseholds experience a distinct level of material deprivation (16). Canadian research has sincevalidated similar patterns in household spending amongst marginally food-insecure households (1affirmative response to HFSSM) with spending patterns more similar to moderate-severely foodinsecure households compared to food-secure in the prioritization of basic needs such as food overdiscretionary spending and investments/assets (19).Considering marginal food-insecurity as part of food-secure households mayunderestimate insecure access to food and mask the household characteristics and health impactsof this experience. Measurements that include marginally food-insecure households may betterassist in improved accounting of food-insecure households requiring assistance and the fullspectrum of associations between food insecurity and health.2.2. Epidemiology of Household Food Insecurity in Canada2.2.1. PrevalenceGeneral PopulationThe prevalence of household food insecurity in Canada is determined using the CanadianCommunity Health Survey (CCHS), a national cross-sectional survey representative of 97% of the7
Canadian population. The CCHS excludes individuals living on First Nations reserves, those livingin institutions full-time and certain remote Quebec health regions (see Section 4.1.1. for detailedsurvey design). According to the most recent national estimate from CCHS 2012, 12.6% ofhouseholds or approximately 4 million Canadians experience a degree of food insecurity in Canada(1). It is also estimated that 16% of households with children under the age of 18 experience foodinsecurity (1).Populations Related to Pregnant WomenIn addition to measuring food insecurity on the household level, the prevalence of individualsliving in households experiencing food insecurity is commonly measured due to the relationshipbetween food insecurity and poorer health. No studies have estimated the prevalence of foodinsecurity amongst pregnant women in Canada. However, using data from Statistics Canada fromCCHS, an elevated prevalence of food-insecure individuals amongst related populations have beenidentified. For example, the prevalence of moderate-severe food insecurity was 34-42% higheramongst women of childbearing age (20-44 years) compared to men in 2011-2012 (Figure 2.1)(25). During the life stage chronologically closest to pregnancy for which Canadian data areavailable, an analysis of a pooled sample of women from 2005-2014 who had given birth withinthe past 2 years identified a 17.6% prevalence of food insecurity (26). Households led by lonefemale parents also experienced the highest prevalence of food insecurity by householdcomposition at 34.3% of households compared to male lone parents at 17.2% in 2012, furtherhighlighting gender disparities amongst food-insecure households.8
Figure 2.1 Percent of Canadians in moderate and severe food-insecure households by ageand gender (CCHS 2011/2012) (25)9.1% 9.7%8.9%11.9%11.1%7.8%6.5% 7.7%2.1% 2.9%12 to 19 years20 to 34 years*35 to 44 years*Males45 to 64 years65 years and overFemales* significant difference in prevalence between females and males at p 0.052.2.2. PredictorsIn addition to the prevalence of food insecurity in the general Canadian population,multivariable analyses have been conducted to identify associations between householdcharacteristics and the odds of experiencing food insecurity when accounting for confoundingcharacteristics (27-30). Beyond identifying simple correlations, recognizing predictors of insecurefood access allows for a better understanding of which characteristics are associated with increasedvulnerability in Canada. This can better facilitate the development of public policies by targetingpredictors associated with this problem.Household Income, Homeownership, Source of IncomeAs measurement of food insecurity in Canada is defined by experiences due to financialconstraints, low before-tax annual household income is a strong predictor of experiencing foodinsecurity in adjusted and unadjusted models (27-29). Income accounts for a large component ofwealth within a household and thus its ability to secure access to food. However, there arelimitations to before-tax annual household income as a predictor, as this measure does not captureafter-tax income or other components of wealth such as assets and savings. Household income also9
does not account for variability in expenses between households such as costs for food, medication,debt, and housing.In addition to household income, other economic circumstances such as homeownershipand a household’s main source of income are consistently cited as among the strongest predictorsof experiencing food insecurity in Canada (27-29). These characteristics reflect the capacity forhouseholds to weather negative income shocks such as unexpected decreases in income orincreases in expenditures (31).For example, homeownership represents household wealth and assets beyond income aswell as access to credit, which assists in buffering a household from economic constraints that mayresult in food insecurity (32). However, research has not yet explored potential differences betweenhomeowners with and without a mortgage which may further demonstrate differences in foodinsecurity risk due to variation in debts and assets. In contrast, renters are more vulnerable toinflationary pressures that could contribute to negative income shocks resulting in experiences offood insecurity (32).Notable variation in the odds of experiencing food insecurity has been observed by ahousehold’s main source of income. Most vulnerable relative to households relying onemployment for income are those reliant on public programs such as social assistance (welfare anddisability), employment insurance or worker’s compensation (27-29). Although these policies varyby province and territory, households reliant on social assistance consistently have the highestprevalence of food insecurity of any sociodemographic group with 7 in 10 of these households inCanada reporting some level of food insecurity in 2012 (1). This is in part due to the low levels ofincome support provided by these programs.10
When observed in a multivariable model adjusting for household income, jurisdiction ofresidence, education, and household composition; vulnerability amongst households reliant onsocial assistance remains. Beyond relatively low income benefit payments provided by socialassistance programs, recipients face strict limits on assets and earnings, preventing thesehouseholds from accruing a financial buffer to weather income shocks. Furthermore, householdsreliant on social assistance may have other characteristics unaccounted for in multivariableanalysis in the literature such as lower levels of family/community support and physical/mentaldisabilities.In contrast, households reliant on senior’s incomes (including pensions, dividends andinterest) are at lower odds of experiencing food insecurity, likely in part due to economic protectionprovided by public programs such as Old Age Security and the Guaranteed Income Supplementprograms (27) (see Section 2.2.3. Public Policy and Food Insecurity).Province/TerritoryIn addition to economic and socio-demographic variation between provinces andterritories, residency by jurisdiction is associated with differences in the adjusted odds ofexperiencing food insecurity (Table 2.2) (27, 29). This is likely due to variation in economicpolicies impacting vulnerable populations such as differences in minimum wage, child benefits,childcare policies and taxation. Cost of living also differs by jurisdiction such as food costs andheating costs – both impacting the economic circumstances that determine food insecurity risk (27,33).11
Table 2.2. Relative adjusted* odds of experiencing food insecurity by severity, compared toOntario in 2011-2012 (21)NLPENSNBQCMBSKABBCYKNTNUMarginal FoodInsecurity– –– – ––Moderate FoodInsecurity– –– –– Severe FoodInsecurity – – – –– - increased odds; decreased odds; – no difference;*Adjusted for household income, main source of household income, highest education in household,household structure, housing tenure, Indigeneity, immigration status and urban residence.Adapted from Tarasuk et al. 2019. BMC Pub Health.Household StructureMultiple studies have observed differences in household structure as being associated withthe probability of food insecurity in Canada when controlling for confounding factors. A studyusing the HFSSM with CCHS data from 2011-2012 demonstrated couples with no children hav
Table 5.7 Weighted prevalence of poor health and well-being amongst pregnant food-insecure women compared to food-secure women, CCHS 2005-2014 (n 4,754) Table 5.8 Adjusted odds of poor health and well-being amongst pregnant food-insecure women compared to food-secure women, CCHS 2005-2014