Transcription
Growing GreaterPhiladelphia:Regional and CountySubsector Analysis
IntroductionGrowing Greater Philadelphia, the region’sadopted comprehensive economic developmentstrategy (CEDS), is a framework for economicgrowth identifying the economic strengths,employment trends, and future economicopportunities in the Greater Philadelphia region.The subsector analysis highlights the top 10most competitive industries at the regional andcounty level, including average weekly wages,total employment change from 2010 to 2017,and which subsectors are regionally significantbased on employment and Location Quotient(LQ). Included at the regional level are theaverage weekly wages in the region’s top 10competitive subsectors compared to the nationallevel. An equity analysis is provided, whichanalyzes the ethnicity of the workforce bysubsector.2
Data Sources and DefinitionsCounty Business Patterns (CBP), U.S. Census: CBP is a series of annually released economic data.Quarterly Census of Employment and Wages (QCEW), U.S. Bureau of Labor Statistics (BLS): QCEW is wageand employment data reported by employers.Current Population Survey (CPS), U.S. Census: The CPS provides monthly labor force statistics.National Establishment Time-Series (NETS): NETS provides longitudinal data on businesses and employment.Location Quotient (LQ): LQ is an industry’s share of overall employment in one geography relative to the industry’s share ofoverall employment in another geography. An LQ higher than 1.0 means that the subsector produces more than is demanded bythe local economy, meaning it exports the excess goods and services. An LQ of 1.25 or higher means that the subsector iscompetitive in the county or region.North American Industry Classification System (NAICS): NAICS is the classification system for industries at multiplelevels. It is used in CBP, QCEW, and CPS data.3
2.5140%million regional employeesof jobs in six largest subsectors2.27 1,193.21average weekly wage for all subsectorshighest region LQ4
Regional Subsector Analysis5
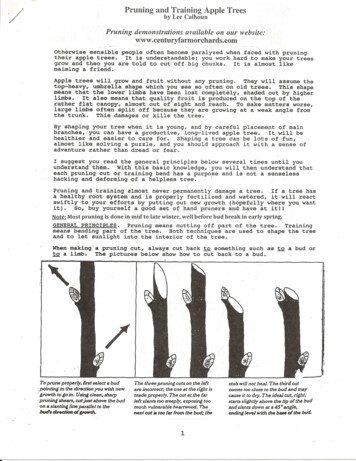
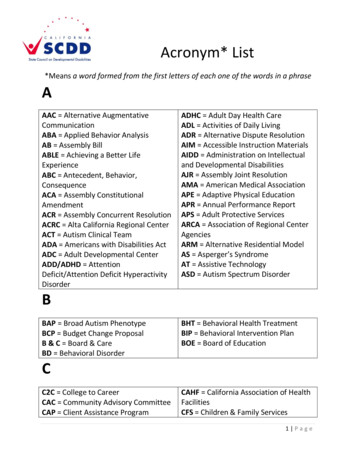
Top 10 Subsectors by Total EmploymentFood/ Beverage StoresManagement of Companies/EnterprisesSocial AssistanceNursing/Residential Care FacilitiesHospitalsAdministrative/Support ServicesAmbulatory Health Care ServicesEducational ServicesFood Services/Drinking PlacesProfessional/Scientific/Technical 5,000200,000Total EmploymentUsing employment data at the 3-digit North American Industry Classification System (NAICS) level, the region’s top 10 subsectorsare highlighted in the above table. These ten subsectors (of the 86 total subsectors in Greater Philadelphia) employ 1.35 millionemployees, which accounts for more than half (53.7 percent) of total employment in the region. The largest single subsectorProfessional/Scientific/Technical Services accounts for 201,510 employees, approximately eight percent of the region’semployment.Source: County Business Patterns (2017)6
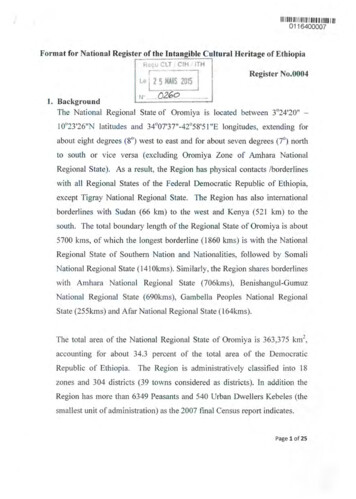
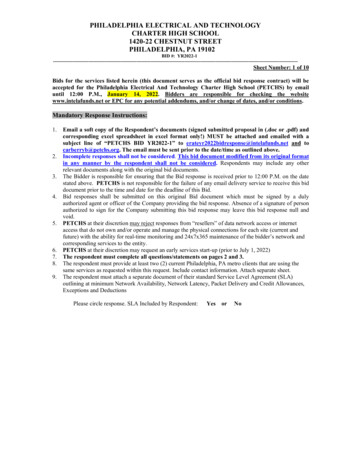
Top 10 Subsectors by Location Quotient (LQ)Social AssistancePersonal/Laundry ServicesNursing/Residential Care FacilitiesMuseums/Historical SitesHospitalsTransit/Ground Passenger TransportationPerforming Arts/Spectator SportsEducational ServicesPetroleum/Coal Products ManufacturingSecurities/Commodity Contracts/Other0.000.501.001.502.00Location QuotientRegion LQ is a subsector’s share of total employment in a region relative to its share of total employment in the United States. An LQabove 1.25 may signal a particular subsector’s significance to a region. There are four subsectors with LQs above 2.0, indicating strongregional competitiveness in these areas. The Educational Services subsector has the highest employment. The most competitivesubsector by LQ is the Securities/Commodity Contracts/Other subsector with an LQ of 2.27, which accounts for 1.63 percent of theregion’s employment.Source: County Business Patterns (2017)72.50
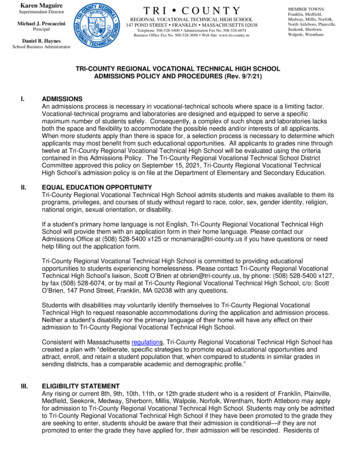
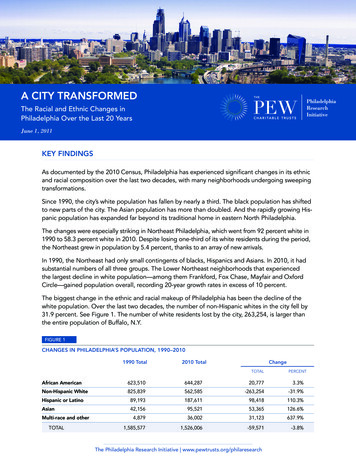
Subsector Change in Employment for Greater Philadelphia therLocation m/Coal ProductsManufacturing2.00Educational Services1.801.60Transit/Ground PassengerTransportationHospitalsNursing/Residenti 1.40Museums/Historical SitesPersonal/Laundry Services1.201.00-10,000Social l Employment ChangeThis bubble chart shows the LQ and change in total employment for the region’s top 10 subsectors. Additionally, the size of the bubbles represents thetotal employment in the region for each subsector. Since 2010, the Educational Services subsector gained the most jobs with 19,208, followed byHospitals and Social Assistance with gains of 15,112 and 14,419, respectively. The Petroleum/Coal Products Manufacturing and PerformingArts/Spectator Sports subsectors have two of the highest regional LQs but relatively low employment in comparison.Source: County Business Patterns (2010, 2017)8
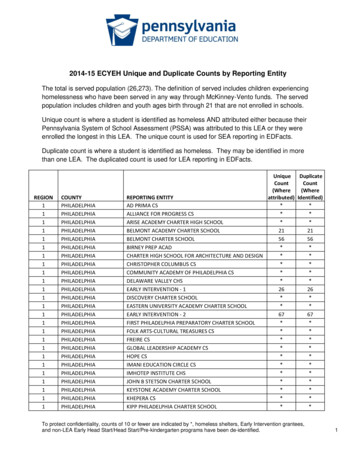
Shift-Share AnalysisNational GrowthIndustry MixRegion ShareChange25000200001500010000Total acturingEducational ServicesPerformingArts/Spectator lsMuseums/HistoricalSitesNursing/ResidentialCare FacilitiesPersonal/LaundryServicesSocial AssistanceThis chart is a shift-share analysis of employment change in the region for its top 10 subsectors. National growth represents the growth of totalemployment in the US during the period, while Industry Mix is the growth in each subsector over this time. Change represents the change in totalemployment in the subsector in the region during the period. Therefore, regional competitiveness is the share of change in the subsector that is notaccounted for from national growth or industry mix. Regional competitiveness contributed substantially to the job growth (dark orange bars) in thePerforming Arts/Spectator Sports and Hospitals subsectors, accounting for 11,200 and 18,806 jobs, respectively, while the remaining subsectors havelittle or no regional competitiveness. Regional competitiveness had a negative or minimal impact on job growth for the remaining subsectors from2010 to 2017.Source: County Business Patterns (2010, 2017)9
Wages and EquityThis section analyzes wages and employee representation by gender,race, and ethnicity, and wages within the top 10 most competitivesubsectors in the region. This analysis highlights when a particulargender, race, or ethnic group is more than 5 percent higher than theirrepresentation in the overall workforce in a particular subsector. This isreferred to as overrepresented. For example, women account for 47percent of the U.S. workforce but 50.1 percent of total employment inthe Museums/Historical Sites subsector. Therefore, their representationin the Museums/Historical Sites subsector is 6.5 percent higher thantheir share of the U.S. workforce, meaning women are overrepresentedin this subsector.The region’s average weekly wage was calculated using the averagewage in each county and then weighing it based on the county’s totalemployment. This average weekly wage for the region was used forcomparisons with the region’s top 10 subsectors and subsectors thatwere overrepresented by a particular race, ethnicity, or gender. Theaverage weekly wages by subsector are not weighted. At the countylevel, wage data for subsectors from QCEW is broken down by sector:local government, state government, federal government, or privatesector. Since some of the data is suppressed by sector (CBP andQCEW suppress data for confidentiality/publication purposes) and thereis no range provided, it is not possible to consistently weigh the data.Therefore, equal weight by sector to average the wages is assumed.10
Wage Context: Is Greater Philadelphia Livable?The weighted average weekly wage for the entireNAICS Subsectorregion is 1,193.21, which is 9.3 percent higherthan the U.S. average of 1,092.00. This equatesto 29.83 per hour for a 40-hour workweek.Although this is much higher than the minimumwage ( 7.25 in Pennsylvania; 10.00 in NewSubsector: RegionalWeighted Wage% Difference:Region’s WeightedAverage WageSecurities/Commodity Contracts/Other 3,234.66171.1%Petroleum/Coal Products Manufacturing 1,522.2727.6%Educational Services 1,326.5711.2%Performing Arts/Spectator Sports 2,446.84105.1% 589.60- 50.6%Jersey) and federal poverty level, household sizeand composition are also used to determinewhether this average weekly wage is livable.Transit/Ground Passenger TransportationAccording to the Massachusetts Institute ofTechnology Living Calculator, the livabilitychanges based on the number of adults andHospitals 1,369.2214.8%Museums/Historical Sites 856.80- 28.2%Nursing/Residential Care Facilities 761.15- 36.2%Personal/Laundry Services 509.42- 57.3%Social Assistance 603.76- 49.4%children in the household.Single (no children): 25,898 per year/ 12.45 per hour2 adults, 2 children (1 adult works): 55,185/ 26.53 per hour2 adults, 2 children (2 adult works): 70,516/ 16.95 per hourSource: 2019 Bureau of Labor Statistics (BLS) Current Population Survey (CPS)11
Competitive Subsectors Based on WagesU.S. Average Weekly WageDVRPC Average Weekly WageSocial AssistancePersonal/Laundry ServicesNursing/Residential Care FacilitiesMuseums/Historical SitesHospitalsTransit/Ground Passenger TransportationPerforming Arts/Spectator SportsEducational ServicesPetroleum/Coal Products ManufacturingSecurities/Commodity Contracts/Other 0 500 1,000 1,500 2,000 2,500 3,000 3,500 4,000 4,500The highest average wage in the region is in the Securities/Commodity Contracts/Other subsector with 3,234.66, followed by the PerformingArts/Spectator Sports and Petroleum/Coal Products Manufacturing subsectors. Although the Securities/Commodity Contracts/Other and Petroleum/CoalProducts Manufacturing subsectors have high average weekly wages, they are 27.4 and 35.0 percent lower, respectively, than the U.S. average,whereas the average weekly wage in the Performing Arts/Spectator Sports subsector is 33.4 percent higher than the U.S. average.Source: 2019 Bureau of Labor Statistics (BLS) Current Population Survey (CPS)12
Subsector Breakdown by Gender, Race, and EthnicitySecurities/Commodity Contracts/Other subsector has an average weekly wage of 3,234.66, which is 171.1 percent higher than the region’s overallaverage weekly wage. The subsector’s average weekly wage for the region is 27.4 percent lower than the subsector’s average weekly wage of 4,457.55in the United States overall. Asian workers comprise 9.3 percent of the workforce in this subsector nationally. Since Asian workers represent 6.5 percent ofthe total workforce in the United States (and 6.3 percent of the workforce regionally), this means that they are overrepresented in this subsector by 43.1percent.Wages & EquityPetroleum/Coal Products Manufacturing subsector has an average weekly wage of 1,522.27, which is 27.6 percent higher than the region’s overallaverage weekly wage. The subsector’s average weekly wage for the region is 35.0 percent lower than the subsector’s average weekly wage of 2,342.00in the United States overall. Hispanic or Latino workers comprise 20.7 percent of the workforce in this subsector nationally. Since Hispanic or Latinoworkers represent 17.6 percent of the total workforce in the United States (and 8.5 percent of the workforce regionally), this means that they areoverrepresented in this subsector by 17.6 percent.Educational Services subsector has an average weekly wage of 1,326.57, which is 11.2 percent higher than the region’s overall average weekly wage.The subsector’s average weekly wage for the region is also 31.5 percent higher than the average weekly wage for this subsector of 1,008.77 for thissubsector in the United States overall. Women workers comprise 69.6 percent of the workforce in this subsector nationally. Since women workersrepresent 47.0 percent of the total workforce in the United States (and 48.8 percent of the workforce regionally), this means that they are overrepresentedin this subsector by 48.1 percent.Performing Arts/Spectator Sports subsector has an average weekly wage of 2,446.84, which is 105.1 percent higher than the region’s overall averageweekly wage. The subsector’s average weekly wage for the region is also 33.4 percent higher than the subsector’s average weekly wage of 1,834.68 inthe United States overall. White workers comprise 83.5 percent of the workforce in this subsector nationally. Since White workers represent 77.7 percentof the total workforce in the United States (and 69.6 percent of the workforce regionally), this means that they are overrepresented in this subsector by 7.5percent.Transit/Ground Passenger Transportation subsector has an average weekly wage of 589.60, which is 50.6 percent lower than the region’s overallaverage weekly wage. The subsector’s average weekly wage for the region is also 39.0 percent lower than the subsector’s average weekly wage of 967.15 in the United States overall. Black or African American workers comprise 31.4 percent of the workforce in this subsector nationally. Since Black orAfrican American workers represent 12.3 percent of the total workforce in the United States (and 18.9 percent of the workforce regionally), this means thatthey are overrepresented in this subsector by 155.3 percent.13
Subsector Breakdown by Gender, Race, and EthnicityHospitals subsector has an average weekly wage of 1,369.22, which is 14.8 percent higher than the region’s overall average weekly wage. Thesubsector’s average weekly wage for the region is also 6.1 percent higher than the subsector’s average weekly wage of 1,290.75 in the United Statesoverall. Women workers comprise 74.9 percent of the workforce in this subsector nationally. Since women workers represent 47.0 percent of the totalworkforce in the United Status (and 48.8 percent of the workforce regionally), this means that they are overrepresented in this subsector by 59.4 percent.Museums/Historical Sites subsector has an average weekly wage of 856.80, which is 28.2 percent lower than the region’s overall average weeklywage. However, the subsector’s average weekly wage for the region is 14.5 percent higher than the subsector’s average weekly wage of 748.34 in theUnited States overall. White workers comprise 82.9 percent of the workforce in this subsector nationally. Since White workers represent 77.7 percent ofthe total workforce in the United States (and 69.6 percent of the workforce regionally), this means that they are overrepresented in this subsector by 6.7percent.Nursing/Residential Care Facilities subsector has an average weekly wage of 761.15, which is 36.2 percent lower than the region’s overall averageweekly wage. However, the subsector’s average weekly wage for the region is 15.8 percent higher than the subsector’s average weekly wage of 657.54in the United States overall. Black or African American workers comprise 26.2 percent of the workforce in this subsector nationally. Since Black orAfrican American workers represent 12.3 percent of the total workforce in the United States (and 18.9 percent of the workforce regionally), this meansthat they are overrepresented in the subsector by 113.0 percent.Personal/Laundry Services subsector has an average weekly wage of 509.42, which is 57.3 percent lower than the region’s overall average weeklywage. The subsector’s average weekly wage for the region is also 9.4 percent lower than the subsector’s average weekly wage of 562.40 in the UnitedStates overall. Asian workers comprise 16.6 percent of the workforce in this subsector nationally. Since Asian workers represent 6.5 percent of the totalworkforce in the United States (and 6.3 percent of the workforce regionally), this means that they are overrepresented in this subsector by 155.4 percent.Social Assistance subsector has an average weekly wage of 603.76, which is 49.4 percent lower than the region’s overall average weekly wage.However, the subsector’s average weekly wage in the region is 18.7 percent higher than the subsector’s average weekly wage of 508.64 in the UnitedStates overall. Women workers comprise 83.8 percent of the workforce in this subsector nationally. Since women workers represent 47.0 percent of thetotal workforce in the United States (and 48.8 percent of the workforce regionally), this means that they are overrepresented in this subsector by 78.3percent.14
County Subsector Analysis15Photo: Camden City, New Jersey
Burlington CountyThe bubble chart on the next slide illustrates employment changeand the county LQ between 2010 and 2017 for the top 10subsectors in Burlington County. These subsectors represent19.7 percent of the total employment in the county. More thanhalf of this employment comes from CreditIntermediation/Related Activities (10,171 employees) andMerchant Wholesalers/Durable Goods (8,585 employees)subsectors, which also have the highest county LQs. TheComputer/Electronic Product Manufacturing subsector has thehighest county LQ (4.07; region LQ: 1.06) but lost over 2,800jobs. The Merchant Wholesalers/Durable Goods subsector hasthe lowest county LQ (1.73; region LQ: 1.01) but gained over1,300 jobs.Five of the top 10 county subsectors pay higher wages thancompared to the United States. The CreditIntermediation/Related Activities has the highest average wageat nearly 2,500 per week, which is 60.2 percent higher than theU.S. average. The Rental/Leasing Services and MotionPicture/Sound Recording Industries subsectors also have highaverage wages, as they are 95.7 and 99.3 percent higher thanthe U.S. average, respectively. The Gasoline Stations, WoodProduct Manufacturing, and Warehousing/Storage subsectoremployees earn the same wage as compared to the U.S. total.16
Burlington County: Employment Change (2010–17) and County LQ5.004.00Rental/Leasing ServicesLocation QuotientComputer/Electronic ProductManufacturingCredit Intermediation/RelatedActivitiesWood Product Manufacturing3.00Motion Picture/SoundRecording IndustriesTruck facturingGasoline StationsMerchantWholesalers/Durable 000Total Employment ChangeSource: County Business Patterns (2010, 2017)17
Camden CountyThe bubble chart on the next page illustrates total employmentand the county LQ for the top 10 subsectors in CamdenCounty from 2010 to 2017. Employment is concentrated inCamden County’s three largest subsectors:Couriers/Messengers (2,159 employees), Transit/GroundPassenger Transportation (2,099 employees), and FoodManufacturing (3,194 employees) account for 75 percent of theemployment in these top subsectors. The Water Transportationsubsector has a county LQ of 8.93 (region LQ .98) and lostunder 100 jobs between 2010 to 2017. The FoodManufacturing subsector has a county LQ of 1.96 (region LQ.77) but gained over 1,000 jobs in the same time period.Five of the top 10 county subsectors pay higher weekly wagesthan compared to the United States. The Textile Product Millssubsector has the highest average weekly wage at nearly 1,250 per week, which is 55 percent higher than the U.S.average of 807. The Food Manufacturing andFurniture/Home Furnishings Stores subsectors also have highaverage weekly wages, as they are 31 and 27.9 percent higherthan the U.S. average, respectively. The Transit/GroundPassenger Transportation subsector employees earn a weeklyaverage wage of 560 per week, which is 38 percent less thanthe U.S. average of 904.18
Camden County: Employment Change (2010–17) and County LQ10.00Water Transportation8.00Location Quotient6.004.00Beverage/Tobacco ProductManufacturing2.00Textile Product MillsCouriers/MessengersPrimary Metal ManufacturingFurniture/Home FurnishingsStoresFunds/Trusts/Other FinancialVehiclesTransit/Ground PassengerTransportation0.00-2.00-400Food ManufacturingWood Product Manufacturing-20002004006008001,0001,200Total Employment ChangeSource: County Business Patterns (2010, 2017)19
Gloucester CountyThe bubble chart on the next page highlights total employmentchange and county LQ for the top 10 subsectors in GloucesterCounty from 2010-2017. These subsectors account for 19.7percent of the total employment. The four largest subsectorsaccount for 80 percent of the employees: Specialty TradeContractors, General Merchandise Stores, FoodManufacturing, and Warehousing/Storage. The largestsubsector, Specialty Trade Contractors, accounts for 27.6percent of the total employment in the top 10 subsectors. ThePetroleum/Coal Products Manufacturing subsector iscompetitive at the county and regional levels, with a county LQof 5.24 and a regional LQ of 2.24. The Food Manufacturingsubsector has a county LQ of 4.09 (region LQ .77) and gainedover 2,000 jobs between 2010 and 2017.Five of the subsectors in Gloucester County pay higher weeklyaverage wages than compared to the U.S. average. TheRental/Leasing Services subsector pays an average weeklywage of 1,519, which is 55 percent higher than the U.S.weekly average wage of 678. The Specialty TradeContractors subsector pays an average weekly wage of 1,277, which is 20 percent higher than the U.S. averageweekly wage.20
Gloucester County: Employment Change (2010–17) and County LQ6.00Petroleum and Coal ProductsManufacturingWarehousing and Storage5.00Pipeline TransportationLocation Quotient4.00Nonmetallic Mineral ProductManufacturingFood Manufacturing3.00Rental and Leasing ServicesGeneral Merchandise Stores2.00Plastics and Rubber ProductsManufacturingGasoline StationsSpecialty Trade 5003,000Total Employment ChangeSource: County Business Patterns (2010, 2017)21
Mercer CountyThe bubble chart on the next page highlights the totalemployment change and county LQ from 2010 to 2017 for thetop 10 subsectors in Mercer County. These subsectors accountfor 38.9 percent of the county’s total employment. TheEducational Services (22,914 employees) andProfessional/Scientific/Technical Services (22,014 employees)subsectors combined account for 58.8 percent of the totalemployment in Mercer County. Other competitive subsectorsinclude Educational Services with a county LQ of 1.82 (regionLQ 2.20), Nonstore Retailers with a county LQ of 2.99 (region LQ1.31) and Merchant Wholesalers/Nondurable Goods with acounty LQ of 2.34 (region LQ 1.24).Mercer County average weekly wages for the top 10 subsectorsis similar to the average wages compared to the United States.Only two subsectors have higher weekly average wages:Nonstore Retailers (county 954; United States 822) andMachinery Manufacturing (county 1,386; United States 1,303).The highest average weekly wages in the county fall within theUtilities subsector ( 1,728), which is still 10 percent below theU.S. weekly average wage in this subsector. Although theEducational Services subsector makes up the largestemployment subsector in the county, the average weekly wageof 472 is 61.2 percent lower than the U.S. average weeklywage ( 1,216).22
Mercer County: Employment Change (2010–17) and County LQ3.50Nonstore cation Quotient2.50Broadcasting (exceptInternet)Machinery Manufacturing2.00Educational ServicesPublishing Industries cal ServicesUtilities1.00Credit 1,00001,000Total Employment Change232,0003,0004,0005,0006,000Source: County Business Patterns (2010, 2017)
Bucks CountyThe bubble chart on the next page highlights the employmentchange and county LQ from 2010 to 2017 for the top 10 subsectorsin Bucks County. Although the Mining (county LQ 4.39; region LQ.20) and Textile Mills (county LQ 2.99; region LQ .53) subsectorsare the most competitive, they have low employment (252 and 212employees, respectively). The Chemical Manufacturing subsector isthe largest (county LQ 2.54; region LQ 1.22) with nearly 4,500employees and has remained relatively steady between 2010 and2017. The subsector is also competitive in the region with a regionalLQ of 1.22. Although the Fabricated Metal Product Manufacturingand Machinery Manufacturing subsectors have high county LQs(2.18 and 2.22, respectively), they only have regional LQs of .59and .61, respectively.Picture of BUCKSOnly three of the top 10 subsectors have higher average weeklywages compared to the United States: Textile Mills (county 1.038;United States 891), Plastic/Rubber Products, Manufacturing(county 1,134; United States 1,027) and Nonmetallic MineralProduct Manufacturing (county 1,175; United States 1,143). TheLessors of Nonfinancial Intangible Assets (includes establishmentsengaged in assigning rights to assets) subsector has the highestaverage weekly wage ( 1,512 per week), although it is 29.6 percentlower than the U.S. average ( 2,148). The remaining subsectors inthe county have similar average weekly wages compared to theUnited States for that particular industry.24
Bucks County: Employment Change (2010–17) and County LQ6.005.00MiningLocation Quotient4.00Wood Product ManufacturingChemical ManufacturingTextiles Mills3.00Paper ManufacturingPlastics/Rubber Products Manufacturing2.00Machinery ManufacturingNonmetallic Mineral Product ManufacturingLessors of Nonfinancial Tangible Assets1.000.00-600-400-2000200400600Total Employment ChangeSource: County Business Patterns (2010, 2017)25
Chester CountyThe bubble chart on the next page highlights the employment changefrom 2010 to 2017 and county LQ for the top 10 subsectors in ChesterCounty. Six of the 10 subsectors have less than 1,000 employees buthigh county LQs, suggesting that the high county LQs are driven bythe subsectors’ small share of the overall U.S. economy. TheSecurities/Commodity Contract/Other subsector has 17,252employees (county LQ 4.23), accounting for 58.5 percent of the totalemployment. The Support Activities for Agriculture/Forestry subsectorhas a county LQ of 7.24 (region LQ .83) but only 813 employees. Allthe top 10 subsectors identified in Chester County have county LQsabove 1.8, while the region LQs for the same subsectors are all below1.3.Picture of ChesterSeven of the top 10 subsectors in Chester County pay higher averageweekly wages as compared to the United States. The Lessors ofNonfinancial Intangible Assets (includes establishments engaged inassigning rights to assets) subsector has the highest average weeklywage ( 1,512 per week), although it is 29.6 percent lower than theU.S. average. The Nonstore Retailers subsector has an averageweekly wage ( 1,590, 48 percent higher as compared to the UnitedStates ( 833). The Beverage/Tobacco Product Manufacturingsubsector is the only top 10 subsector in Chester County that pays anaverage weekly wage below that of the United States: 597 and 980,respectively.26
Chester County: Employment Change (2010–17) & County ion Quotient2.00Data Processing/Hosting/RelatedServicesNonstore Retailers1.50Lessors of NonfinancialIntangible Assets1.00Primary Metal ManufacturingWholesale ElectronicMarkets/Agents/Brokers0.50Pipeline o ProductManufacturingSupport Activities 0Total Employment ChangeSource: County Business Patterns (2010, 2017)27
Delaware CountyThe bubble chart on the next page highlights the employment changefrom 2010 to 2017 and county LQ for the top 10 subsectors inDelaware County. The Nursing/Residential Care (county LQ 1.57;region LQ 1.38) and Insurance Carriers (county LQ 1.83; region LQ1.25) subsectors account for 57 percent of the total employment withinthe county. The Support Activities for Mining (county LQ 8.85; regionLQ .04) and Transportation Equipment Manufacturing (county LQ4.40; region LQ .47) subsectors have high county LQs, but a relativelylow number of employees (175 and 5,041, respectively) as comparedto the Nursing/Residential Care Facilities subsector with 12,587employees.Four of the top 10 subsectors pay higher average weekly wages ascompared to the United States: Transportation EquipmentManufacturing (county 2,000; United States 1,444), PaperManufacturing (county 1,913; United States 1,288), SupportActivities for Transportation (county 2,804; United States 1,642)and Publishing Industries (except Internet) (county 2,136; UnitedStates 1,850). The Support Activities for Transportation subsectorhas the highest average weekly wage in the region ( 2,804 perweek),which is 70.8 percent higher than the U.S. weekly wageaverage. Although the Nursing/Residential Care subsector has thelargest number of employees, it has an average weekly wage of 724,approximately 20 percent less than the average weekly wage for theUnited States ( 907).28
Delaware County: Employment Change (2010–17) and County LQ10.00SupportActivities forMining9.008.00Location Quotient7.006.00Transportation EquipmentManufacturing5.00Water Transportation4.003.00Publishing Industries (exceptInternet)Couriers and MessengersPetroleum and CoalProducts Insurance CarriersSupport Activities forTransportation2.00Paper Manufacturing1.000.00-5,000Nursing and Residential otal Employment ChangeSource: County Business Patterns (2010, 2017)29
Montgomery CountyThe bubble chart on the next page highlights the employmentchange from 2010 to 2017 and county LQ in the top 10 subsectorsin Montgomery County. These subsectors only account for 5.1percent of the total employment in the county. The four largestsubsectors have slightly more than 22,000 employees combined,representing 84.3 percent of total employment in the group:Heavy/Civil Engineering Construction (county LQ 2.32; region LQ.68),
subsector by LQ is the Securities/Commodity Contracts/Other subsector with an LQ of 2.27, which accounts for 1.63 percent of the region's employment. Top 10 Subsectors by Location Quotient (LQ) 0.00 0.50 1.00 1.50 2.00 2.50 Securities/Commodity Contracts/Other Petroleum/Coal Products Manufacturing Educational Services Performing Arts .
![Prekindergarten Head Start Application [Initial Screening]](/img/43/head-start-application.jpg)