Transcription
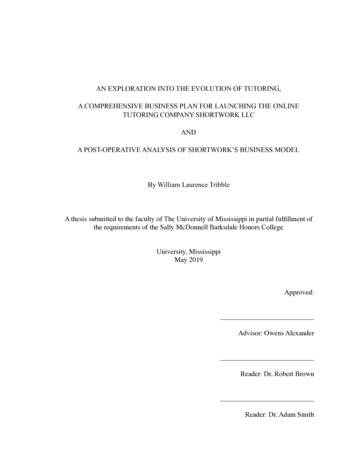
AN ABSTRACT OF THE THESIS OFKristy K. Pauls(name of student)inTitle:Psychology(major)for theMaster of Science Degree(degree)presented onJuly 20, 1994(date)A Correlational Study Among the Wechsler Adult IntelligenceScale - Revised, the Graduate Record Examination and Grade Point AverageAbstract approved: .1Lt. is. The purpose of the study was to examine the relationships among the GraduateRecord Examination (GRE) scores, Wechsler Adult Intelligence Scale-Revised(W AIS-R) scores, and undergraduate grade point average (UGPA) for the last 60hours. Thirty clinical psychology graduate students from a regional, midwesternuniversity were chosen. Their selection was based on the following criteria: 1) theymust have been enrolled in the clinical psychology program at Emporia StateUniversity, 2) they must have a GRE score on file upon entering Emporia StateUniversity, and 3) they must not have taken or have been enrolled in the course PY841 - Clinical Mental Tests II (The Wechsler scales).After receiving permission from the Human Subjects Committee and eachindividual via a consent form, each subject was administered the Wechsler AdultIntelligence Scale-Revised (W AIS-R). The WAIS-R tests were administered by fiveexaminers. Next, the subject's GRE scores and the last 60 hours of undergraduatestudy GPA were obtained. The WAIS-R administrator did not view the subject'sUGPA or GRE scores in order to decrease potential examiner bias.At the completion of the WAIS-R testing procedure, the total GPA, GRE and
WAIS-R results were utilized in a two step statistical process. First, Pearsonproduct-moment correlation coefficients were calculated. Correlation coefficientsranged from .22 to .94. All variables were significantly correlated at the .05 or .01level except UGPA with the GRE Quantitative section. Seven independent j-testswere done to yield information concerning gender differences. Statistical significancewas not found among the 30 subjects on the seven variables.
A CORRELATIONAL STUDY AMONGTHE WECHSLER ADULT INTELLIGENCE SCALE - REVISED,THE GRADUATE RECORD EXAMINATION,AND GRADE POINT AVERAGEA ThesisPresen ted tothe Division of Psychology and Special EducationEMPORIA STATE UNIVERSITYIn Partial Fulfillmentof the Requirements for the DegreeMaster of SciencebyKristy aulsJuly 1994
i I ".; ··11i\'/.'Approved for the Division of Psychologyand Special Educationaw ]J. Uewill-----.:.-JApproved for the Graduate Council
ACKNOWLEDGMENTSMy deepest gratitude goes to my Father in heaven. I thank Him for the wisdomand knowledge He granted me throughout my college career. I would also like tothank my husband, Eric, for the support and love he gave me through the tough timesin graduate school. Also, I would like to express my love and thankfulness to myparents, Herman and Patty, for the financial and emotional support they providedthroughout my long years in college. Last but not least, I would like to express myheartfelt gratitude to Professors Howard Carvajal, Tes Mehring and Cooper Holmes.I was truly blessed to have these three dedicated professors serve as thesis committeemembers.
TABLE OF CONTENTSPaeeABSTRACTiACKNOWLEDGMENTSiiiLIST OF TABLESviChapter1 INTRODUCTION1Previous Research . . . . . . . . . . . . . . . . . . . . . . . . . . . . . . . . . . . . 32 l Design . . . . . . . . . . . . . . . . . . . . . . . . . . . . . . . . . . . . 193 RESULTS20Descriptive Statistics. . . . . . . . . . . . . . . . . . . . . . . . . . . . . . . . . . 21Correlation Results. . . . . . . . . . . . . . . . . . . . . . . . . . . . . . . . . . . 2223Independent i-tests4 DISCUSSION25REFERENCES29APPENDIX A35APPENDIX B37Copyright Agreement. . . . . . . . . . . . . . . . . . . . . . . . . . . . . . . . . . . . . . 39IV
LIST OF TABLESPa eTable 1National Study: Examinees from October 1,1989 - September 30, 19925Table 2Descriptive Statistics for the GRE, WAIS-R and UGPATable 3Correlation Coefficients Among the Seven VariablesTable 421for the 30 Subjects22Seven Independent i-tests23v . --.55
1CHAPTER 1INTRODUCTIONThe importance of admissions criteria and their predictive validity for success ingraduate school is immeasurable. Two popular objective assessment tools used inselective admissions are the Graduate Record Examination (GRE) and undergraduategrade point average (GPA). In terms of GPA, it is a more common practice to usethe last 60 hours (UGPA). Much research has been conducted on both the GRE andUGPA to determine their usability in admissions criteria and predictive ability forsuccess in graduate school (Broadus & Elmore, 1983; Harvancik & Golsan, 1986;Monahan, 1991; Noble, 1986; Wesche, Courtney, & Hausken, 1984).The GRE and UGPA are not the only admissions and predictive toolstraditionally utilized in higher education. Additional measures frequently includeletters of recommendation and research experience (Purdy, Reinehr & Swartz, 1989).According to the results of a questionnaire study by Cashin and Landrum (1991),GRE scores were ranked as the most important admissions criteria. Yet, informationgathered via a different questionnaire study by Oltman and Hartnett (1985) reportedUGPA along with letters of recommendation as the most important admissionscriteria. Although opposing views are evident, little, if any, information existssuggesting that GRE scores and UGPA are inadequate admissions criteria.Traditional tools used for predicting academic success in graduate school includeGRE scores, undergraduate grade point average, grades within the students' major,samples of students' writing, letters of recommendation, and the number of honors
3(VIQ), Performance IQ (PIQ), and Full Scale IQ (FSIQ) (Kaufman, 1990; Wechsler,1981). Since the WISC-R and the WAIS-R are significantly and highly correlated andcontain most of the same subtests with similar, but not identical content, informationwould appear to be easily interchangeable.Given the documented reliability of the WISC-R correlations with grade pointaverages and the WAIS-R in comparison to the WISC-R, a relationship may existbetween the WAIS-R and college and university grade point average, morespecifically UGPA. Because there is a positive relationship between UGPA and GREscores, a relationship may also exist between the WAIS-R and GRE scores.Henceforth, the purpose of this study was to determine the relationships between theWAIS-R, GRE scores, and UGPA.Previous ResearchThe most popular objective test utilized as an admissions criteria for graduateprograms is the Graduate Record Examination (GRE) (Lannholm, 1967; 1971). TheGRE was initially developed in 1949 and continues to be "the best documentedinstrument of its type" (Cohn, 1985, p. 624). The first restructuring process was in1951. This revision included verbal (VGRE) and quantitative (QGRE) sections whichare presently used (Cooksey & Stenning, 1981). A second revision was completed in1977 by adding an experimental version of an analytic (AGRE) measure to the GREgeneral test (GRE guide, 1993; Wilson, 1985). In 1981, a revision updating theanalytical section, which is presently used, was completed (GRE guide, 1993; Wilson,1985).
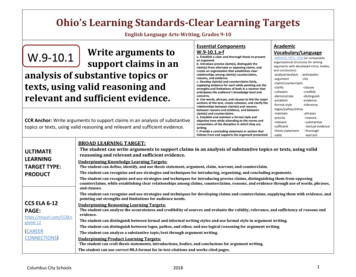
4The total test taking time is approximately three and one-half hours (Directory ofSelected National Testing Programs, 1987). The test has six equal sections of 30minute durations: two are verbal, two are quantitative, and two are analytical. Aminimum score of 200 and a maximum score of 800 are possible for each of the threetests (Directory of Selected National Testing Programs, 1987; GRE guide, 1993;Monahan, 1991). The national averages, standard deviations, and reliabilitycoefficients for all examinees taking the GRE general test reported by the EducationalTesting Service (1993) are shown in Table 1. More specifically, a study conductedwith master's level clinical psychology students by the Graduate Record ExaminationBoard (GRE guide, 1993) cited the verbal ability mean as 504 with a standarddeviation of 100, quantitative ability mean as 527 with a standard deviation of 112,and analytical ability mean as 555 with a standard deviation of 114.The GRE general test, which does not relate to any specific field of study, is ameasure of three abilities acquired over a long period of time (Cohn, 1985; Jaeger,1985; Monahan, 1991). The three abilities assessed are verbal ability, mathematicalability, and analytical and logical reasoning ability (Monahan, 1991). The abilitiesare measured by the verbal, quantitative, and analytical sections (Directory ofSelected National Testing Programs, 1987). The three sections are significantlycorrelated. The VGRE and QGRE correlate at .42; the VGRE and AGRE correlateat .65; and the QGRE and the AGRE correlate at .66. The three sections are alsointended to have and maintain at least .90 reliability for total test scores (GRE guide,1993). Specifically, the Graduate Record Examination Board (GRE guide, 1993)
5Table INational Study: Examinees from October 1. 1989 - September 30. 1992GRE General Test SectionsMeanStandard 534129.88
6reported a substantially high Kuder-Richardson formula (20) reliability for eachsection as follows: verbal ability .90; quantitative ability .92; and analyticalability .88.The verbal section consists of four item types: antonyms, analogies, sentencecompletion, and reading comprehension (GRE guide, 1993; Jaeger, 1985; Martinson,1990). The four item types address individualized information, such as, the ability toidentify words, to relate phrases, to correlate logically and stylistically within asentence, and to recognize specific information in passages (Monahan, 1991).The quantitative score is an indicator of the subject's knowledge of mathematics.It is composed of three item types: discrete quantitative questions, interpretivequestions, and quantitative comparison questions (Monahan, 1991). These threecomponents provide a balanced test of basic mathematical skills, the understanding ofelementary mathematical concepts, and the ability to reason quantitatively and solveproblems in a quantitative setting. Specifically, the test involves arithmetic, algebraand geometry (Jaeger, 1985; Monahan, 1991).The experimental analytical test was revised to include two item types. The itemtypes are analytical reasoning and logical reasoning (Monahan, 1991; Wilson, 1985).The analytical test is intended to assess the developed ability to reason with complexinformation (Duran, Powers & Swinton, 1987). It is used in the administration of theGRE as a test of cognitive skills that may be important to graduate study. Althoughthe AGRE is administered, Duran, et al. (1987) reported the subtest is not used inadmissions criteria or other areas, because there are few well-developed models or
7theories to guide the measurement of analytical ability.Although each section measures a specific ability, the GRE general test as awhole has few specific functions. Over the past 40 years, GRE scores havefrequently been used to fulfill departmentally approved admission criteria (Clark,1984; Cooksey & Stenning, 1981). Approximately one-third of colleges anduniversities either "require or recommend" scores in order to apply to their graduateprograms (Cooksey & Stenning, 1981; Jaeger, 1985; Lannholm, 1971; Oltman &Hartnett, 1985). According to Martinson (1990), the GRE is "to provide a standardmeasure that will permit admission decisions to be based, at least in part, on an'objective' comparison of all candidates - no matter what their college or background"(p.3).Not only are GRE scores used as objective criteria for the admissions process,but they are also used as tools to predict graduate success. As a predictive tool, themain goal of the GRE is to predict graduate grade point average. The GRE is alsoconsidered as another factor when offering assistantships, fellowships, or scholarships(Directory of Selected National Testing Programs, 1987; Oltman & Hartnett, 1985).Although GRE scores are considered in offering assistantships, fellowships, orscholarships, their primary function(s) remain(s) as admissions criteria and/orpredictors of success in graduate school.Many times, GRE scores are the only admissions criteria or predictor ofacademic success used. The GRE Board does not advise this type of solitary usage(Monahan, 1991). Conversely, the GRE Board advises departments to use the GRE
8scores by relating what the tests measure to the specific graduate department programs(GRE guide, 1993). In support of the GRE Board's request, many researchers(Cartwright & Kunze, 1974; Cooksey & Stenning, 1981; Lannholm, 1968; Monahan,1991; Oltman & Hartnett, 1985) reported GRE scores as good supplemental aids toundergraduate GPA, other admissions records, and departmental-specifiedqualifications for graduate school. Many also believe that based on conditions such asdegree sought and to what particular department the individual may apply, the GRE isa good predictor of graduate level work in education (Cartwright & Kunze, 1974;Furst & Roelfs, 1979; Humphrey, 1965). Although some researchers support the useof the GRE as a predictor of graduate level work, Clark (1984) and Harvancik andGolsan (1986) reported being skeptical of the GRE being a valid admittance tool.Also, Wesche, Courtney, and Hausken (1984) believe even though GRE scores aregood predictors of success, graduate schools admit or reject students on a very limitedknowledge of the student's past performance and inappropriately judge potentialgraduate performance on past grades, standardized tests and letters ofrecommendation.Another traditional tool used as an admissions criteria is undergraduate gradepoint average (Wesche et al., 1984). In the present investigation, UGPA will bedefined as the grade point average for the last 60 hours of undergraduate study.According to a study by Purdy, Reinehr, and Swartz (1989), ideal graduate schooladmissions criteria include a combined GRE score, total undergraduate grade pointaverage, with particular emphasis on the last 60 hours of undergraduate grade point
9average, letters of recommendation, and research experience. In support of this view,Cartwright and Kunze (1974) stated UGPA is a positive aid in the majority ofinstances in admissions selection.Undergraduate grade point average is also used as a predictor of academicsuccess along with GRE scores, samples of the student's writing, letters ofrecommendation, number of honors earned and grades within the student's major(Kluever & Green, 1992). Noble (1986) and Cotton (1986) believe UGPA is a goodpredictive tool. Undergraduate grade point average is an especially good predictorwhen combined with GRE scores (Dennis, 1979; Furst & Roelfs, 1979; Humphrey,1965; Jaeger, 1985). This point of view is supported by the researchers who havefound GRE scores and UGPA to be significantly, but weakly correlated (Harvancik &Golsan, 1986; Monahan, 1991; Noble, 1986; Wesche et al., 1984). In a few studies,UGPA was found to be a better predictor or a more important predictor than GREscores (Monahan, 1991; Noble, 1986; Oltman & Hartnett, 1985). Other researchfound GRE scores to be more important than UGPA (Cashin & Landrum, 1991;Jaeger, 1985). In opposition to the use of UGPA, Monahan (1991) concluded in hisstudy that UGPA is not a good predictor in admissions criteria. Although views suchas those expressed by Monahan exist, UGPA and GRE scores are consistently utilizedin this capacity.Undergraduate grade point average is not only used in correlational studies withGRE scores, but also with the Wechsler Intelligence Scales. The children's WechslerIntelligence Scales along with other intelligence tests are related to achievement and
10were developed to predict school success (Rodriguez & Prewitt-Diaz, 1990).Specifically, the Wechsler Intelligence Scale for Children-Revised (WISC-R) FullScale IQs and grade point averages for children were found to correlate at .32 forblack students and .42 for white students in a study conducted by Poteat, Wuenschand Gregg (1988). Also, in a study by Ruiz (cited in Rodriguez & Prewitt-Diaz,1990), the Information subtest within the WISC-R was highly predictive of gradepoint average in children.Another study by Sandoval, Sassenrath and Penaloza (1988) (cited in Kaufman,1990) found significant correlations between the WISC-R and the Wechsler AdultIntelligence Scale-Revised (WAIS-R). The researchers documented correlationsbetween the WISC-R and the WAIS-R as .96, .82, and .96 respectively on the VerbalIQ (VIQ), Performance IQ (PIQ), and Full Scale IQ (FSIQ) for individuals withlearning disabilities. This pattern is a mirror of the correlation found by Wechsler fornormal adolescents (Wechsler, 1981). These values strongly support the WAIS-R'svalidity for educational purposes.Other reasons the WAIS-R may be usable in the educational field have beendocumented by Kaufman (1990) and Wechsler (1981). These researchers have foundthat for 16 year olds, the Wechsler Intelligence Scale for Children-Revised (WISC-R)and the WAIS-R Verbal, Performance and Full Scale IQs are correlated at .89, .76and .88 respectively. In addition, the mean IQs were virtually identical, and theymeasure similar constructs across their respective ages. In a longitudinal,correlational study by Zimmerman, Covin and Woo-Sam (1986) (cited in Kaufman,
111990), the WISC-R and WAIS-R, for 16 year old referrals, were administered threeto four years apart and yielded the following data: a) special education, referrals(whites) VIQ .84, PIQreferrals, (blacks) VIQ .85, and FSIQ .57,PIQ .75, .88, and 2); special education,and FSIQ .70.Since the WISC-R andthe WAIS-R are significantly and highly correlated at .97 and contain most of thesame subtests with similar, but not identical content, information would appear to beeasily interchangeable.Even though these correlations are obviously significant, Kaufman (1990) stated"the WAIS-R exceeds the WISC-R in its reliability of difference coefficients" (p.115). A number of studies at the college level, cited in Frank (1983), have relatedthe Wechsler IQ to grade point average. Researchers, cited in Frank (1983)(Anderson, 1942; Conry & Plant, 1965; Merrit & Heathers, 1953; Plant & Lynd,1959; Wall et al., 1962; Sartain, 1946; Zung & Gianturco, 1968), found statisticallysignificant correlations ranging from .30 to .60 when studies were performed betweenthe Verbal IQ (VIQ) scale, derived from the Wechsler Adult Intelligence Scale(WAIS), and GPA. Kaufman (1990) stated "the use of the WAIS-R for predictingcollege achievement is likely to produce coefficients lower than the values in the.6Os" (p. 19). Matarazzo (1985) reported a coefficient of .44 between WAIS FullScale IQ and GPA for college students. Because Verbal IQ has been shown to relatestrongly to grade point average and the WAIS is significantly correlated with gradepoint average, then it may be assumed the WAIS-R may also be an adequate predictorof grade point average (Frank, 1983).
12The Wechsler Adult Intelligence Scale-Revised (WAIS-R) was developed as abasic intelligence test which may be used as a diagnostic tool and research instrumentin various settings (Wechsler, 1981). "Although the [test] inevitably evaluate[s] asubject's cognitive abilities and may be used to appraise a subject's educational,vocational, or other competencies, these are not [its] primary intent" (Wechsler, 1981,p. 7).The initial intelligence test developed by David Wechsler in 1939 was theWechsler-Bellevue Intelligence Scale (Matarazzo, 1985). The Wechsler-Bellevue wasrevised in 1955 and renamed the Wechsler Adult Intelligence Scale (WAIS)(Kaufman, 1985). The presently revised, updated and renormed Wechsler scale is theWechsler Adult Intelligence Scale-Revised (Matarazzo, 1985; Wechsler, 1981). Itwas published in 1981 by the Psychological Corporation (Kaufman, 1985).This newly revised psychometric device is specifically designed to measure majormental abilities. The established purpose of this "criterion of adult intelligence"(Kaufman, 1985) test was to establish and reflect the overall capacity for intelligentbehavior (p. 1703). Specifically, 11 tests, which are organized into 6 verbal and 5nonverbal (performance) subtests are used to measure mental abilities. Eachindividual subtest is arranged in an ascending order of difficulty. The 11 subtests areto be administered in a systematic order. The total testing time requiresapproximately 75 to 90 minutes. Each subject receives three scores: a Verbal IQscore (VIQ), a Performance IQ score (PIQ) and a Full Scale IQ score (FSIQ), as wellas individual subtest scores. The WAIS-R has ". . . the same average of 100 and
13standard deviation of 15 for every age group" (Wechsler, 1981, p. 9). The individualsubtests have a mean of 10 and a standard deviation of three (Wechsler, 1981).Standardization of the WAIS-R was a meticulous, four year (1976-1980) processto ensure representativeness of the entire population (Kaufman, 1985). "The totalsample . was carefully stratified on the variables of sex, race, geographic region,occupational group, educational attainment, and urban-rural residence" (Kaufman,1985, p. 1702). Nine age groups from 16 years, 0 months to 74 years, 11 monthswere designated with equal numbers of males and females representing each group(Wechsler, 1981).The Verbal IQ score (VIQ) derived from the six verbal subtests reflects"crystallized intelligence" (Kaufman, 1979, p. 28). The six subtests within the VIQare Information, Digit Span, Vocabulary, Arithmetic, Comprehension andSimilarities. Verbal IQ is specifically "left brain, semantic activity which isdependent on past learning, direct and deliberate training and education" (Moore,Weare, & Leonard, 1987, p. 65).The Performance IQ score (PIQ) represents "fluid intelligence" (Kaufman, 1979,p. 28). Specifically, PIQ is "right brain activity" involving ". problem solving oradaptation and flexibility when faced with unfamiliar stimuli and reflects incidentallearning" (Moore, et al., 1987, p. 65). The five subtests involved are PictureCompletion, Picture Arrangement, Block Design, Object Assembly, and Digit Symbol(Wechsler, 1981). The composite score derived from the WAIS-R is the Full ScaleIQ (FSIQ).
14In the academic setting of graduate school, time is of the essence. Decisionsneed to be made accurately and quickly. Therefore, the importance of excellentadmissions criteria and predictive validity for success in graduate school isimmeasurable. The two popular objective admission assessments, GRE scores andUGPA, are, at best, moderately successful predictors of success (Cohn, 1985). Clark(1984) stated "grades earned by graduate students are predicted only partially by thetraditional admissions criteria of test scores and undergraduate grades" (p. 30). Also,Cotton (1986) stated GRE scores and UGPA are overemphasized in the context ofadmissions criteria. Unless other career-oriented factors are considered in selection,the professions may soon find themselves with serious shortfalls of satisfied,competent individuals (Dennis, 1979). Therefore, if both GRE scores and UGPA aresuspect in the academic setting, having another tool in the area of admissions criteriaand predictive ability for success in graduate school may be useful.The WAIS-R may be just that tool. Since most standardized tests used asadmissions criteria and predictive tools have been criticized as not being fair,particularly to special populations, the WAIS-R, which is normed on a diversepopulation, may be a helpful tool in the areas of admissions criteria and predictingsuccess in graduate school (Kaczmarek & Franco, 1986). It is easily administeredand many individuals may have an Wechsler FSIQ on file. If there is not an IQ onfile, the WAIS-R can be speedily administered in 75 to 90 minutes, approximatelytwo hours faster than the administration of the GRE. If this study were to findsignificant correlations between the WAIS-R and GRE or UGPA, it may be that the
15WAIS-R is a possible admissions and/or predictive tool for graduate school success inaddition to the GRE and UGPA.Males and females have been known to yield vastly different scores on varioustests in the past. Therefore, these particular variables may yield significantdifferences between males and females involved in graduate school. Indeed, severalstudies have indicated significant gender differences concerning the GRE scores.Cooksey and Stenning (1981) discovered females score significantly higher on theVGRE and males score significantly higher on the QGRE. Kaczmarek and Franco(1986) supported the finding, that the QGRE score is significantly in favor of males.Additionally, Kaczmarek and Franco discovered a significant correlation betweenQGRE and undergraduate grade point average for women, but very low correlationswere found between the GRE scores and UGPA for men. Given the importance ofgender differences reported in previous research, this investigation, includedcomparative analyses of the scores obtained by male and female participants.In conclusion, there are many viewpoints concerning the proper use of GREscores and UGPA. Also, the use of the WAIS-R as an admissions criteria and/orpredictor of success in graduate school appears not to have been considered. Thepurpose of this study was to explore the relationships between WAIS-R scores andGRE scores and WAIS-R scores and the last 60 hours of undergraduate grade pointaverage (UGPA). The relationship between GRE scores and UGPA (last 60 hours)was also explored. The study investigated the use of WAIS-R scores, GRE scores,and UGPA as valid admissions criteria of clinical psychology students in graduate
16school in a regional, midwestern university. In addition, gender differences based onWAIS-R scores, GRE scores and UGPA were examined.
17CHAPTER 2METHODSubjectsThe sample consisted of 30 Caucasian (9 males, 21 females) clinical psychologygraduate students, currently attending a regional, midwestern university. Threecriteria were used in selecting subjects: 1) enrollment in the clinical psychologymasters degree program at Emporia State University, 2) notation of a GRE score onfile in the division office upon entering Emporia State University, and 3) having notyet enrolled in the course PY 841 - Clinical Mental Tests II (the Wechsler Scales).Participation was completely voluntary. An added incentive for participants was theopportunity to become familiar with the WAIS-R administration procedures for futureuse in their field of study. Because of the lack of ethnic diversity within theuniversity and the voluntary status, there was a lack of ethnic diversity within thesample.The names of the subjects were not listed to insure confidentiality. The subjectswere identified by code number only. To further ensure confidentiality, group scoresrather than individual scores were reported.VariablesThis study contained seven data score variables. From the GRE, each subjectreceived a verbal score (VGRE), a quantitative score (QGRE) and an analytical score(AGRE). From the WAIS-R, each subject received a Verbal (VIQ), Performance(PIQ), and Full Scale IQ (FSIQ) score. Finally, each subject had an undergraduate
18grade point average score representing the last 60 hours of undergraduate workcompleted.ProcedureThe WAIS-R was administered to each subject individually. Each subject wasgiven all 11 subtests. Standardized procedures were followed in the administration ofthe WAIS-R. All WAIS-R tests were given in designated testing rooms available inthe psychology building at the university. In order to minimize examiner bias, arandom selection process, matching the five WAIS-R administrators with the varioussubjects, was implemented. Each administrator was given the subject's name andphone number in order to set up a convenient time to administer the WAIS-R. Thefive administrators were second year graduate students trained in WAIS-Radministration. Each administrator was approved and supervised by the sameuniversity instructor who teaches the Wechsler course.The next step required the subjects to release their three Graduate RecordExamination scores, the VGRE, QGRE and AGRE, and their undergraduate gradepoint averages, specifically the last 60 hours (UGPA). To decrease potentialexaminer bias, the five administrators of the WAIS-R did not view the subject's GREscores or UGPA prior to the administration of the WAIS-R.Each participant signed a participation consent form prior to testing, agreeing totake the WAIS-R and to release his/her GRE scores and undergraduate grade pointaverage. The participation consent form was reviewed and accepted by the HumanSubjects Committee before any testing took place. Additionally, test scores were
19reported and explained to the subjects if requested.StatisticalDesi nThe study yielded seven scores for each subject: three scores for the GRE, threescores for the WAIS-R, and one for the undergraduate grade point average. Standarddeviations and means were computed for males, females, and the total sample. Thedata were analyzed by seven independent l-tests to determine statistically significantdifferences between males and females utilizing WAIS-R scores, GRE scores andundergraduate grade point average. Also, the Pearson product-moment correlationcoefficient (r) was used to assess the relationships between the three GRE scores andthe three WAIS-R scores, the three GRE scores and UGPA, and the three WAIS-Rscores and UGPA. They were analyzed at the .05 level of significance.
20CHAPTER 3RESULTSThe purpose of the study was to determine the relationships among the GraduateRecord Examination (GRE), the Wechsler Adult Intelligence Scale-Revised(W AIS-R), and the undergraduate grade point average, specifically the last 60 hoursof undergraduate work. The GRE yielded
The purpose of the study was to examine the relationships among the Graduate Record Examination (GRE) scores, Wechsler Adult Intelligence Scale-Revised (WAIS-R) . Clinical Mental Tests II (The Wechsler scales). . samples of students' writing, letters of recommendation, and the number of honors . 3 (VIQ), Performance IQ (PIQ), and Full Scale .