Transcription
Proceedings of the Thirtieth International Joint Conference on Artificial Intelligence (IJCAI-21)Long-term, Short-term and Sudden Event: Trading Volume Movement Predictionwith Graph-based Multi-view ModelingLiang Zhao 1 , Wei Li2 , Ruihan Bao 3 , Keiko Harimoto3 , Yunfang Wu2 and Xu Sun 1,21Center for Data Science, Peking University2MOE Key Lab of Computational Linguistics, School of EECS, Peking University3Mizuho Securities , rading volume movement prediction is the key ina variety of financial applications. Despite its importance, there is few research on this topic because of its requirement for comprehensive understanding of information from different sources. Forinstance, the relation between multiple stocks, recent transaction data and suddenly released eventsare all essential for understanding trading market. However, most of the previous methods onlytake the fluctuation information of the past fewweeks into consideration, thus yielding poor performance. To handle this issue, we propose a graphbased approach that can incorporate multi-view information, i.e., long-term stock trend, short-termfluctuation and sudden events information jointlyinto a temporal heterogeneous graph. Besides, ourmethod is equipped with deep canonical analysisto highlight the correlations between different perspectives of fluctuation for better prediction. Experiment results show that our method outperformsstrong baselines by a large margin. 11IntroductionTrading volume movement prediction aims to predict thevolume in a certain period of time based on stock marketinformation, which is crucial to a variety of financial applications, e.g., stock market anomaly detection, risk management and algorithmic trading [Brownlees et al., 2010;Libman et al., 2019]. More importantly, when investors tryto buy/sell large quantities of stocks, the order itself willinstantaneously drive the stock price to the undesirable direction (i.e., higher price for a buy order and lower pricefor a sell order) and thus the total cost for the executionwill be very expensive [Ye et al., 2014]. Instead, if we cansplit the large order into smaller pieces and execute thosesmaller orders according to the market volumes movement(e.g., execute more when the volume is high and less whenthe volume is low), this will reduce the price impact causedby the large order and thus minimize the total execution 1Equal Contribution.The code will be released at https://github.com/lancopku/CGM3764cost for the investor. As the results, predicting the volume trend is essential for the stock trading. However, volume movement prediction has been paid less attention compared with price movement prediction [Xu and Cohen, 2018;Li et al., 2020] in the AI field.Previous works on volume prediction focus on predictingthe volume based on short-term transaction data. Both classic machine learning models [Liu and Lai, 2017; Roman,2018] and deep learning based models [Libman et al., 2019]have been applied. However, even though more sophisticatedmodels like LSTM [Hochreiter and Schmidhuber, 1997] havebeen used to model the temporal sequence, almost all theprevious work considers the transaction sequence in isolation. Although being a valuable information resource for predicting volume movement, the randomness in the short-termtransaction data largely affects the prediction accuracy.Therefore, introducing and integrating more comprehensive information is crucial to making more accurate predictions. We observe that there exists long-term connectionbetween stocks both price-wise and volume-wise, which canbe served as the regulation and facilitation for short-term information. For example, Takeda, a Japanese pharmaceuticalcompany, has a strong positive relation with pharmaceuticalretail company Toho Holdings on long-range price trend. Another observation is that breaking news related to a companycan largely affect its trading volume. For the same stock, thenews “Japan’s Takeda agree 62 billion takeover of Shire.”largely increases its volume. As a result, systematical coordination of the long-term, short-term and sudden event information is the key for making accurate volume predictions.Conventional methods tend to ignore long-term information [Brownlees et al., 2010; Liu and Lai, 2017; Roman,2018; Libman et al., 2019], and experiments show that simply putting together information of different views cannot explicitly exploit the connection among them. In this paper, wepropose to jointly integrate long-term, short-term and sudden event information into a graph via Correlation-poweredGraph-based Multi-view (CGM) modeling method. The textual sudden information is appended to the end of the temporal sequence following short-term transaction data, whichforms a temporal heterogeneous graph. Specifically, we builda long-term relational graph through long range price and volume record information to model the relation among stockswith various types of edges. Then, we propose to encode
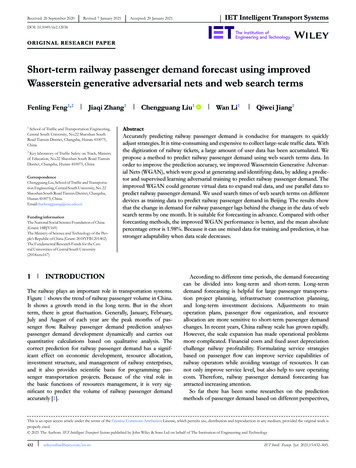
Proceedings of the Thirtieth International Joint Conference on Artificial Intelligence (IJCAI-21)Long-Term Stock RelationGraph BuildingShort-term Fluctuation ModelngPriceVolumeIntegration-graph.n day graphVolume-graphTakeda PharmaceuticalSudden Event FusionTime1 day beforeDCCADNNDNNJapan's Takedaagrees 62billion takeoverof Shire.DNNDNNToho Holdingstarget dayNewsEncoderFigure 1: An illustration of our proposed CGM. (1) The graph in the left most part is stock relation graph built based on long-term price andvolume data. Different colors of edges indicate different relation types. (Sec.2.3). Examples of Takeda Pharmaceutical and Toho Holdingswith long-term price trend are shown below, the color of the nodes are identical to the color of the price lines. (2) Price-graph and volumegraph are designed to process price and volume with long-term stock graph respectively. (Sec.2.4). (3) Sudden events are fused with theshort-term fluctuations by appending to the the end of the sequence (Sec.2.5). (4) Inter-view correlation enhancement with DCCA module(Sec.2.6). The red arrow in the node of integration-graph indicates the movement trend.sequential short-term transaction information together withsudden information, which combines short-term fluctuationswith sudden event information by treating them together as atemporal sequence. We further propose to adopt deep canonical correlation analysis (DCCA) [Andrew et al., 2013] tohighlight the correlation between multiple perspectives of thefluctuations.To test the effectiveness of our approach, we collect a volume prediction dataset of Reuters Financial News, containingfinancial news and market data from Reuters. This datasetis to predict opening volume stock movement based on theovernight financial news [Li et al., 2020]. We conduct a series of experiments and the results demonstrate that our proposed CGM can effectively leverage multi-view informationand model correlation information in transaction data pointsfrom price and volume perspectives, and thus outperformingstrong baselines by a large margin.Our main contributions are summarized as follows: We propose and emphasize the importance of introducing long-term and sudden event information besides thepreviously applied short-term transaction data in the volume prediction task to regularize the randomness existing in the short period of time and detect the abruptchange of volume caused by sudden event.2MethodologyIn this section, we first give the formulation of trading volume movement prediction. Then, we introduce the proposedmodel in details.2.1Problem FormulationWe model the trading volume movement prediction as aclassification problem. Given a series of hourly transactiondata points in the past few days containing N data pointsX {x1 , x2 , . . . , xN }, of which each xi consists of volume data xpi and price data xvi . Each xp consists of hourlyhighest price, lowest price, open price and close price. Eachxv consists of hourly volume v and the proportion of it in thewhole day. Besides, there are some events encoded as newsinformation D released in the market.Therefore, the task of volume movement prediction can beformalized as follows: given X in the past n days and severalfinancial news D that take place after the trading market beingclosed, the model should predict the volume proportion of thefirst hour in the next trading day as positive or negative, whichcan be formally expressed as:n 11Xvi ,v̄ n i 0vuuvσ tY (vn v̄)/vσ .n 11 X(vi v̄)2 ,n 1 i 0(1)(2) To systematically coordinate the multi-view information, we propose a Correlation-powered Graph-basedMulti-view (CGM) modeling method. Heterogeneoussequential short term and textual sudden news are organized according to the multiple types of long-term stockrelations in a multi-view graph.To alleviate the randomness, we consider the label as positiveif Y exceeds 0.5, as negative if Y is below -0.5. We alsoforecast the log value of trading volume v based on the sameinformation as volume movement prediction as reference. Experiment results show that our method can outperform other strong baselines by a large margin. Furtheranalyses testify the effectiveness of the proposed multiview modeling and correlation learning module.The overview of our method is shown in Figure 1. Our modelcan be partitioned into four major components, namely, astock relation graph which is built by long-term stock priceand volume information, a short-term fluctuation module37652.2Model Overview
Proceedings of the Thirtieth International Joint Conference on Artificial Intelligence (IJCAI-21)that models price and volume data with the stock relationgraph, a sudden event fusion module that fuses textual newsinformation with short-term information by treating it as thelast time slot of the transaction data sequence, a DCCA module which is intended to highlight the correlation informationof the price and volume within a single stock.2.3Long-term Stock Relation Graph BuildingThe historical trading price and volume indicate long rangestock attributes which can provide very valuable informationfor modeling relation among stocks. To make our model consider long-term stock relation information, we build a stockrelation graph with multiple relation types based on historical trading information. In this graph, each node representsa stock. The nodes are connected according to the two correlation matrices, which are obtained by statistical correlation (e.g., Pearson’s Rank) among stocks based on the tradingprice and volume information in five years. The positive values in the graph indicate positively correlated, while negativevalues indicate negatively correlated. We define four kindsof relationships between nodes depending on the price correlation polarity and volume correlation polarity, namely, price(volume) positively correlated (correlation threshold) andnegatively correlated (correlation threshold).2.4is a one-layer feed forward network with sigmoid (denoted asσ) as activation function. a, o, ρ denote input, forget and output gates respectively. Here we use x to denote price data xpor volume data xv which are taken as the input to the pricegraph or volume-graph. This module first aggregates information from neighboring nodes with aggregation layer, andthen apply a gating mechanism to fuse information from theprevious layer of current time-step hli , the final layer of theprevious time-step hmi 1 , the input at current time step xi andthe aggregated neighbor information ξil to dynamically guidethe model to select valuable information.2.5Besides short-term trading information, suddenly releasedevents can significantly affect trading market. Therefore, wepropose to incorporate sudden events into short-term fluctuations by appending the sudden events to the last time pointof the short-term sequence, which forms a temporal heterogeneous graph. We extract headlines of financial news to represent events, which is encoded via a news encoder.News Encoder We employ a LSTM with attention mechanism [Bahdanau et al., 2014] to extract features of news,which can be formulated as follow:Short-term Fluctuation ModelingTransaction time-series data modeling deals with the fluctuation in short term. Because of the noisy fluctuations existedin the trading data, it is a desirable ability to incorporate longterm information to alleviate the short-term noise. In contrastwith the previous work [Libman et al., 2019], which viewsthe price and volume data as a whole and feeds them into aneural network to get a mixed representation, we argue thatthere is a heterogeneity gap between price data and volumedata, therefore we separately process price data and volumedata as price-graph and volume-graph.Each layer of our short-term fluctuation module consistsof two parts, aggregation step and update step. The aggregation step is bound for aggregating the neighboring information, while the update step is bound for updating the hiddenstates. We propose to apply RGCN [Schlichtkrull et al., 2018]to model such a multi-relation graph in the aggregation step.Furthermore, to model the sequential information of the timeseries data, we propose to upgrade the classic LSTM unit intoa more powerful form suitable for graph as the update step inour module. At the lth layer (out of m layers) of the ith timestep, the process can be expressed as follows:ξil σ(X 1 1Dr 2 Ar Dr 2 Hil Wrl Wh Hil )(3)rali , bli , oli , uli , ρli fθl a , fθl b , fθl o , fθl u , fθl ρ · ([ξil ; hli ; xi ; hmi 1 ]) (4)cl 1 σ(bli ) cli σ(ali ) tanh(u) σ(ρli ) hmi 1i(5)hl 1i(6) σ(oli )tanh(cl 1),iwhere Ar is the adjacency matrix of relation r,D 1/2 Ar D 1/2 denotes the normalized symmetric adjacency matrix, and Wrl is the trainable filter in the lth layerfor relation r. H l is the hidden representation in the lth layer.ξ l is the aggregated neighbor information in the lth layer. fθ3766Sudden Events Fusionĥt LST M (ĥt 1 , zt ),(7)h̄ Attention(e; ĥ; ĥ)(8)where zt is the embedding of the tth word, e is stock nodeembedding as query to perform attention.The node representation of integration-graph is the combination of stock embedding e, news text vector h̄, price vectorhp and volume vector hv , which is used for the final prediction of the volume movement:g W1 (ReLU (W2 ([e; h̄; hp ; hv ]))),(9)where W1 and W2 are parameter matrices and ReLU is anactivation function. Finally, g is taken as the node representation in integration-graph to perform graph aggregation asEquation. 3 to obtain the final stock representation ĝ.2.6Inter-view Correlation EnhancementTo highlight the correlation between volume and price ofa single stock from a global angle, inspired by recent advances of several work [Sun et al., 2020; Gao et al., 2020],we propose to use a deep canonical correlation analysis(DCCA) [Andrew et al., 2013] to capture essential commoninformation from both price and volume perspectives. Specifically, the output of price-graph and volume-graph is passedinto a Siamese Network [Koch et al., 2015], whose two bodies are denoted as φ and ψ, to transform the input into common space with non-linear transformations. DCCA attemptsto maximize the correlations of the two perspectives via maximizing the output of φ and ψ, denoted as FX φ(X p ; θ1 )and FY ψ(X v ; θ2 ), by finding two linear transformationsC , D . The objective of DCCA is expressed as follows: θφ , θψ arg min CCA(FX , FY )θφ ,θψ arg max corr(C T FX , D T FY ).θφ ,θψ(10)
Proceedings of the Thirtieth International Joint Conference on Artificial Intelligence (IJCAI-21)Let R11 , R22 be covariances of FX , FY , the cross-covariance1122R12 R22, and the canonicalof FX , FY as R12 . Let E R11correlation loss for updating Fx , Fy can be defined as1losscorr trace(ET E) 2 .(11)We minimize losscorr to highlight correlation between priceand volume data of a single stock.2.7ObjectiveGiven the aforementioned structure, the entire volume movement prediction process can be formalized as follows:P sof tmax(Wl ĝ)Xlossc qlog(P ).closs loss λlosscorr(12)(13).(14)Where q is the volume movement label. λ is a coefficient tobalance two parts of loss. Wl is a parameter matrix.3ExperimentThis section describes the experimental dataset, evaluationmetrics and baseline algorithms for comparison.3.1DatasetWe choose the top 500 stocks in Tokyo Exchange known asTPX500 to perform experiments. Because the news data maycontain noise which do not affect the stock market, following [Li et al., 2020], we first pick out the news with the “RIC”label provided in the data by Reuters, indicating it to be astock-influencing news. Then we pick out the news with financial keywords provided by [Chen et al., 2019]. In thistask, we only predict the movement when both the news isavailable and the volume movement surpasses 0.5 times ofhourly standard deviation after subtracting the mean of hourlyvolume of this stock. Finally, there are 27,159 positive movements and 34,562 negative movements. We split the data inthe period of 01-01-2018 04-30-2018 as the developmentset and the data in the period of 05-01-2018 09-30-2018 asthe test set and the rest as training data. More detailed statistical information of the dataset is demonstrated in Table 1.3.2Evaluation MetricsFor volume movement prediction, we use accuracy to evaluate the model performance. Besides, we also perform logvolume value prediction to further verify the performance ofeach model as reference. We minimize a MSE loss in placeof the cross-entropy loss in Equ.p13 for regression. In thisPM1task, we adopt MSE M(yi ŷi )2 and RMSE i 1q PM12i 1 (yi ŷi ) to evaluate the errors between groundMtruth log volume and predictive output.3.3Baseline ModelsWe include several algorithms as baselines to compare theperformance, including classic methods as well as state-ofthe-art models based on deep neural networks. Random: this model predicts the movement to improveor decline randomly.3767DatasetNode #TrainDevTestTPX50049853,9943,3104,417Table 1: Dataset statistics. “Node #” is the number of the stocks ofthe dataset. “Train”, “Dev”, and “Test” are the sizes of the trainingset, development set, and test set. Moving Average (MA): takes the arithmetic mean ofthe past n day volume data as prediction. Classic classification and regression methods: RandomForest (RF), Logistic Regression (LogisticR), Linear Regression (LinearR), Support Vector Machine(SVM), LSTM. LSTM SVM [Libman et al., 2019]: is a hybrid modelcombining the results from LSTM and SVM, which usesthe LSTM output as the SVM feature to do prediction. LSTM-RGCN [Li et al., 2020] is a graph-based methodwith LSTM mechanism to alleviate over-smoothing. Intheir method, news and stock relation information aretaken into consideration. FinBERT [Araci, 2020] is a language model pre-trainedon financial news. Here we finetune the released modelwith the news in our dataset for prediction.3.4SettingsFor machine learning baselines (RF, LogisticR, LinearR,SVM), we use the implementation and default setting inscikit-learn2 . For other baselines, we use the released codeand default settings for implementation. The term n is set as20, the λ in loss function is empirically set as 1. The siamesenetwork is implemented with a three-layer MLP [Bengio,2009] and the two bodies do not share parameters. For LSTMand LSTM SVM, we use the transaction data of price andvolume in the past 20 days as input feature. For other baselines, we concatenate price and volume hourly data in thepast 20 day as input to do prediction. The layer numberof LSTM and LSTM SVM is set to be 2. Our price-graphand volume-graph have one aggregation layer and one update layer and integration-graph has one aggregation layer.We set the threshold of correlation edge to 0.6, that is, onlywhen the weight of the edge exceeds 0.6, there is an edgebuilt between the two nodes. We use GLoVe [Penningtonet al., 2014] trained on financial news as the initializationof word embedding, and the size of word embedding is 50.The hidden size of LSTM-based baseline and our model is300. We use Adam optimizer to train LSTM-based baselines and our model. The learning rate is in the range of{10 6 , 10 5 , 10 4 , 10 3 , 3 10 3 } and we adopt modelswith the best performance in developing set for testing foreach baseline and the proposed CGM.3.5ResultsThe overall performance is shown in Table 2. There areseveral major observations. First, random guess yields theweakest result which is about 50%, and our proposed CGM2https://scikit-learn.org/stable/
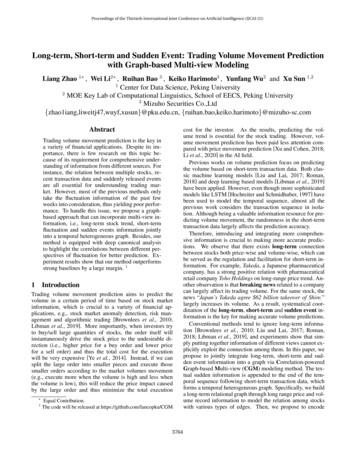
Proceedings of the Thirtieth International Joint Conference on Artificial Intelligence LSTM SVMLSTM-RGCNFinBERTCGM (ours)-ImprovementAccuracy 50.12 0.7656.26 0.00**54.97 1.6853.91 0.0057.65 2.4457.13 2.1353.38 2.5754.50 3.2661.21 2.32 6.2%MSE **0.16990.20330.18350.17550.17060.1657**0.1611 2.7%RMSE **0.41220.45090.42830.41890.41310.4070**0.4013 1.4%the movement of volume is a more feasible objective.3.6Table 2: Overall performance of all the models. Accuracy is thehigher the better, MSE and RMSE scores are the lower the better.The best performance is highlighted in bold. We show average values of five experiments with different random seeds for each modelin all the three metrics. In volume movement prediction task, wealso show the standard deviation of all the models.Model VariantsFull Modelw/o newsw/o DCCAw/o integration-graphw/o volume-graphw/o price-graphAcc MSE RMSE 61.2158.03 ( 3.18)59.18 ( 2.13)58.68 ( 2.53)56.26 ( 4.95)59.36 ( 0290.40880.40920.41150.4097Table 3: Ablation studies. “w/o news” denotes that we don’t introduce news into integration-graph. “w/o DCCA” denotes that weassign λ in Eqn 14 to zero. “w/o integration-graph ” means that wecombine news and output of price graph and volume graph, and thenfeed them to a two-layer MLP to do prediction. “w/o volume/pricegraph” denotes replacing volume/price graph with a LSTM neuralnetwork to model short-term time-series data.outperforms all the baselines by a large margin, exceedingthe best LSTM-based baseline by 6.2% improvement, whichconfirms the validity of our proposed model. Second, we canfind that simple baseline LR shows competitive results compared with deep learning based baselines but far from ourmethod, we argue that the reason may be that the increasingof model complexity is not the key of performance improvement, instead, the introduction of different views (long-termand sudden information) is crucial to making comprehensiveprediction, therefore yielding better performance. Third, onregression metrics MSE and RMSE, our proposed methodalso exceeds other baseline models, showing that our modelis not only capable of identifying the movement of tradingvolume but also can forecast specific value of it more precisely. The reason behind may be that our approach can better identify the direction of the stock market shock by capturing more comprehensive information, which makes it able tomake a more accurate regression forecast. Fourth, comparedwith accuracy, the gaps on MSE scores and RMSE scores ofdifferent methods are smaller. We assume that trading volumeregression is a more challenging task which requires modelsto forecast the specific value of volume, however there is a lotof randomness in the specific value of volume and predicting3768AnalysesEffect of Multi-view IntegrationTo test the effect of integration-graph, we replace theintegration-graph with a two-layer MLP to combine sequential short-term information and sudden event information.More specially, short-term transaction data is encoded witha linear LSTM, the output of which is concatenated with theoutput of news encoder followed by a MLP network. Fromthe result in Table 3 we can see that the accuracy significantlydeclines by 2.53 points. Besides, regression based metricsalso suffer big loss. The reason we assume is that the longterm relation information within the graph is beneficial forcomprehensively integrating different views of market information and regularizing the randomness existed in short-termfluctuations. Besides, the graph structure can make useful information propagate from a node to its neighbours, thereforecontributing to forecasting for these nodes.Effect of Sudden EventTo test the effect of introducing sudden event information,we remove the news encoder in our module. We can find thatwhen news information is removed, the performance degradation of our method is obvious on accuracy but not as remarkable on MSE and RMSE scores. This shows that newsinformation can provide big help to model sudden accidentwhich is important to detect stock market movement. However, the effect is limited for volume value forecasting, indicating that the volume value forecasting relies more on recenttransaction variation, and it is a challenging problem to better exploit textual information for digital related regression,which needs further research.In the right part of Figure 2, we show the results of different filtering standard deviations defined in section 2.1. Itcan be seen that news information brings bigger influenceunder more significant movement situations, which is reflected by the fact that models using news (proposed CGMmodel and FinBERT) gain more improvement than the baseline model that only involves transaction data. Under both circumstances, our model enjoys consistent better performancethan baseline models. Furthermore, we can observe that whenthe movement is larger, the traditional method will suffermore performance degradation. This phenomenon testifiesthat using only short-term information is insufficient for volume movement forecasting.Effect of Long-term GraphTo see the effect of long-term relation graphs, we separatelyremove price and volume graph. From the results we can seethat both kinds of graph have positive effect on volume prediction. It can be also observed that volume-graph has largereffect than price-graph, this is expected because long-termvolume information has more direct connection with volumemovement. On the other hand, price-graph also contributesto the prediction of volume, which shows the importance ofmulti-view modeling.Effect of DCCAWhen the DCCA module is removed, both regression andclassification scores decline, verifying the effectiveness of
Proceedings of the Thirtieth International Joint Conference on Artificial Intelligence (IJCAI-21)rather than the text that is used to do prediction. In this paper, we introduce multi-view information to better understandstock market for volume prediction.4.2Figure 2: (a) The left part of the figure is the associative stock movement inference result, where the nodes are not attached with news.(b) The right part is the results of using different standard deviationsto filter movements regarding to the test dataset construction in section 2.1. It can be seen that our model performs consistently betterthan baselines with different volume shock levels.highlighting correlations between different perspectives ofthe volume and price of a single stock. This phenomenontestifies our assumption that the correlated part between priceand volume information reveals the movement trend of thestock while alleviating the effect of noise in the price or volume individually. Furthermore, this shows that the simpleconcatenation of price and volume cannot effectively modelthe correlation between price and volume.Associative Prediction AnalysisThere are many situations where stocks are not associatedwith news which we denote as no-news nodes. Because ofthe graph structure, our method can cope with this situationby the propagation of news information from news-associatedstocks to their no-news neighboring stocks via graph edges.Figure 2 shows the association inference results. We canfind that our method surpasses other baseline models by alarge margin. This verifies our conjecture that our proposedgraph structure is effective and the news information can efficiently propagate from news-associated stocks to no-newsstocks, which is crucial to forecasting the shock in tradingvolume for those stocks.44.1Related WorkVolume PredictionTraditional volume prediction focuses on predicting the volume with classic machine learning methods solely based onpreceding transaction data. Liu et al. [2017] propose toapply support vector machine for regression to predict thechanges of volume percentage. Roman [2018] propose to apply Bayesian inference to model and forecast intraday trading volume, using auto-regressive conditional volume (ACV)models. With the rapid development of deep learning, researchers have also converted to apply neural network models to predict volume. Libman et al. [2019] propose to applyLSTM to model the time series transaction data followed bythe support vector machine for regression to predict the trading volume. Oliveira et al. [2017] attempt to use textual information from micro-blog, but the text in their work only playsthe role of the source of sentiment. It is the sentiment result3769Heterogeneous Information IntegrationComprehensively understanding of information from multiple sources is paramount to improving the performance ofvolume prediction. However, the heterogeneity gap betweeninformation sources makes it hard to integrate heterogeneousinformation. Previous researches mainly focus on mappingmultimodal data into the common space. [Yang et al., 2019]propose to utilize GCN [Kipf and Welling, 2017] to combine multi-aspect information of entities to learn the entityembeddings of multilingual knowledge graphs. [Zadeh etal., 2017] propose to integrate language, audio and videodata into a common space via tensor outer product operation.Othe
that models price and volume data with the stock relation graph, a sudden event fusion module that fuses textual news information with short-term information by treating it as the last time slot of the transaction data sequence, a DCCA mod-ule which is intended to highlight the correlation information of the price and volume within a single stock.