Transcription
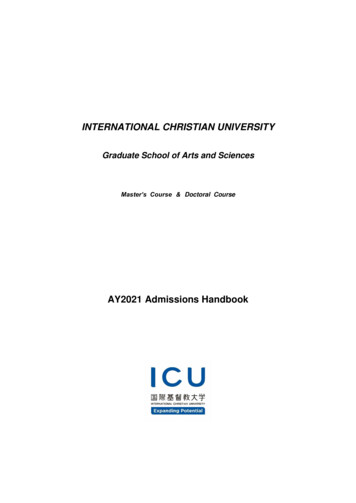
Tectonophysics,Elsevier321188 (1991) 321-347Science PublishersB.V., AmsterdamLatest aspects of earthquake prediction in Greece based on seismicelectric signalsP. VarotsosSolid State Section, Department(ReceivedOctoberand M. Lazaridouof Physics, University of Athens, Athens, Greece ’10,1989;revisionacceptedApril 27,199O)On the occasionof Professorof the 80th birthdayKessarAlexopoulosABSTRACTVarotsos, P. and Lazaridou,M., 1991. LatestTectonophysics, 188: 321-347.aspectsof earthquakepredictionin Greecebasedon seismicelectricsignals,Since 1983, continuousmonitoringof the electrotelluricfield has been carried out using an array of measuring stationslocated at various sites in Greece. The basic physical properties of the transient changes-seismicelectric signals (SES)-inthe electrotelluricfield that are forerunnersof earthquakeswere first described six years ago. Since then a large body of datahas been collected resulting in new insight into various aspects of the method.The present paper reviews the latestdevelopmentsin SES-based earthquakepredictionand describes the current proceduresused to predict the epicenter andmagnitude of an impending earthquake.A detailed list of the predictions officially issued in Greece during the past 3 years (January 1, 1987-November30, 1989) isalso given. Public warnings were issued well before the most destructive seismic activity.detectableIntroductionbefore the occurrenceof earthquakes(EQ).Since January 1983, continuous measurementsof the earth’s electric field have been made atvarious sites in Greece. The data (8 differentialchannels per station, sampling rate: 3 readings/set/channel)are continuously transmitted viatelephone lines to a central station (Glyfada, GLY)located in an Athens suburb. The present configuration of the telemetric network, shown in Fig. 1,is slightly different from that given in Varotsosand Alexopoulos (1984a). Except for station SER,all stations are located in continental Greece.Varotsos and Alexopoulos (1984a) reported thattransient variations in the earth’s electric field hereafter called seismic electric signals (SES)-are’ Mailingaddress:0040-1951/91/ 03.50Knossoustr. 36, AthensIn 1984, several examples, together with a shortdescription of the basic properties of SES, werepresented by Varotsos and Alexopoulos (1984a,b). A large body of data has since been collectedresulting in new insights into various aspects ofthe method. The present paper details the mostup-to-date knowledge of the physical properties ofSES, as well as the current procedure used inpredicting earthquake parameters. Some examplesof recent SES are given in Figs. 2-7.Latest insights into the basic physical features ofSESData collected since 1983 necessitate a reconsideration of certain aspects formerly presented byVarotsos and Alexopoulos (1984a, b).16561, Greece.0 1991 - Elsevier Science PublishersB.V.
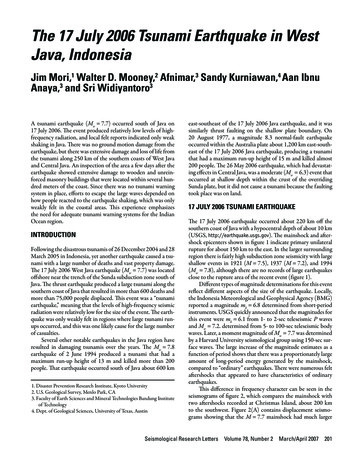
P. VAROTSOS32221I22I23I25I24I26I-I4/IPIFig. 1. Map showingwhich variationsThe two largestarealsoGorgopotamos;Kavala;the distributionin the electriccities Athensshown.I(ATH) and ThessalonikiIOA Ioarmina;NAF Nauplio;OR0Serifos; SPA Sparta;of the Greekstationsatfield of the earth are measured.ASS Assiros;KER Keratea;IIGOR KAL Kalamata;KAV KOR Korinthos; Oropos;(THES)GLY Glyfada;ANDM. LAZARIDOUearthquake may, however, be much longer, e.g.,around 22 days. An example is provided by thedestructive earthquakes in the Killini area, onSept. 22,1988 and Oct. 16,1988. This is due to thefact that the time lag, At, is independent of themagnitude of the earthquake (see Table 1, Figs. 7and 8). Consequently a sequence of SES withdifferent amplitudes does not necessarily correspond to a series of earthquakes with magnitudesin the same order. This is illustrated in Fig. 9which depicts a sequence of four SES with thefirst being the largest while in the correspondingsequence of four earthquakes the last one is thestrongest (see also Appendix 1). In this example,the time lag between the largest (in amplitude)SES and the strongest earthquake obviously exceeds the aforementioned usual maximum of 11days.Furthermore, small values of At, of the order of10 h, are usually related to aftershocks. On theother hand, seismic areas that have been quiescentMEG Megara;PIR Pirgos;SER VER Veroia; VOL Volos; THIThiva.SES duration 7The duration of SES lies between l/2 min andseveral hours (Varotsos and Alexopoulos, 1987)and does not depend on the earthquake ,magnitude, M.Time lag between SES and earthquakeFor isolated events (i.e. when a single SES anda single earthquake allow a one-to-one correlation), the time lag At lies between 7 hours and 11days. No correlation between At and M has beenobserved.For cases of prolonged electrical activity (i.e.when a number of SES, detected within a timeperiod comparable with the time lag At, is followed by a number of earthquakes) it has occasionally been observed that, although the time lagbetween the onsets of the electrical and seismicactivity does not usually exceed 11 days, the timelag between the largest SES and the strongestFig. 2. SES detectedJulyby the EW dipole (L 300 m) of NAF on17, 1988. The signalrecordedon the NS shortthe issue of telegramearthquakeoccurredwest of Athens.startsdipolesat lo:02GMT.(not shown)No. 9 (see TableIt was alsoand provoked1). The correspondingon July 23 with M, 4.4,200km south-The scale applies only to the NAF dipole.
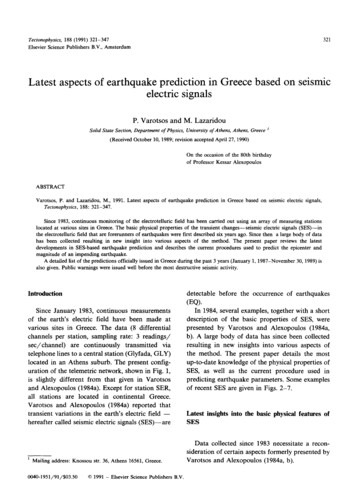
LATESTASPECTSOF EARTHQUAKEPREDICTIONBASEDON323SJ3Relation between SES amplitude and earthquakemagnitude;;.fHALIQA- EW.IOA-.NBiConsider the case of a given station S, locatedin the area A and a seismic area B which emitsSES that can be recorded at this station (seesection on selectivity effect). The following twocases can be distinguished, depending on the number of components that appear:(a) When only one SES component is recorded,the relationship between the SES amplitude, expressed as AV/L, and the earthquake magnitude,M, is such that a plot of log(AV/L)versus Mgives a straight line with a slope between 0.32 and0.37. If another seismic area C produces SES thatare recorded at the same station but solely on theother componentdipole array, the plot oflog(AV/L) versus M is again a straight line, withthe same slope but with a different intercept. ThisFig. 3. SES recorded on August 11, 1985 on the short EW IOAdipole (L 47.5 m). The corresponding earthquake (M, 5.1)occurred on August 13, 1985 with epicenter at 38.0 o N, 21.4O E,i.e. close to PIR. For HAL-stationsee fig. 1 of Varotsos andAlexopoulos (1984a).for a long time produce SES with At values of theorder of a few days or more.Form of the SESIn most cases, SES are recorded at a station byboth component dipole arrays, i.e. EW and NS,usually with different values of AV/L, where L isthe length of the dipole (e.g. Figs. 4, 8). However,cases have been observed (e.g. Fig. 3) where theSES was recorded on all the parallel dipoles onlyin one direction.The SES may have a gradual or abrupt (i.e.within 20 s) onset and a gradual or abrupt cessation. The combination “gradual onset/abrupt cessation” has neuer been observed. It should also bementioned that SES originating from the sameseismic area and recorded at the same stationoccasionally have strikingly similar shapes, thoughof course different amplitudes, since the latterdepend on the magnitude (see below) of the corresponding earthquakes.Fig. 4. Example of an SES recorded by two perpendiculardipoles. Signals detected by the short dipoles (L 70 m) atstation ASS on April 25,1985. The corresponding earthquake(M, 5.8) occurred on April 30, 1985 with an epicenter at39.3O N, 22.9O E, i.e. close to VOL. Note that this SES was notrecorded at station VOL due to selectivity.
P. VAROTSOS324-04-ANDM. LAZARIDOU(0.32-0.37) but with different intercepts (Figs. 10and 11). This difference in the intercepts of thetwo components (EW and NS) is partially attributed to a difference in the so-called “relativeeffective resistivities” pre, as defined by Varotsosand Alexopoulos (1984a, b).00Comments on the prer values of a given stationFig. 5. Exampleof an SES lastingat stationonKERmore than 1 hour, recordedJune 6, 1986by (almost)parallel dipolesAD (L 1.3 km) and AE (L 1.5 km) orientedNNW.Note that electrodelies withinorderdipolesA is commona dyke (granodiorite)of some meters,differentrocks (graniteit was verifiedwith a surfaceD andand marble,respectively).that the variationearthquakevariationapproximatelyto both dipoleswhile pointsnot due to an electrochemicalA. The correspondingSeveral points about the value of p,,, at a givenstation are worthy of note:(a) The prel values of two parallel, short dipoles(e.g. 50 m and 200 m) are the same only for astation located in an area with homogeneous geology beneath the station (which, however, may beanisotropic). If there are strong inhomogeneitiesclose to the station, the prel values of two paralleldipoles may differ even by one order of magnitude. An example of this is given later. In suchcases a vertical SES-component is usually expected.widthandof theE are locatedFromin00 12other--Ishown in the figure isat the common(M, 4.8) occurredGMT on June 6, 1986 with the epicenterIIpointat 15:35at 38.9 o N, 22.9 o E.-;’;’variation in the intercept is not solely due to adifference in the epicentral distances rAB and rAcsince it is also observed when rAB r,,. The effectappears to be, at least partially, due to a significant difference in the resistivities of the station’stwo component dipole arrays.(b) When SES are recorded by both perpendicular dipole arrays at S,, for earthquakes from areaB, the ratio of the amplitudes of the two components remains the same for all earthquakes and, assaid before, the amplitude of each componentincreases with earthquake magnitude so that theresulting plots of log(AV/L) versus M, for eachcomponent are straight lines with the same slope *Fig. 6. SES recordeddipolesoccurred* AV is measuredin mV and L in meters.at KERon Julyas in Fig. 5. The correspondingon July 5, 1986 with epicenterdepth of around1, 1986 by the sameearthquake(M, 4.6)at 37.8O N, 22.4O E and80 km.
LATESTASPECTSOF EARTHQUAKEPREDICTIONBASEDON325SESRecognition and elimination of noiseNoise obstructingally be classifiedon the naturenetotelluricthe clarityof SES can gener-into three categories,of the cause:dependingelectrochemical,mag-and cultural.Noise of electrochemicaloriginNoise of electrochemicalally ascribedorigin,to a changewhich is gener-in the contactpotentialbetween the electrodes and the ground, e.g. due torain, can easily be recognised when a number ofparallel dipoles at every station for each measuring direction are installed (for details see Varotsosand Alexopoulos,1984a). Furthermore,the effectcaused by the daily temperaturevariation(especially when the electrodesare buried at shallowFig. 7. An exampleof electricalactivityrecordedat IOA with 4SES of the same polaritywithin50 min on ityprecededthe catastrophicwhicha tedlengthsin the telegramearthquakeswas issuedof the dipole havingdistinguishdipoles at stationshownIOA (see Appendixarea,fortraceseriouslyaffectthe measurementspoles have lengthscase of groundedAlexopoulos,(see text). The apparentlyreversedthe recordings1986).inMagnetotelluricdisturbances2). All SES correspondtoThesemagneticare induced by changes in the earth’sfield. As they are (almost) simultaneous-ly recordedat all themisinterpretedas SES.prel value(b) Theof a shortof equalepicenters at equal distancesfrom different seismic areasgive SES with comparableregistered by the same longcomparablewhen the SESquakes are recorded by thestationdipoleis notthe same as the pre, value of a parallellong dipole.(c) Two earthquakeswithdifferentratiosmagnitudewithfrom the station butdo not necessarilyAV/Lvalues whendipole. They are notof these two earthshort dipoles of the( AV/Lthe di-of the 8an increase of both components.necessarilywhenof the order of 10 km as in thetelephonelines (Varotsos andis due to thebeen intentionallybetweenonin Fig. 21. Itof the Killiniof the SES on the IOAto better31,1988see Fig. 8). Thisdepth, e.g. 0.5 m) can easily be discerned.Theinfluence of electrochemicaldisturbancesdoes not1EW)/( AV/L 1NS); the latter difference will generally reflectdifferentAV/Lvalues on a given long dipoleprovided that the pre, values of the two perpendicular short dipoles have a ratio other than unity(and the long dipole is not parallel to any of theseperpendicularshort dipoles).stations,theycannotThis type of noise can be eliminatedmining for each station the impedancebeby detertensor Zwhich interrelatesthe variationsmagnetic(H) and electric (E)in the earth’sfields en determinedthe eliminationof the magnetotelluric noise is easily achieved by calculatingthedifference:E - Z x H (which should be equal tozero for both measuringabsent).directionswhenSES areThe determinationof Z for each station leadsto the calculationof the so-called “apparentresis. . .trvmes” paNs and paEw as a function of frequency(and hence as a function of depth). The followingcommentsconcerningthese apparentresistivitiesmay be useful:(a) The ratio of the two apparent resistivities is
P. VAROTSOS326Fig. 8. Magnifiedportionof Fig. 7. The correspondingfigure are in mV). 1: EW, L 47.5 m; 2: NNE,recordedby four other dipolesdirectionsand lengthsof dipolesM. LAZARIDOU1, 2, 3 and 4 are as follows (the scales in theL 2.5 km (see Fig. 25); 3: NS, L 48 M; 4: EW, L 181 m. These SES were alsowith the followingdirectionsand lengths:NS, L 100 m, NS, L 184 m, EW, L 48 m and EW,L 100 m (see also Appendixnot equalANDto the ratio of the two SES- “relative2).laou, 1987)it seems that the geographical distri-effective resistivities” &. t,EWand &et,Ns which areempirically determined for each station (Varotsosbution of the stations falls into three zones distinguished by different p w/p&s ratios. For ex-and Alexopoulos, 1984a, b).(b) For most of our stations, the ratio of thetwo apparent resistivities is appreciably differentfrom unity. If periods of the order of 10 s to 1 minample, the stations lying along the west coast ofare studied (Lazaridou-VarotsouIFig.9. Diagrammaticfollowedby a sequencebetweenthe initiationseismic activitythe largestlogand Papaniko-Irepresentationof earthquakes.of the electricalis aroundof a sequenceA!lLlof SESMNote that the tune lagand the initiationof the11 days, while the time lag betweenSES and the strongestearthquake(For an explanationsee Appendixmay exceed this.1.)Fig. 10. Relationnentsdatabetweenof a SES versuscorrespondthe amplitudesthe earthquaketo SES recordedemittedof the two compomagnitude(M,).Theat the samestationandfrom the same seismic area.
LATESTASPECTSOF EARTHQUAKEPREDICTIONBASEDON321SESby studying a larger number of stations along thewest coast.AW-iWIDiscrimination between cultural noise and true electrotelluric disturbancesAWiFig.11. Typicalcomponentsexampleof the relationof SES collectedbetweenat the same stationfrom the same seismic area for variousLWtwoand emittedearthquake(M,). Note their constanttheCultural noise arises from electrical installations, e.g. industrial plants, high-voltage lines,electric trains, etc. Noise from a d.c. electric traincan be detected from a distance of around 15 km.Although there is no general technique to avoidthis type of noise (except, of course, by installingstations far enough from noise sources) somesuggestions are made that might, at least partially,eliminate such interference.Assume that the noise source N is close to ashort dipole ErW,. In general such proximal noisecan be easily recognized because (in a homogeneous area) the cultural signal voltage AT/ does notgenerate the same field strength AV/Linneighbouring dipoles with the same orientationbut of different lengths. After the signal has beenidentified as being due to a proximal source it canbe distinguished from SES by the following procedure: If the noise source N lies in the vicinity, butnot between the electrodes, of a dipole E,W, (Fig.12a) a long dipole E’W’ several km long is installed so that E’N B NW’ (e.g. E’N 5 km andNW’ 100 m). It is evident that a disturbanceemitted from the noise source N will be recordedmagnitudesratio.Greece have p&, p&s in contrast to stations inthe central part of the country where p\s p\w.A more thorough examination of the magnetotelluric data indicates that although &w &s alongthe west coast, the ratio &w/paNs is not constant.It seems that the direction of maximum resistivityis perpendicular to the Afro-Asian trough (afterhaving excluded the so-called coast effect). Thisobservation, however, needs further confirmationI-&---. .ElW’WIaIIN,-g-.-.W'wNNFig. 12. Dispositionof electrodessourceN, for differentpositionsE’W’have a polarityoppositedipolesEl1W1Iof short dipolesinstallationand long dipolesthat allowsto that of the shortby the long dipoleE’W’dipoleof a short dipole E2W2 very close to the noise sourceallow permanenteliminationbW;-the recognitionCof signalsErW,. The noise signalsthat obey the rule AV/L(c) N lies at distancesWI1WI-EtWt. (b) N lies at distancesdetect noise signalsor E’W,.dipoleWIEIEII. . . .of N. (a) N lies very close to a shortEtWt and EsWz. The short dipolesthose recordedEzwIof the orderN (or of a long dipoleof the order constantoriginatingdetectedof a few km from the shortbut exhibitpolaritiesof 10 km from the shortE2Ws’ with the electrodeof the noise signal (see text).from a noiseby the long dipoledipoleoppositetoE,W,. TheE, close to N) may
P. VAROTSOS328E,W, and E’ W ’ with appreciablyand with opposite polarities.by the dipolesdifferentamplitudesOn the otherturbances)hand,poles with the sameassumedSES (or magnetotelluricwill be recordedby bothpolarityto be more distantfor all the measuringThe same methodcan in principlesince their source isand on the same sidepoints.of recognizingalso be appliednoise source lies at distanceskm from the short dipolesinstallingdis-of these di-a long dipole,culturalnoiseto cases where theof the order of some(Fig. 12b). Then,the electrodeswhenE’W’such an arrangementAK recordedby the dipoleexceedcorrespondingtheturbancesordersthe disturbancesE,W,(or E,W,‘) willsimultaneousAV, at the dipoleof magnitude.M. LAZARIDOUdis-E;W, by one or moreIn otherwords,the dipoleE2WZ (or E2W2/) is used to record the same type tlymagnified.withtheTherefore,dipolefor dis-from the noise source N:AV,AVrL, L,areplaced so that a disturbanceemitted from N willbe recorded by the long dipole and the parallelshort dipoles (e.g. E,W, and E,W,) with oppositepolarities. In such cases, the noise source generatessignals at short dipoles that obey the rule AV/Lindependentof the dipole length, L. Therefore,when short dipoles (for a homogeneousfound to obey the rule AV/L constant,W,‘). WithANDOn the other hand, variationspresumablydistant epicenter,Av,L, L,Thus,largerdue to SES, from agive:AV,whenX (A&/L,)/(than unity, the signalAV,/L,)is muchis due to noise (as-area) aretwo pos-sibilities exist for the interpretationof a voltagevariation:either it is due to a noise source locatedat a distance appreciablylarger than the length of*the shortmentioned0CQmdipoles, or it is an SES. (As alreadymagnetotelluricdisturbancesare iden-tified in a differentthat a combinationNway.) We conclude thereforeof long and short dipoles, as0indicated in Fig. 12, is absolutely necessary for thediscriminationof SES from cultural noise. Otherwise a correlationachieved.EliminationbetweenSES and EQ cannotbeof cultural noise. mWhen signals from a noise source N appearonly for short periods of time (e.g. once or twice aday with a durationof a couple of minutes) theATH-GLY:-techniquesdescribed above can be of immediateuse in identifyingthem as noise and distinguishingthem from SES. But when a noise source operatescontinuouslyit becomes necessary to eliminate itpermanentlyfrom the records. In some cases, thiscan be achieved by assuming that a short dipoleE,W, (Fig. 12 ) has been installed some kilometersaway from a known noise source N. Anotherdipole is installedwith one extremity,say E,,close to N; the other end is installed either veryclose to E, (at W,), or close to the dipole E,W, (at/-T‘2vTER-GLY/i‘--loo?l”-Fig. 13. Example of the decrease of cultural noise with increasing distance from the noise source. The electrode ATH is in thecenter of Athens white electrodes TERstraight line with ATH so that ATH-TERGLY 1ATH-GLYkm. Note that the noise AVand TER-GLYand GLYhe on a 9 km and TERvariations at dipoleshave the same form with a ratioof around 40, although their lengths differ by a factor of 10. Itis evident that at night the noise, as expected, is quite low.
LATESTASPECTSOF EARTHQUAKEPREDICTIONBASEDON329SESinformationin the SES has not been lost since forthe SES we have AVl/L,the correspondingprovided that A&/L,,resistivitiesare equal and thatthe distance of the impending earthquakepreciablylarger than the lengths (L)is ap-of the di-poles. The true amplitude of the SES will now begiven by (AVJL,)-0240.-.--X (I -Z/x).Ifx Z I, thisexpression gives the approximate amplitude of the-SES at the dipole E,W, free from noise.itSelectivityRegionalof selectivitySelectivity is defined as the sensitivity of astation to signals from a restricted number ofseismic areas while remaining insensitive to SES-,from other areas which may be closer by. For(T-d-(,X-G)/40IFig. 14. Eliminationof noise of the dipoleGLY) by subtractingfrom the recordsi.e. (ATH-GLY)/40(compareT-Gthe quantity(i.e., TER(A-G)/40,with Fig. 13).suming that the two dipoles have comparable resistivities). In practice, A is not found to be exactly constant, but to depend slightly on frequency.The “transfer function” relating the noise signalsof E,W, and E,W, can be readily determinedthrough Fourieranalysisand by evaluatingthecorresponding coefficients for various frequencybands.Since the duration of SES is usually appreciably larger than 2 s, we can filter out signals ofshorter duration and assume that for the remaining frequencies the factor X is approximately constant. The value of A can be determined by comparing the amplitudes of AV, and AV, measuredover a time interval much larger than the period Tup to which the noise signal is significant. Oncethis factor is known, any single voltage variation(SES or noise) that is recorded as AVt and AV,can be used to calculate the value:1characteristicsLIAV,-X Z; AV2By recording the above difference (instead ofAV,) the noise coming from N is eliminated. Foran example see Figs. 13 and 14. Note that theinstance, station S,, located at A, can record SESfrom a given seismic area B (of course, for earthquakes with the same source characteristics andabove a certain magnitude) but cannot detect those(for earthquakes of comparable magnitude) fromanother seismic area C, even when the epicentraldistance r,, is appreciably smaller than the distance rAB. As a result, SES emitted from certainseismic areas cannot be “felt” by some stations inthe network, irrespective of the earthquake magnitude and epicentral distances.That the above phenomenon cannot be attributed solely to one of the following three factors:“ travel path”, “source characteristics” or “stationcharacteristics”, is demonstrated by the followingempirical observations:(a) Selectivityis not reversible. If selectivitywere only governed by the conditions along themain travel path between A and B, this wouldimply that when a station S, is sensitive to anarea B, a station at B should also be sensitive tothe seismic area A. However, this is not alwaysobserved.(b) Two stations and one seismic area in straightline. If two stations, S, and S,, lie along a straightline from seismic area C, they do not necessarilyhave the same selectivity as for C. An example isprovided by the stations KER and NAF which liealmost on the same straight line with the epicenterof the destructive earthquake that occurred close
330P. VAROTSOSto KalamataInthis(KAL)case,KAL-KERcity on Septemberalthoughtheis roughlythe SES was clearly13, 1986.nomenonis reproducibledistancefollowingsense: once a stationepicentraltwice that of NAF-KAL,recordedat KERbut not atto one earthquakeB,thissourceThe above examplephenomenonindicatesis not purelythat the selectivitya directionalphenome-areawhich influencecan be detectedazimuthsonly.line. If two seismic areas C and D lie along astraight line with a recording station S,, it mayfrom awillalsoB (abovepropertiesthe selectivitybe(with the samea certainThis reproducibilitythe physicalall earthquakesat some specificfromof itudesuggeststhento all futurenon in the sense that for each seismic area the SES(c) Two seismic areas and one station in straightS’ has been identi-selectiveearthquake1987).in time and space in thefied as beingselectiveand Alexopoulos,M. LAZARIDOUseismicall at NAF (for details of the SES of the Kalamatasee VarotsosANDin timeof the pathare permanent.As(with the same source characteris-tics) of equal magnitudeoriginatingat B give SESof equal amplitude at station S,,,, it appears thatthe reproducibilityalso exists for some aspects ofthe physical process which leads to “similar elec-happen that this station is sensitive to SES fromarea D but not to those from area C, even if thesmaller thanepicentral distance rAc is significantlytricity changes for similar preparatorystages ofearthquakes”.This “similarity”refers not only tothe distanceearthquakesrAo. Even in the case where a stationS, is sensitivecorrespondingto both seismic areas D and C, theSES may not have the sameratio (for the same dipole length).AV,w/AV,sThese ratios have been foundto have quite differ-ent values, even when the distance betweentwo seismic areas is appreciablysmaller thandistance of their epicentersfrom the station(for an exampledix 2).see the case describedthetheS,in Appen-The above observationindicatesthat in addition to the properties of the main path betweena stationmogeneitiesand seismicareas (and geologicalin the vicinityof the station)inhosomeof equalequal maximumthe polarity.magnitudefromSES amplitudesHowever,B givingat A but also toit does not always apply tothe form and durationof the SES. Thussignalscoming from a broad seismic area and recorded atthe same station may in one case have a durationof 2 min starting and ending abruptlyand, inanother case, a durationof 20 min with gradualonset and finish.Local characteristicsof selectivitySelectivity seems to be a phenomenonin whichboth large-scale (or “ regional”)and small-scale(or “local”) properties of the earth’s crust play aother characteristicsof the emitting sources mustbe important.For instance, the directional proper-significantrole. It has been observed thatstrongly inhomogeneousarea some sub-areas,ties of the current emitted (which might be relatedto the earthquakemechanism)could also play asignificant role in governing the occurrence of SESat remote points.surface dimensionsonly, may provideObservations(a), (b) and (c) suggest that selectivity depends simultaneously on: (i) physical properties(e.g. conductivity)of the main path betweenthe station and the seismic area; (ii) source properties (e.g. the mechanismat the focus of theearthquakefrom which the directionalpropertiesof the emitted signal might result) and (iii) thegeological structure in the vicinity of the recordingstation (e.g. inhomogeneitiesthat produce different resistivities along different azimuths from thestation).In spite of its complexitythe selectivityphe-in awithof the order of a few meterslocalities which play quite animportantrole in the detection of SES. When oneor both electrodes of a dipole are located withinsuch a “sub-area”,SES are greatly enhanced.Insuch cases, the length of the dipole is irrelevant;the SES collected with a dipole of a few meters inlength have AV-values comparableto those collected with a dipole a few kilometerslong. Theeffect can be better15 which representsdescribed with the aid of Fig.a real case observed at statione31Fig. 15. Arrangementas an amplifierof electrodes.----z-near a dyke AB, which actsof SES and magnetotelluricdisturbances.
LATESTASPECTSOF EARTHQUAKEFig. 16. MagnetotelhuicmV/div;variations2 dipole AA,,in marbleregistered1.25 mV/div;it; the lengths of the perpendicularkm) is locatedPREDICTIONBASEDON331SESsimultaneouslyby dipoles4 dipole AE, 2.50 mV/div.AE and AA,have oppositedyke from dipolesKER, which is located close to ancient mines inthe Lavrion area (see also Figs. 16-18). In Fig. 15“AB” represents a dyke with an electrode (ei)located within the dyke; a second electrode (e2) isinstalled so that the distance e,e, is of the order ofa few meters. Let us now consider three moredipoles e1e3, e,e, and e,e, with the same directionand with lengths of the order of a hundred meters.Cases have been observed where an SES was de-disturbancesKER:I dipoledipoles As A, and AA, are of the order of some meters. The electrodeand the vectors(L 200 m) lies on a differentFig. 17. Magnetotelluric1, 2 and 4 at stationThe points A and A, he on a dyke whereaswith a differentrecordedfrequencyat a verticaldirections.One electrodeAsAt,Scale 1.00Al is just outsideE of the dipole AE (L 1.5of dipoles3 (L 100 m) and5I, 2 and 4 and the scale is 1.0 mV/div.tected by the dipoles eie,, e1e3 and e,e, but not bythe dipole exe,. Note that in such a case, the SEShave practically the same AT/ value at the dipolese1e2, e,e, and eie,. Hence the corresponding AV/Lvalues are completely different, i.e. the AT//L valueof the dipole e1e2 is found to be several orders ofmagnitude larger than the corresponding values ofe1e3 and e,e, (see Fig. 18). In other words, theinhomogeneity “AB” acts as an “amplifier”; ancontentrecordeddipole installedat the same dipolesclose to a dyke.)as Fig. 16.
Serifos; SPA Sparta; VER Veroia; VOL Volos; THI- Thiva. SES duration 7 The duration of SES lies between l/2 min and several hours (Varotsos and Alexopoulos, 1987) and does not depend on the earthquake ,magni- tude, M. Time lag between SES and earthquake