Transcription
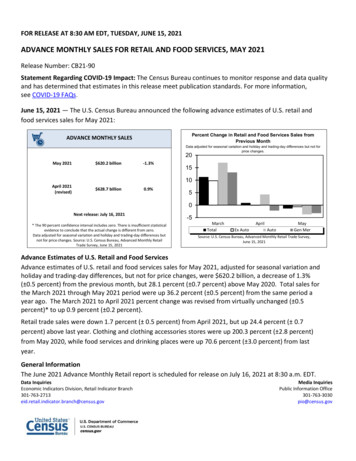
FOR RELEASE AT 8:30 AM EDT, TUESDAY, JUNE 15, 2021ADVANCE MONTHLY SALES FOR RETAIL AND FOOD SERVICES, MAY 2021Release Number: CB21-90Statement Regarding COVID-19 Impact: The Census Bureau continues to monitor response and data qualityand has determined that estimates in this release meet publication standards. For more information,see COVID-19 FAQs.June 15, 2021 — The U.S. Census Bureau announced the following advance estimates of U.S. retail andfood services sales for May 2021:Percent Change in Retail and Food Services Sales fromPrevious MonthADVANCE MONTHLY SALESData adjusted for seasonal variation and holiday and trading-day differences but not forprice changes.20May 2021 620.2 billion-1.3%April 2021(revised) 628.7 billion0.9%151050Next release: July 16, 2021* The 90 percent confidence interval includes zero. There is insufficient statisticalevidence to conclude that the actual change is different from zero.Data adjusted for seasonal variation and holiday and trading-day differences butnot for price changes. Source: U.S. Census Bureau, Advanced Monthly RetailTrade Survey, June 15, 2021-5MarchTotalAprilEx AutoAutoMayGen MerSource: U.S. Census Bureau, Advanced Monthly Retail Trade Survey,June 15, 2021Advance Estimates of U.S. Retail and Food ServicesAdvance estimates of U.S. retail and food services sales for May 2021, adjusted for seasonal variation andholiday and trading-day differences, but not for price changes, were 620.2 billion, a decrease of 1.3%( 0.5 percent) from the previous month, but 28.1 percent ( 0.7 percent) above May 2020. Total sales forthe March 2021 through May 2021 period were up 36.2 percent ( 0.5 percent) from the same period ayear ago. The March 2021 to April 2021 percent change was revised from virtually unchanged ( 0.5percent)* to up 0.9 percent ( 0.2 percent).Retail trade sales were down 1.7 percent ( 0.5 percent) from April 2021, but up 24.4 percent ( 0.7percent) above last year. Clothing and clothing accessories stores were up 200.3 percent ( 2.8 percent)from May 2020, while food services and drinking places were up 70.6 percent ( 3.0 percent) from lastyear.General InformationThe June 2021 Advance Monthly Retail report is scheduled for release on July 16, 2021 at 8:30 a.m. EDT.Data InquiriesEconomic Indicators Division, Retail Indicator us.govMedia InquiriesPublic Information Office301-763-3030pio@census.gov
View the full schedule in the Economic Briefing Room: www.census.gov/economic-indicators/ . The fulltext and tables of this release can be found at www.census.gov/retail/ .EXPLANATORY NOTESThe advance estimates are based on a subsample of the Census Bureau’s full retail and food servicessample. A stratified random sampling method is used to select approximately 5,500 retail and foodservices firms whose sales are then weighted and benchmarked to represent the complete universe ofover three million retail and food services firms.Survey DescriptionThe U.S. Census Bureau conducts the Advance Monthly Retail Trade and Food Services Survey to providean early estimate of monthly sales by kind of business for retail and food service firms located in theUnited States. Each month, questionnaires are mailed to a probability sample of approximately 5,500employer firms selected from the larger Monthly Retail Trade Survey. Advance sales estimates arecomputed using a link relative estimator. For each detailed industry, we compute a ratio of current-toprevious month weighted sales using data from units for which we have obtained usable responses forboth the current and previous month. For each detailed industry, the advance total sales estimates for thecurrent month is computed by multiplying this ratio by the preliminary sales estimate for the previousmonth (derived from the larger MRTS) at the appropriate industry level. Total estimates for broaderindustries are computed as the sum of the detailed industry estimates. The link relative estimate is usedbecause imputation is not performed for most nonrespondents in MARTS. For a limited number ofnonresponding companies that have influential effects on the estimates, sales may be estimated based onhistorical performance of that company. The monthly estimates are benchmarked to the annual surveyestimates from the Annual Retail Trade Survey once available. The estimates are adjusted for seasonalvariation and holiday and trading day differences. Additional information on MARTS and MRTS can befound on the Census Bureau website at: www.census.gov/retail .Reliability of EstimatesBecause the estimates presented in this report are based on a sample survey, they contain sampling errorand nonsampling error.Sampling error is the difference between the estimate and the result that would be obtained from acomplete enumeration of the sampling frame conducted under the same survey conditions. This erroroccurs because only a subset of the entire sampling frame is measured in a sample survey. Standard errorsand coefficients of variation (CV), as given in Table 3 of this report, are estimated measures of samplingvariation.Data InquiriesEconomic Indicators Division, Retail Indicator us.govMedia InquiriesPublic Information Office301-763-3030pio@census.gov
The margin of sampling error, as used on page 1, gives a range about the estimate which is a 90 percentconfidence interval. If, for example, the percent change estimate is 1.2 percent and its estimatedstandard error is 0.9 percent, then the margin of sampling error is 1.753 x 0.9 percent or 1.6 percent,and the 90 percent confidence interval is –0.4 percent to 2.8 percent. If the interval contains 0, then onedoes not have sufficient evidence to conclude at the 90 percent confidence level that the change isdifferent from zero and therefore the change is not statistically significant. Estimated changes shown inthe text are statistically significant unless otherwise noted. For a monthly total, the median estimatedcoefficient of variation is given. The resulting confidence interval is the estimated value 1.753 x CV x (theestimated monthly total). The Census Bureau recommends that individuals using estimates in this reportincorporate this information into their analyses, as sampling error could affect the conclusions drawn fromthe estimates.Nonsampling error encompasses all other factors that contribute to the total error of a sample surveyestimate. This type of error can occur because of nonresponse, insufficient coverage of the universe ofretail businesses, mistakes in the recording and coding of data, and other errors of collection, response,coverage, or processing. Although nonsampling error is not measured directly, the Census Bureau employsquality control procedures throughout the process to minimize this type of error.Weather InformationFor information on the impact of weather events on the compilation of this report, please see theFrequently Asked Questions (FAQs) on our website at: www.census.gov/retail/marts weather faqs.html RESOURCESThe Rest of the Consumer Spending StoryRetail and services together represent what’s commonly referred to as consumer spending. QuarterlyServices Survey (QSS) revenue comprises roughly 2/3 of the personal consumption expenditurescomponent of the U.S. Gross Domestic Product (GDP) measured by the Bureau of Economic Analysis (BEA).The first quarter 2021 Advance Quarterly Services Report will be available on May 20, 2021 at 10:00 AM.Learn about historical revenue trends for certain industries going back 15 years and other data, such as inpatient days and discharges for hospitals, by visiting https://www.census.gov/services/index.html APIThe Census Bureau’s application programming interface lets developers create custom apps to reach newData InquiriesEconomic Indicators Division, Retail Indicator us.govMedia InquiriesPublic Information Office301-763-3030pio@census.gov
users and makes key demographic, socio-economic and housing statistics more accessible than everbefore. www.census.gov/developers/ FRED Mobile AppReceive the latest updates on the nation’s key economic indicators by downloadingthe FRED App https://fred.stlouisfed.org/fred-mobile/ for both Apple andAndroid devices. FRED, the signature database of the Federal Reserve Bank of St.Louis, now incorporates the Census Bureau’s 13 economic indicators.###* The 90 percent confidence interval includes zero. There is insufficient statistical evidence to conclude that the actual change is different from zero.Data InquiriesEconomic Indicators Division, Retail Indicator us.govMedia InquiriesPublic Information Office301-763-3030pio@census.gov
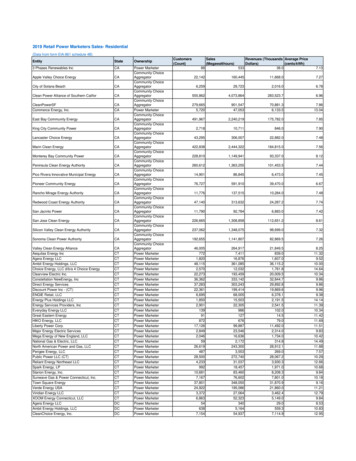
Table 1. Estimated Monthly Sales for Retail and Food Services, by Kind of Business(Total sales estimates are shown in millions of dollars and are based on data from the Advance Monthly Retail Trade Survey, Monthly Retail Trade Survey,and administrative records.)NAICScode1Kind of Business5 Month Total% Chg.20212020Retail & food services,total . . 2,910,841Total (excl. motor vehicle & parts) 2,268,878Total (excl. gasoline stations) 2,693,248Total (excl. motor vehicle & parts &gasoline stations) . 2,051,285Retail . . . 2,603,774GAFO4 . . . . . (*)Not Adjusted2021May 3Apr.(a)(p)Adjusted2020Mar.(r)MayMay .523.6644,362500,451594,146625,636 633,078 504,607 407,227 620,214 628,678 623,119 483,980 409,819481,542 486,171 397,245 337,693 484,235 487,456 487,687 383,125 341,621578,128 586,718 472,562 380,417 573,932 582,732 576,666 454,500 383,68818.723.7(*)450,235573,043(*)434,034 439,811 365,200 310,883 437,953 441,510 441,234 353,645558,417 567,933 462,286 377,210 552,932 562,583 559,871 444,538119,677 126,263 91,042 68,637(*)127,146 129,221 89,051315,490379,89272,2794414411, 4412441114413Motor vehicle & parts dealers . 641,963Auto & other motor veh. dealers . 596,934New car dealers . .(*)Auto parts, acc. & tire stores (*)42.544.6(*)(*)143,911134,218(*)(*)144,094 146,907 107,362134,193 136,709 98,852105,257 107,329 79 141,222 135,432 100,855126,382 131,562 125,883 88(NA)6,81044244214422Furniture & home furn. stores 57,449Furniture stores . .(*)Home furnishings stores . )443Electronics & appliance stores 4,2723,5274444441Building material & garden eq. &supplies dealers . . 198,260Building mat. & sup. dealers 36,14931,53932,18427,85144544514453Food & beverage stores . 358,089Grocery stores . . 320,214Beer, wine & liquor stores 71465,9315,74972,04865,0335,28144644611Health & personal care stores . 155,269Pharmacies & drug stores 26,25123,64825,95823,838447Gasoline stations . 94646,45329,48026,131448Clothing & clothing accessoriesstores . . . 106,2424481144812448144482Men's clothing stores Women's clothing stores . Family clothing stores Shoe stores . NA)3,463138986(NA)1,57177450(NA)455451Sporting goods, hobby, musicalinstrument, & book stores 450,75545299General merchandise stores . 318,647Department stores . 48,279Other general merch. stores . . (*)Warehouse clubs &supercenters . .(*)All oth. gen. merch. stores ,4057,350453Miscellaneous store retailers . 13,7468,8157,3614544541Nonstore retailers . . 409,669Elect. shopping & m/o houses . 81,49475,42476,62970,809722Food services & drinking places . 09563,24839,44229,927(*) Advance estimates are not available for this kind of business.(NA) Not available(a) Advance estimate(p) Preliminary estimate(r) Revised estimate(S) Estimate does not meet publication standards because of high sampling variability (coefficient of variation is greater than 30%), poor response quality(total quantity response rate is less than 50%), or other concerns about the estimate's quality.(1) For a full description of the NAICS codes used in this table, see https://www.census.gov/naics/(2) Estimates are concurrently adjusted for seasonal variation and for holiday and trading day differences, but not for price changes. Concurrent seasonal adjustmentuses all available unadjusted estimates as input to the X‐13ARIMA‐SEATS program. The factors derived from the program are used in calculating all seasonallyadjusted estimates shown in
the 2019 Annual Retail Trade Survey and Service Annual Survey and the results of the 2017 Economic Census. The Annual Revision of Monthly Retail and Food