Transcription
INTRODUCTION:BASIC GEOGRAPHIC CONCEPTSEric JessupAssociate ProfessorSchool of Economic SciencesSeptember 13, 2010
Outline What is geographical / spatial analysis and why do we care ? Different types of geographic data VectorRasterTopological GIS Terms / Definitions Coordinate Systems ? Geographic Coordinate SystemsProjected Coordinate SystemsMinimizing DistortionCommon File Types:
Where ever you are .that’s whereyou’ll be .
The GeographicalIntersection of Information
How knowledge is obtained .InformationGeographicalVector Data(Points, Lines, Areas)Raster riptiveAttributes
Why should you care?The most powerful analytical tool at your disposal!
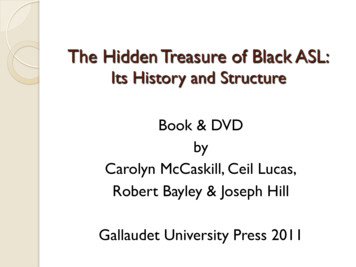
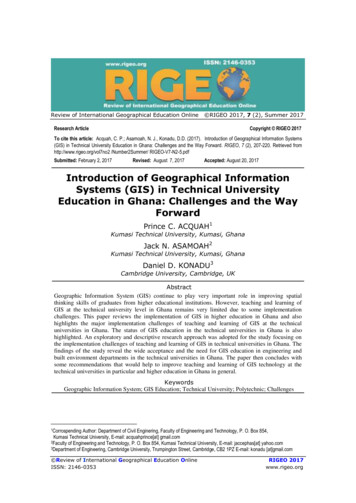
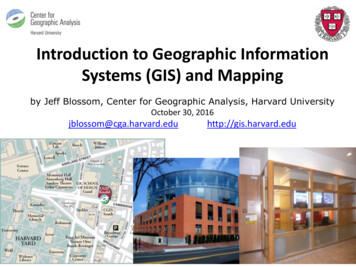
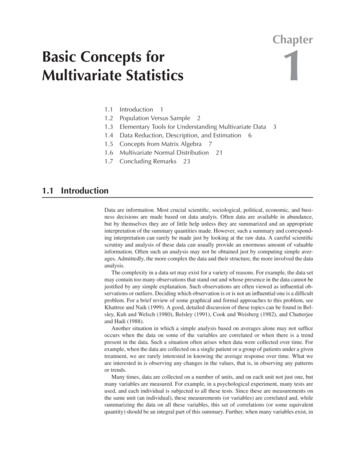
Data TypesVector Data:A vector is made up of three different types of elements:1) nodes, which are single sets of coordinates (x, y, z) which define a point (such as aspring);2) lines, which are curvilinear strings of coordinates which define a curved line (suchas a stream); and3) polygons, which are collections of lines which inscribe an area (such as a lake).Raster Data:A data structure (logically, a 2-dimensional array) that contains rows and columns ofnumbers of a single data type. Each number represents the value of some parameter(like elevation or red spectral intensity). Each number (or cell value) is often used tocontrol the color and intensity of one pixel on a computer’s display screen. A completecomputer image can be displayed from the values in a raster that has as many rowsand columns as the computer has pixels for the screen.
Vector Data
Raster Data
Topological DataA description of the relationship between node, line, and polygon elements from vector data. Usuallydescribing the intersection of two or more topologically coded data sets that produces one data set that isuniformly topologically coded with respect to graphic entities and to attribute dataLineA level of spatial measurement referring to a one-dimensional defined object having a length anddirection and connecting at least two points. Examples are roads, railroads, telecommunication lines,streams, etc.NodeA single point defined by a set of coordinates in space, and one of the types of elements in a vectorobject. Nodes may be lone points, or may occur as the terminal point at the end of one or more lineelements.PolygonA two-dimensional figure with three or more sides intersecting at a like number of points. In GIS systems,an area.
GIS Terms/DefinitionsGeocodingProcess of assigning alphanumeric locational identifiers (such as the municipaladdress or physical location) to spatially related information. For example, anaddress may be matched to an address range on a street segment, or a givenspatial area (i.e., the limits of a polygon, a line segment, a point along thesegment, or an absolute point that has been coordinated). The process implies ageographic base file which can be used to pass addresses in order to find outcharacteristics about the geometry.CAD - Computer Aided Drafting/Design/Drawing.CAD is used for computerized drafting. Many CAD systems also provide moreadvanced features like solid modeling and simulation. CAD generally lackstopology of objects and direct links to an attribute database, which are essentialfeatures in GIS modeling and analysis operations.
GIS Terms/DefinitionsCadastral MappingA mapping endeavor with ownership and value being the primary concerns.Principal usage is for tax analysis.Cardinal directionThe four principal directions: North, South, East and West.Cartesian coordinatesA coordinate system in which the locations of points in space are expressed byreference to three perpendicular axes, called the coordinate axes (x,y,z).Coordinate SystemsA particular kind of reference frame or system, such as plane rectangularcoordinates or spherical coordinates, which use linear or angular quantities todesignate the position of points within that particular reference frame or system.
GIS Terms/DefinitionsPlane coordinatesCoordinates specifying the locations of points in a plane. In cartography the planeusually is a projection of the Earth’s surface onto a flattened cone or cylinder, andthe x and y values scaled along the rectangular axes are called eastings andnorthings, respectively.Euclidean distanceThe shortest distance joining two points in the planeJoinA process of connecting two or more separately digitized maps
GIS Terms/DefinitionsLabelA vector element that contains text used to identify a node, line, or polygonelement.LayerRefers to the various overlays of data, each of which normally deals with onethematic topic. These overlays are registered to each other by the commoncoordinate system of the database.LegendThe part of the drawn map explaining the meaning of the symbols used to codethe depicted geographical elements.
GIS Terms/DefinitionsMap scaleThe relationship that exists between a distance on a map and thecorresponding distance on the Earth. It may be expressed as anequivalence, one inch equals 16 statute miles; as a fraction or ratio,1:1,000,000; or as a bar graph subdivided to show the distance that eachof its parts represents on the Earth.Network analysisAnalytical techniques concerned with the relationships between locations ona network, such as the calculation of optimal routes through road networks,capacities of network systems, best location for facilities along networks, etc.http://resources.arcgis.com/glossary
Coordinate SystemsObservations about Earth It isn’t flat, perfectly round or two dimensionalIt’s a sphereGeographic Coordinate SystemProjected Coordinate System
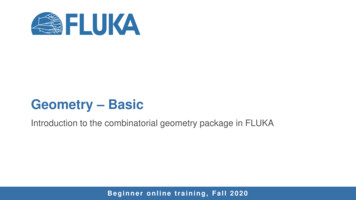
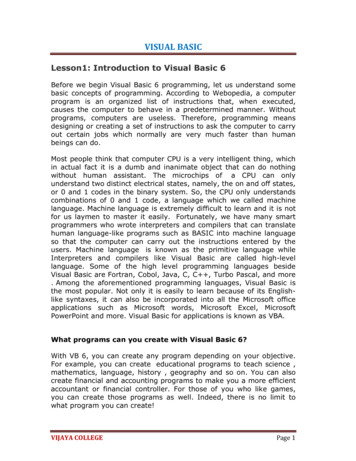
Geographic Coordinate System Uses degrees of longitude (x), latitude (y) andsometimes height (z) to describe a precise location onthe earth. The latitude reference is the equator and each hemisphereis divided into 90 sections, each representing one degree oflatitude The longitude reference is the prime meridian, runningperpendicular to the equator from the North Pole to theSouth Pole.
Geographic Coordinate System
Coordinate Systems
Geographic Coordinate System In order to achieve an acceptable degree ofaccuracy, degrees are divided into minutes andseconds. 1degree 60 minutes 1 minutes 60 seconds 3600 seconds in a degree So at the equator, one 1 second of latitude and 1second of longitude is equal to 30.87624 meters
Geographic Coordinate SystemDegrees of latitude and longitude can be further subdivided into minutes and seconds:there are 60 minutes (') per degree, and 60 seconds (") per minute. For example, acoordinate might be written 65 32' 15". Degrees can also be expressed as decimals:65.5375, degrees and decimal minutes: 65 32.25', or even degrees, minutes, anddecimal seconds: 65 32' 15.275". All these notations allow us to locate places on theEarth quite precisely – to within inches.A degree of latitude is approximately 69 miles, and a minute of latitude is approximately1.15 miles. A second of latitude is approximately 0.02 miles, or just over 100 feet.A degree of longitude varies in size. At the equator, it is approximately 69 miles, the samesize as a degree of latitude. The size gradually decreases to zero as the meridiansconverge at the poles. At a latitude of 45 degrees, a degree of longitude isapproximately 49 miles. Because a degree of longitude varies in size, minutes and secondsof longitude also vary, decreasing in size towards the poles.
Projected Coordinate System Projected coordinate systems portray the earth in a two-dimensional flatsurface (paper or computer screen).To more accurately represent locations on the earth's surface, map makersstudied the shape of the earth (geodesy) and created the concept of thespheroid.A datum links a spheroid to a particular portion of the earth's surface.Recent datums are designed to fit the entire earth's surface well.The most commonly used datums in North America are: NAD 1927 (North American Datum 1927) using the Clarke 1866 spheroidNAD 1983 (North American Datum 1983) using the GRS 1980 spheroidWGS 1984 (World Geodetic System 1984) using the WGS 1984 spheroid
Projection Families
Geographic Distortion Every projection has some degree of distortion on: Angle Distance Area The goal is to minimize the distortion based thespecific spatial analysis performed.
Minimizing Distortion Minimize All Aspects: Winkel Triple Projection Robinson ProjectionMinimize Angular Distortion (Conformal or Orthomorphic Projections): Mercator Projection Lambert Conformal Conic Projection
Minimizing Distortion Minimize Distance Distortion (Equidistant Projections) Plate Carree Equidistant Cylindrical Projection Equirectangular Projection Azimuthal Equidistant ProjectionMinimize Area Distortion (Equal Area Projections) Lambert’s Equal Area Projection Mollweide Equal Area Cylindrical Projection
Common File TypesDocument typeFilenameextensionNotesA file containing a map, its layers, display information, and other elements used inArcMap.A file containing a globe, its layers, and 3D display properties for use in ArcGlobe.Part of the 3D Analyst extension.A file containing a 3D scene, its layers, and 3D properties for use in ArcScene. Part ofthe 3D Analyst extension.A layer is a set of rules for displaying and working with datasets in ArcMap andArcGlobe. Layer definitions include symbol assignments, classifications, labeling rules,and other map use properties.A file used for storing the geometric location and attribute information of geographicfeatures.ArcMap document.mxdArcGlobe document.3ddArcScene document.sxdArcGIS Layer file.lyrShapefile.shpPublished Map File for ArcReader.pmfA read-only map file created using the ArcGIS Publisher extension. Read-only mapscan be used in ArcReader and ArcMap. They can also be served on the Web.ArcGIS Style file.styleA predefined set of colors, symbols, and graphical elements used for displaying andrepresenting geographic datasets according to a mapping standard.ArcGIS Address Locator file.locA Locator dataset and rules used for geocoding addresses in ArcGIS. Locators aretypes of geodatabase datasets and can be saved independently of the geodatabaseas a disk file for sharing and useMetadata files.xmlMetadata documents for individual file-based datasets are stored in XML files andoften managed in ArcGIS workspace folders.Map projection file.prj.py.amlGeoprocessing scriptsCoordinate system and map projection information for a datasetPython (.py) and ArcInfo Workstation AML scripts used for geoprocessing in ArcGIS
cInfo Workstation coveragesGridArcInfo GRID raster formatTinArcInfo triangulated irregular network (TIN) formatShapefile (SHP)ESRI shapefile formatTIGER/LineU.S. Census Bureau's TIGER/Line FilesMIF/MIDMapInfo Vector Interchange FileMapInfo Table Interchange for MIFTABMapInfo Native DatasetVPFNational Geospatial Intelligence Agency's Vector Product File formatGMLOpen Geospatial Consortium's GML Interchange SpecificationIMGLeica ERDAS Imagine image filesBMPBitmap raster formatTIFTIFF raster formatJPGJPEG raster compression formatJP2JPEG 2000 raster formatSIDMrSID raster format
TypeCADTablesExtensionDescriptionDXFCAD transfer file. Uses ASCII or binary drawing file interchange.DGNMicroStation design file formatDWGAutoCAD drawing file formatXLSExcel spreadsheetsDBFdBase data file formatInfoArc/Info Workstation INFO tablesMDBFile format for Microsoft's Access databaseTXTText file often used to hold attribute columns delimited by commas ortabs
The part of the drawn map explaining the meaning of the symbols used to code the depicted geographical elements. GIS Terms/Definitions. Map scale . Uses ASCII or binary drawing file interchange. DGN MicroStation design file format DWG AutoCAD drawing file format Tables XLS Excel spreadsheets