Transcription
Fertility Theories: Can They Explain theNegative Fertility-Income Relationship? Larry E. JonesUniversity of Minnesota, Federal Reserve Bank of Minneapolis, and NBERAlice SchoonbroodtMichèle TertiltUniversity of SouthamptonStanford University, NBER and CEPRJune 2008AbstractIn this chapter we revisit the relationship between income and fertility.There is overwhelming empirical evidence that fertility is negatively relatedto income in most countries at most times. Several theories have been proposed in the literature to explain this somewhat puzzling fact. The mostcommon one is based on the opportunity cost of time being higher for individuals with higher earnings. Alternatively, people might differ in theirdesire to procreate and accordingly some people invest more in children andless in market-specific human capital and thus have lower earnings. We revisit these and other possible explanations. We find that these theories arenot as robust as is commonly believed. That is, several special assumptionsare needed to generate the negative relationship. Not all assumptions areequally plausible. Such findings will be useful to distinguish alternative theories. We conclude that further research along these lines is needed. We thank Todd Schoellman, John Knowles, and the participants at the NBER pre-conferencein Boston, the Stanford Junior Faculty Bag Lunch, and the Economics and Demography conference in Napa California for helpful suggestions. We thank Amalia Miller in particular fora thoughtful discussion. Financial support by the NSF (grants SES-0519324 and SES-0452473)and the Stanford Institute for Economic Policy Research (SIEPR) is greatly appreciated. WilliamG. Woolston provided excellent research assistance. Part of this research was completed whileMichèle Tertilt was a National Fellow at the Hoover Institution at Stanford.1
Contents1 Introduction32 Data on Fertility and Income63 Basic Framework and Results113.1 The Basic Model . . . . . . . . . . . . . . . . . . . . . . . . . . . . . . 123.2 The Price of Time Theory . . . . . . . . . . . . . . . . . . . . . . . . . 154 Endogenous Wage Differences184.14.24.3Exogenous Fertility and Endogenous Wages . . . . . . . . . . . . . 19Endogenous Fertility and Endogenous Wages . . . . . . . . . . . . . 20An Aside on Wages vs. Income . . . . . . . . . . . . . . . . . . . . . 234.44.5Empirical Evidence and Related Work . . . . . . . . . . . . . . . . . 23Outlook . . . . . . . . . . . . . . . . . . . . . . . . . . . . . . . . . . . 265 Quantity-Quality Theory5.15.226A Simple Example . . . . . . . . . . . . . . . . . . . . . . . . . . . . 28The Quality Production Function. . . . . . . . . . . . . . . . . . . . . 306 Married Couples and the Female Time Allocation Hypothesis346.1 Empirical Findings . . . . . . . . . . . . . . . . . . . . . . . . . . . . 356.2Theory . . . . . . . . . . . . . . . . . . . . . . . . . . . . . . . . . . . 377 Nannies467.1 An Example with Ability Heterogeneity . . . . . . . . . . . . . . . . 467.2 A Working Example with Preference Heterogeneity . . . . . . . . . 488 Time Series Implications529 Conclusion57A Appendix61A.1 Adding Parental Altruism . . . . . . . . . . . . . . . . . . . . . . . . 61A.2 A Dynamic Version of the Endogenous Wage Example . . . . . . . 65A.3 Summary of Findings for Couples’ Models . . . . . . . . . . . . . . 662
1 IntroductionEmpirical studies find a clear negative relationship between income, or wages,and fertility. This finding has been confirmed across time and for different countries. For example, Jones and Tertilt (2008) document a negative cross-sectionalrelationship between income and fertility in the United States and find that the relationship has been surprisingly stable over time. In particular, the paper showsa negative relationship for 30 birth cohorts between 1830 and 1960, with the income elasticity of fertility remaining roughly constant at about -0.30.1Why do richer people have fewer children, and what explains the relativelytime-invariant nature of the relationship? The negative correlation is particularlypuzzling if one thinks about children as a consumption good, unless one believesthat children are an inferior good. An early discussion of this fact appears in theseminal article on fertility choice by Becker (1960). Indeed, this puzzling correlation was a main impetus behind Becker’s early work.2 The ensuing literaturecan be roughly divided into two strands. One attacks the question from a theoretical point of view and finds that, properly interpreted or with the appropriateadditions in choice variables, economic theory says that fertility should be negatively related to income. The basic idea is that the price of children is largelytime, and because of this, children are more expensive for parents with higherwages. Another argument is that higher-wage people have a higher demand forchild quality, making quantity more costly, and hence those parents want fewerchildren. The other strand of literature attacks the question from an empiricalpoint of view, arguing that the negative relationship is mainly a statistical fluke—due to a missing variables problem. This literature focuses on identifying thosecrucial missing variables, such as female earnings potential. Once those miss1We discuss the empirical evidence in more detail in Section 2.Quoting from Becker (1960), (p. 217): “Having set out the formal analysis and frameworksuggested by economic theory, we now investigate its usefulness in the study of fertility patterns.It suggests that a rise in income would increase both the quality and quantity of children desired;the increase in quality being large and the increase in quantity small. The difficulties in separating expenditures on children from general family expenditures notwithstanding, it is evidentthat wealthier families and countries spend much more per child than do poorer families andcountries. The implication with respect to quantity is not so readily confirmed by the raw data.Indeed, most data tend to show a negative relationship between income and fertility.” See alsothe discussion in Hotz, Klerman, and Willis (1993).23
ing variables are controlled for, fertility and income—so the argument goes—areactually positively related.3In this paper, we revisit these theories of the cross-sectional relationship between income and fertility. They are largely based on ability or wage heterogeneity. We also formalize a new theory, based on heterogeneity in the tastefor children, in which wages are also endogenous. For each of the theories, wecatalogue whether they basically never work (i.e., never produce the negativeincome-fertility relation), whether they work only with specific additional assumptions, or whether they are relatively robust to changes in assumptions. Wealso often compare the results to the conditional correlations found in the statistical strand of the literature. For those theories that work sometimes, we try to beas explicit as possible about what kinds of conditions are needed (e.g., curvatureand/or functional form restrictions) to generate a negative relationship betweenincome and fertility. We also show what goes wrong by giving examples abouthow they fail. Finally, of the theories that work and appear robust, we ask formore. Can the theory also match the time series properties of fertility? If so,what exactly does it take? If not, why not? Finally, we want to know whethersuch a theory is consistent with a recursive formulation of dynastic altruism.Our main findings can be summarized as follows:1. (Almost) all theories depend on the assumption that raising children takestime and that this time must be incurred by the parents.2. Theories based on exogenous wage heterogeneity crucially depend on theassumption of a high elasticity of substitution between consumption andchildren.3. Adding a quality choice by itself does not generate a negative fertilityincome relationship. The quantity-quality trade-off works only in conjunction with assumptions similar to those needed in (2).4. Theories based on heterogeneity in tastes for children are able to generate anegative fertility-income relationship without requiring a high elasticity ofsubstitution between consumption and children.3See Hotz, Klerman, and Willis (1993) for a survey. An early literature review on fertilitychoice is Bagozzi and Van Loo (1978).4
5. Theories that explicitly distinguish between fathers and mothers are verysimilar to one-parent theories. However, to get fertility to be decreasing inmen’s income, one needs to assume that there is positive assortative matching of spouses.6. Several of the theories that match the cross-sectional patterns of fertilityalso match, at least loosely, some of the broad time series trends in fertility. Theories based on wage heterogeneity produce this relationship morenaturally.7. Extending the models that are successful at matching the cross-sectionalproperties of fertility choice to fully dynamic models based on parental altruism is very challenging. Basic theories with wage heterogeneity do notappear to be robust to this extension. Theories based on heterogeneity intastes are more promising, but leave many open questions.Our findings may be relevant in several different contexts. First, there hasbeen a recent increase in research relating the demographic transition and economic development among macroeconomists.4 Similarly, several recent contributions try to understand why fertility is higher in poor countries than in richones.5 Further, there is a recent literature that uses dynamic macro-style modelsto analyze the interplay between fertility, labor force participation, marriage, andinequality6 —including studies of gender wage gap7 and the baby boom following World War II.8 Often dynamic macro-style models are used to analyze the impacts of various policy changes—for example, parental leave policies, the impact4See, for example, Becker, Murphy, and Tamura (1990), Galor and Weil (1996), Galor andWeil (1999), Galor and Weil (2000), Greenwood and Seshadri (2002), Hansen and Prescott (2002),Boldrin and Jones (2002), Doepke (2004, 2005), Greenwood, Seshadri, and Vandenbroucke (2005),Moav (2005), Tertilt (2005), Jones and Schoonbroodt (2007b), Murtin (2007) and Bar and Leukhina(2007). See Galor (2005a) and Galor (2005b) for an extensive analysis and a critical survey oftheories of the demographic transition.5See Manuelli and Seshadri (2007).6See Alvarez (1999), Caucutt, Guner, and Knowles (2002), and Falcao and Soares (2007).7See Erosa, Fuster, and Restuccia (2005b).8See Greenwood, Seshadri, and Vandenbroucke (2005), Doepke, Hazan, and Maoz (2007),and Jones and Schoonbroodt (2007a).5
of tax reform, welfare reform, social security.9 Typically, they use an “off-theshelf” fertility model as one of their building blocks, and need to make a carefuldecision about which one to use. What may help guide this choice is an informedunderstanding of the implications of the models for the fertility-income relationship in the cross section. Because of this, it is natural to use successful models ofthe cross sectional properties of fertility as a way to inform that choice.This is easier said than done, however. Economists have been developing andtesting theories of fertility ever since Gary Becker’s seminal paper, but still thereis no full consensus on the motivations behind fertility choices. Here, we providea systematic comparison of the properties of various fertility theories. We hopethat this catalogue may be a useful step towards finding a consensus.This paper is organized as follows. In the next section, we summarize theempirical evidence on the fertility-income relationship. Section 3 describes a basic model with wage heterogeneity. Section 4 develops a new theory based onpreference heterogeneity in the desire to have children which generates endogenous wage heterogeneity. Section 5 adds quality to the basic model. In Section 6we depart from the simplest framework and analyze more realistic theories withtwo parents. We investigate whether theories are robust to allowing parents tohire nannies in Section 7. Section 8 pushes several of the working theories toalso address the secular decline in fertility, while Section 9 concludes. The Appendix analyzes the extent to which our results apply to a dynastic formulationof fertility.2 Data on Fertility and IncomeA robust fact about fertility is that it is decreasing in income. This fact has beendocumented from a time-series point of view, across countries, and across individuals. Quoting from Becker (1960) (p. 217): “Indeed, most data tend to showa negative relationship between income and fertility. This is true of the Censusdata for 1910, 1940 and 1950, where income is represented by father’s occupation,9Recent contributions include Aiyagari, Greenwood, and Guner (2000), Erosa, Fuster, andRestuccia (2005a), Fernandez, Guner, and Knowles (2005), Greenwood, Guner, and Knowles(2003), Sylvester (2007), and Zhao (2008).6
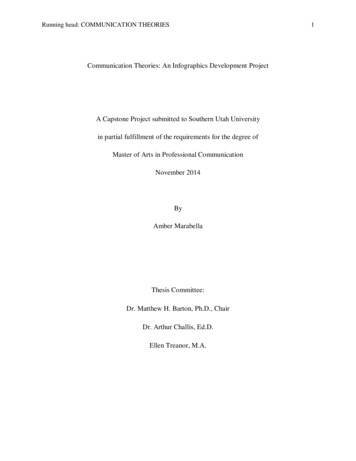
mother’s education or monthly rental; the data from the Indianapolis survey,the data for nineteenth century Providence families, and several other studies aswell.”10Figure1: FertilityIncomeinin2000DollarsFigure3: CEBbyvs.OccupationalOccupational Income2000Dollars6.5Birth Cohort6.01828184818681888190819281948Children ever 2.52.01.5020,00040,00060,00080,000Occupational Income in 2000 DollarsSource: Jones and Tertilt (2008)In a recent study, Jones and Tertilt (2008) use U. S. Census Data on lifetimefertility and occupations to document this negative cross-sectional relationshipin the United States.11 They find a robust negative cross-sectional relationshipbetween husband’s income12 and fertility for all cohorts for which data is avail10The studies Becker is referring to are U.S. Census (1945), U.S. Census (1955), Whelpton andKiser (1951), and Jaffe (1940).11Income is based on the median annual income for a given occupation in 1950 and adjustedfor TFP growth. A measure of income based on occupation is a better measure of lifetime incomethan income in any particular year. See Ruggles, Sobek, Alexander, Fitch, Goeken, Hall, King,and Ronnander (2004) for a description of how occupational income scores (OIS) are constructedas well as its robustness as a proxy for income. See Jones and Tertilt (2008) for a description ofhow the OIS was converted into 2000 dollars.12The focus on husband’s income allows a consistent analysis over time. In particular, it allowsthe analysis of periods for which data on wife’s income is practically nonexistent.7
able, that is for women born between 1826 and 1960.13 Not only are the correlations always negative, but also they are surprisingly similar in magnitude overtime. Figure 1, reproduced from their paper, shows this very clearly. While therelationship is not perfect, it seems that most of the fertility decline over time canbe “explained” by rising incomes alone, at least in a statistical sense.To give a sense of the magnitudes, Table 1 reproduces some of the most relevant numbers from Jones and Tertilt (2008). For a selected number of birth cohorts, the table displays average husband’s income and average fertility.14 Toquantify the fertility-income relationship, two different empirical measures wereconstructed: the income elasticity of fertility, and the fertility gap between the topand bottom 50 percent of the income distribution. The income elasticity roughlyhovers around minus one-third, meaning that for a family with an income that is10% higher than another family, the number of children is about 3% lower. Thisis a large difference. For example, for women born during the 19th century, thosein the bottom half of the income distribution had easily one child more on average than those in the top half. Today, the difference is is much smaller in absolutenumbers, with a fertility gap of roughly a quarter of a child. But since fertilityis significantly lower for all women, the income elasticity has declined only verymildly over time, to about -0.20 for the most recent cohorts.Note that the income measure used in Figure 1 and Table 1 is based on occupations, and can also be viewed as a proxy for wages. Therefore, the findings canbe interpreted as showing a negative fertility-wage relationship.Many other studies have documented this kind of relationship, typically fora specific geographic area at a particular point in time. For example, Borg (1989)finds a negative relationship using panel data from South Korea in 1976, and13Fertility is measured as children ever born (CEB) to the current wife. Of course, this measurecould differ from male completed fertility if men had children with different women. Unfortunately not much data on male completed fertility are available. We are aware of two exceptions.First, the 2002 National Survey of Family Growth asked men and women independently abouttheir fertility. Preston and Sten (2008) use this data to construct a measure of the elasticity ofmale fertility to male education and also find a negative coefficient. Given that divorce was rarefor most of the period under consideration, we believe that the wife’s fertility is a good proxy.Second, Shiue (2008) compiled Chinese data from 1300 to 1850. She finds a weak positive relationship between male fertility and social status, but since richer men also had more women onaverage, fertility per wife is actually decreasing.14The definitions of fertility and income in the table are identical to those used in Figure 1.8
Birth CohortIncome top/bottomelasticity fertility 20.23Source: Jones and Tertilt 02.593.113.012.221.80Annual incomeNumber ofin 2000 Dollar 21054,51771,517Table 1: Fertility-Income Relationship for 14 U.S. Cross SectionsDocquier (2004) documents a similar relationship for the U.S. using data fromthe PSID in 1994. Westoff (1954) finds a negative relationship between fertilityand occupational status for the years 1900-1952 using U.S. Census data.Part of the literature argues that a negative income-fertility relationship is primarily a statistical fluke—i.e., that it is due to a problem of missing variables. Theidea is that once enough variables are controlled for, one would actually find apositive income-fertility relation. Indeed, this was Becker’s original view on thetopic. He went into great detail focusing on knowledge of the proper use of contraceptives as the important missing variable.15 Similarly, many authors haveargued that a distinction between male and female income is crucial and that therelationship between male income and fertility is indeed (weakly) positive onceone correctly controls for female income.16 Authors of studies that find a positive15He showed that, in his sample, in those households that were actively engaged in familyplanning, fertility and income were positively related while the opposite was true for familiesnot engaged in family planning. Other early papers along this line are cited by Becker in hisoriginal piece. They include Edin and Hutchinson (1935) and Banks (1955).16Empirical studies distinguishing explicitly between husbands and wives include Cho (1968),Fleischer and Rhodes (1979), Freedman and Thorton (1982), Schultz (1986), Heckman and Walker(1990), Merrigan and Pierre (1998), Blau and van der Klaauw (2007), and Jones and Tertilt (2008).9
relationship after controlling for women’s wages, often interpret such finding ashaving resolved the “puzzle.” This is, however, not necessarily the case. Thereason is that even though the finding reconciles the conditional correlations inthe data with the simplest model of fertility, the question remains of what kindof theories would explain the unconditional negative correlation of men’s wagesand fertility. At the very least it requires some assumptions about matching.17In this paper we take a somewhat different approach: rather than controlling forimportant factors (such as wives’ wages) in the data, we try to add such important factors into the model and then ask whether the augmented model deliversthe same qualitative facts as the data does.It is sometimes argued that early on in the development process, a positiverelationship between income and fertility existed.18 Most of the studies that document such a positive relationship are set in agrarian economies, and often income is proxied by farm size. Examples include Simon (1977, chapter 16), whodocuments a positive relationship between farm size in hectares and the averagenumbers of children born for rural areas in Poland in 1948, and Clark and Hamilton (2006), who document a positive relationship between occupational statusand the number of surviving children in England in the late 16th and early 17thcentury (see also Clark (2005) and Clark (2007)). Weir (1995) finds a weakly positive relationship between economic status and fertility in 18th century France,while Wrigley (1961) and Haines (1976) document higher fertility in the coal mining areas of France and Prussia than in surrounding agricultural areas during theend of the 19th century. Also, Lee (1987) documents a similar finding using datafrom the U.S. and Canada.19 This body of work suggests that the fundamentalforces determining the demand for children might be different in areas whereagriculture is the primary economic activity.Of course, there is no reason why the fertility-income relationship should notThe findings are mixed.17We discuss this in detail in Section 6.18A more recent version of such a positive relationship is that U.S. fertility is higher than mostother countries in the OECD even though U.S. income is higher. This does not hold for a largerset of countries, however. See Ahn and Mira (2002) and Manuelli and Seshadri (2007) for a discussion of related points. Bongaarts (2003) finds a slight U-shaped fertility-education relationshipin Portugal and Greece using three education levels of women. The other eight countries concurwith previous findings of a strictly negative relationship.19See also the papers cited in Lee (1987).10
change over time or vary in different cross sections. It may be that in some subgroups of the population, fertility increases in income once all other relevant correlates are controlled for, while in other subgroups the primary change acrossthe income distribution is in the price of a child and, because of this, that fertility is lower at higher income levels. And in fact, it is plausible that fertility andwealth were indeed positively related in early agrarian economies, but that thisrelationship was reversed after industrialization.20To sum up, the fact that people with higher lifetime earnings have fewer children seems very robust, at least during the last century and a half in the UnitedStates. Other countries and other episodes display a similar relationship. Inspired by these facts, this paper analyzes which theories of fertility are consistentwith this relationship.3 Basic Framework and ResultsIn this section we introduce notation and explore some basic models of fertilitychoice. The basic examples that we discuss here focus on the roles played by thenature of the cost of children, the sources of family income and the formulationof preferences. We find that the simplest versions of these ideas do not generatea negative relationship between fertility and income. Special assumptions on thenature of costs of children, the utility function, the sources of income and/orthe child quality production function are needed. This it not to say that thesetheories are wrong. Rather, by making explicit the assumptions behind the ideaswe hope to facilitate the testing of the theories and, ultimately, to improve ourunderstanding of fertility decision-making.To keep the analysis tractable, we focus on a static, monoparental set-up. Thisapproach allows for closed form solutions and lets us focus on the basic mechanics behind the results. Obviously, there are many dynamic elements in real worldfertility-decision making, for example, choices about the timing of births, etc. We20For example, Skirbekk (2008) (using a large data set including various world regions overtime) finds that as fertility declines, there is a general shift from a positive to a negative or neutralstatus-fertility relation. Those with high income/wealth or high occupation/social class switchfrom having relatively many to fewer or the same number of children as others. Education,however, depresses fertility for as long as this relation is observed (early 20th century).11
see our basic examples as a way to gain insights into modeling ingredients ofmore complex dynamic models. Clearly, many important features are left outin the simplest example we start with. Some of these features are particularlyimportant and we come back to those in later sections of this paper. One suchelement is that any child necessarily has a father and a mother. In fact, manyauthors have emphasized that it may be female time rather than male time that isimportant to generate the negative relationship between fertility and income. Weget back to this in Section 6. In later sections of the paper we extend the model toinclude more dynamic elements including limited forms of human capital/childquality (Sections 4 and 5) and parental altruism (Appendix A).Two more caveats are in order. First, throughout the paper we analyze onlyrational theories of fertility.21 Behavioral concerns might be relevant, especiallyfor teenage child-bearing, but are not considered here. Second, we focus on theories in which children provide direct utility benefits, i.e. children are a consumption good. Note that children are sometimes also viewed as an investment, providing old-age security.22 While the investment motive may have important implications for the fertility-income relationship, this analysis is beyond the scopeof this paper and is left for future research.3.1 The Basic ModelThe general static model of fertility choice that we consider is as follows. People maximize utility subject to a budget constraint, a time constraint, and a childquality production function. People (potentially) derive utility from four different goods: consumption, c, number of children, n, the average quality of children,q, and leisure, ℓ. Producing children takes b0 units of goods and b1 units of time(per child). We let lw denote the time spent working and normalize the total timeendowment to one. The wage per unit of time is denoted by w. In addition to21We also abstract from costs and technologies to prevent births or to inseminate artificially.Several authors have given these issues more thought, and we refer the reader to them (see forexample (Hotz and Miller 1988), Goldin and Katz (2002), Bailey (2006) and Greenwood and Guner(2005)).22Examples include Ehrlich and Lui (1991), Boldrin and Jones (2002) and Boldrin, De Nardi,and Jones (2005). Zhao (2008) uses the Boldrin-Jones framework to jointly address the fertilitydecline and the narrowing of fertility differentials by income in response to changes in socialsecurity.12
labor income, we also allow for non-labor income, y. Finally, child quality isa function of educational child inputs, s (we abstract from direct parental timeinputs into child quality). Thus, the choice problem is as follows:maxc,n,q,e,lws. t.U(c, n, q, ℓ)(1)lw b1 n ℓ 1c (b0 s)n y wlwq f (s)In order to highlight the crucial ingredients to generate a negative income (orwage) to fertility relationship, we distinguish between various combinations ofutility specifications, concept of wealth/income/earnings used, costs of childrenand quality production functions. We now briefly discuss each of these components.Utility: We focus on separable utilities. That is:U(c, n, q, ℓ) uc (c) un (n) uq (q) uℓ (ℓ)1 σxWe consider the CES utility case, ux (x) αx x 1 σx 1 for values of σx 0. Wewill often distinguish three cases: (i) σx 1 (high curvature, low elasticity ofsubstitution), (ii) σx 1 (low curvature, high elasticity of substitution) and (iii)σx 1 corresponding to log utility.23Income/Wealth: We use the following (standard) language: w is the wage, W w y is total wealth, and I wlw is earned income (often also called labor earnings). In most of our examples, there are only two uses of time (working andchild-rearing), in which case earned income is equal to w(1 b1 n). An interesting special case is the case where all income is labor income, y 0 and W w.In several examples, we focus on the fertility-earnings (rather than wage) relationship. In these examples, there is no wage heterogeneity. However, the logicunderlying those examples can easily be generalized to (endogenous) wage het23This utility function has the added advantage that, in some cases, it can be interpreted as theproblem in Bellman’s equation for a Barro-Becker style dynasty with parental altruism. There,the term un (n) is the value function for continuations. This interpretation is only valid for certainchoices of the αn ’s however. See Appendix A for details.13
erogeneity. We do so in Section 4. In this context, the wage will be equal to humancapital, H, and human capital is a function of schooling inputs. For simplicity,we will omit H and say that the wage w is a function of schooling inputs.Costs of Children: We allow for both goods and time costs, denoted by b0 andb1 , respectively. To get starker results, we sometimes shut down one of the twotypes of costs.
Empirical studies find a clear negative relationship between income, or wages, and fertility. This finding has been confirmed across time and for different coun-tries. For example, Jones and Tertilt (2008) document a negative cross-sectional relationship between income and fertility in the United States and find that the re-


![Myanmar 2015-16 Demographic and Health Survey - Key Findings [SR235]](/img/66/sr235.jpg)