Transcription
Chapter 7COMPUTERSComputers provide a way to process researchdata quickly and economically . In this sectionyou will find information on different uses ofcomputers, how to prepare data to be processedby computers, and a guide to the differentchoices one faces in using the computer . Sampleprintouts are given to illustrate the capabilities ofavailable computer program packages .Sometimes researchers avoid using computersbecause of the difficulty presented by technicalterms and equipment . The explanations thatfollow attempt to take the "mystery" out ofcomputers by defining computer-related termsand describing the equipment available .*a-
172Community-Based Research : A Handbook for Native AmericansThe computer can be a useful tool for community-based research for itsability to process data and generate reports . However, you can either saveor waste time and money, depending on the wisdom of your decisionsconcerning its use . This chapter outlines some of the factors to consider inchoosing methods of processing data and specific applications ofcomputer technology .Information collected systematically by such means as survey interviews, needs assessments, questionnaires, and record keeping systems iscalled data . The term data processing refers to the operations performedon data, usually by means of automatic equipment . Today, electronicequipment for the processing of data can vary from an inexpensive calculator to a high speed computer system . The project collecting a hundredor less data items (to be analyzed using descriptive statistical techniques)might well use a programmable calculator for satisfactory and cost effective results . Such calculators are available with ready-to-run statisticalprogram for under 200 (1981) . Calculators can satisfy a multitude of office and accounting needs, thus maximizing the use of program funds . Inmaking the decision to use a computer, you need to consider the thingscomputers can and can't do .Computers Can Process large quantities of information very quicklyPerform statistical operations with great accuracyProcess large quantities of data inexpensively, relative to human laborRetrieve stored information in a selective wayPrint reports according to a specified formatPrint multiple copies of reports at low costComputers Can Not ThinkMake decisions, other than those based on the numerical calculations programmedDraw conclusionsProcess data without accurate, very specific instructionsProcess information with human errorIt is a common practice today to "blame the computer" when things gowrong with paperwork, telephones, traffic lights, and other automatedthings in our lives . The computer, however, is only a machine thatperforms exactly according to instructions . The errors in computerizedtasks are, with very rare exceptions, caused by human mistakes in instructions to them . An old saying among computer users that describes this is,"garbage in , garbage out ." Before undertaking any work with acomputer, the user should be prepared to accept sole responsibility for errors, and possibly some great frustration in the learning process . Once theComputers173basic concepts of computer use and the specific details of a data processingapplication are learned, the computer can serve as a very efficient andcost effective means of data analysis .DATA PREPARATIONThe interpretation of information from an idea to coded data can takemany forms . One of the common fears held about using a computer concerns the taking away of the "human element" in the process . Keeping thehuman element in research depends largely upon the quality andthoroughness of the choices made concerning the representation of dataand the interpretation of results . Planning for the coding of data (representing data according to a set format) and planning for the later analysis(examination of the relationship between the data items) should becompleted before the data collection begins . Otherwise, the researchermay, more than likely, find needed information missing or incompletewhen the time for processing is at hand . Presented below is a discussion ofdifferent types of data and some examples of data preparation forautomated processing by calculator or computer .In designing a research topic, a set of questions is developed . This set ofquestions is then answered for each unit included in the study . That basicunit, or case, can be either a single respondent in a group survey, or a larger unit such as one of several communities being compared . Each ofthese questions answered or measurements taken within each unit in thestudy is called a variable . In other words, the responses or measurementscan vary from unit to unit, but for each case within the unit there will berecorded one value for each of the variables . Two examples of variablesthat might be included in a survey are "age" and "sex ." The value of "age"for a given respondent would be recorded in years ; whereas, the value ofthe variable "sex" would be either male or female . Once values have beenrecorded for the variables, the cases can be compared to determine relationships according to different procedures . Several of these procedureswere discussed in the preceding chapter on statistics . The use of the calculator or a computer can speed these procedures, but the process ofdetermining the questions to be asked (that is, defining the variables), andrecording the values (according to some pre-defined, consistent plan)must occur whether or not a computer is used . There is no computermagic, and the human decision-making that takes place before any dataare collected will largely determine the quality of the outcome .Although the computer can read alphabetic characters and symbols, aswell as numbers, the data are usually represented as numbers for the purposes of calculations . This does not limit the types of data that can be processed by means of a computer to characteristics that can be measuredquantitatively . To summarize some of the concepts introduced in Chapter6, STATISTICS, data which are measurable or do follow a consistent
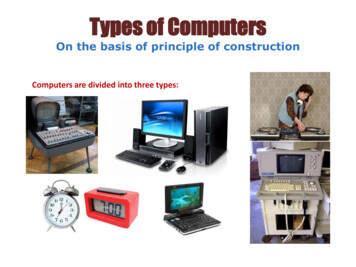
Community-Based Research : A Handbook for Native Americans174progression are described as quantitative . Examples of quantitative variables are "age," "highest grade level completed," and "income ." Datawhich do not follow a measurable, orderly progression, but are more abstract or unordered are described as qualitative . Examples of qualitativevariables are "sex," "area of residence," and "marital status ." Assigningvalues to the possible responses to qualitative variables requires carefulthought and planning . In other words, the different qualities that may beanswers to a particular question must be thought of ahead of time andincluded during the design of the questionnaire, interview form, or otherinstrument, if all possible responses are to be indicated . Categorizing andassigning numbers to the values is a step in preparing the setup for dataprocessing .For the purposes of creating a step-by-step coding example, a few questions will be chosen from an imaginary questionnaire titled, "Urban Adjustment Survey ." The variables are "Respondent Number," "Sex," "Age,"ComputersIn this example, the codes for the variable "Tribe" would be too lengthyto list on the questionnaire and a separate key would be used for codingpurposes . A sample coding key for tribes is presented in Appendix B . Thesmall numbers under the space for responses represent the card columnswhere the information will be punched on computer cards, one digit percolumn . If the punched card method is used, then 80 columns are available per card (96 columns for some newer machines, but most facilitiesstill use the 80 columns) Deciding the card column assignments is knownas defining the fields of data . The system for coding is decided upon by theresearcher prior to the collecting of data . Specific examples of this processare shown in the previous chapter on SURVEY RESEARCH .The following may be useful to you to remember in defining the datafields : A respondent identification number simplifies changing or addinginformation to a case Other identifying information, such as date completed orinterviewer, may be useful in clearing up any later difficulties withthe data Enough digits or spaces are important to allow for the maximum responses (e . g. two digits would allow a recording of 99 maximum,three digits would allow 999)"Marital Status," "Tribe," "Blood Quantum," and "Frequency Speak Native Language ." The data might be collected according to the format below .Figure 7 .1Example of a Questionnaire PageURBAN ADJUSTMENT SURVEYQQQ Respondent1-35 Age4-5LULLSex6Tribe7-9 ,3, Blood Quantum1) Female2) Male101)2)3)4)3Less than 1/41/4 to 1/sOver 1/2 to 3/4Over 3/4 to Full BloodFrequency speak Native language121)2)3)4)5)If more than one 80-column card is required for each case, the cardsshould be numbered (often the last one or two digits of the 80columns are reserved for a card number)Marital Status 111)2)3)4)5)6)Speak only EnglishSpeak mostly EnglishSpeak English and Native language equallySpeak mostly Native languageSpeak only Native language175Never MarriedMarriedWidowedDivorcedSeperatedCommon lawIf more responses are possible than those identified, another category called "other" can be created for a variable (to keep the valueof the information, a space for comments can be created, and thesecomments can be quoted or summarized in the research report)A key is sometimes compiled which defines the fields of data andcorresponding card columns . Such a key may be useful in coding the data,but may not be necessary if the card columns are indicated on the formused for data gathering . In Figure 7 .2, an example of a key defines thefields of data presented earlier in Figure 7 .1 .
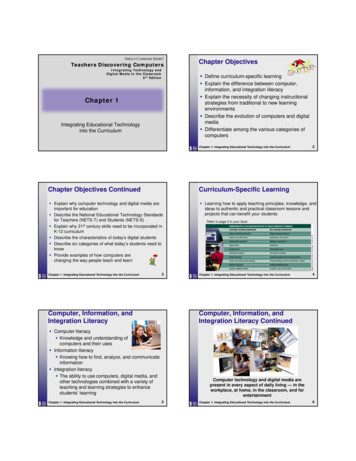
I176Community-Based Research : A Handbook for Native AmericansFigure 7 .2Figure 7 .4Card ColumnRespondentAgeSexTribeBlood QuantumMarital StatusFrequency speakNative language177A card punched with the sample data would appear as follows .Example of a Key Defining Fields of DataVariableComputersPunched Data1111111n1111Il1111 , n , xxxxx a4M w A x xxY xxx xbx ex gxxxxxxx i7 7 7 7 ; 1777771117111171177717171-34-567-91011rt3rlr : :I:Ir :rrrtrr :rrrr :r :r : : : :rrrr : :r :r :rrr : : :rrarrrrrr :r :3 :333 :, : :rrrr :rrrr :33111133313113311113 13 3213333173311 , 4444444444444444444 4444441 1111131 1511!S111115 sS11S1SSSf f1111S1 SS! sS fS1 Sf f1S1 111,1,11111111111 . Ills1i,1r1i11 I11111111111111111111I111111111141 Ulltlllll,11,11,,,,,,,,,,,,,,,,1,,,,,,,121 11 11 I1.fo!!!1 ; !! : : !! a llContinuing the above example, a sample coding form is shown inFigure 7 .3, filled out according to the data recorded above (for one respondent) in the sample questionnaire . Tablets with the card columnsnumbered at the top are readily available . These coding forms help minimize keypunching mistakes and are usually the only data format accept-iin :wxl ivais ;w :.o oU cuu l wievvw :iii iieewiiniiirisrl.iinnniAlthough other mediums are available for recording and storing data,cards are most often used by the first time or small scale computer user .The advantages and disadvantages of the various input and output mediums are discussed in the following section .able to keypunching services .INPUT AND OUTPUTFigure 7 .3Coded Data.&'4ld jat4wC'v1-U P-j MOGIAM9lOO1AMMr1STA11M NT"-Wee IflQ r§Fe .mSI76 91011 17cnnc7Ecriu I 13 14 1316 17I„ oilN1111II 19 20 21 22 23 24 D 26 nIll I33441 1IIH 29 70 31 32 33 3ANIrr73The computer, an information processing machine, simply acceptsinformation or input and gives results or output . This process occursaccording to a set of instructions given by the user . These instructions arecalled programs . Devices for reading input, storing information (massstorage), and generating output are called peripheral equipment . Thisequipment is connected to the central processing unit, or CPU, whichperforms arithmetic operations, directs temporary storage of informationin memory, and controls the functioning of the peripheral units . The diagram in Figure 7 .5 shows a basic computer system .Figure 7 .5iunnMEMORYINPUTOUTPUTPROCESSOR(CPU)MASSSTORAGE1
178Community-Based Research : A Handbook for Native AmericansTo use a computer, you do not need to know the mechanical detailsabout the machine ; however, decisions do need to be made about theperipherals that will be used to input data and output results . Devicesthat input data include punched card readers, mark sense readers (whichdetect pencil marks on pre-printed forms), and terminal keyboards . Examples of output devices that display or write the results are line printers,card punches, plotters, terminal printers and CRT screens . The input devices most commonly chosen by those using the computer for the first timeare punched cards and timesharing terminals (keyboard and CRT terminal display) . Output is commonly printed on line printers . Some of thecommonly used mediums include :"3 c2 EE CVc0VgjPunched cards : Holes punched in a pattern represent numbers, letters,and symbols on a paper card . Data cards are punched by the user or acommercial service, on a keypunch machine for input purposes and thecards that are the result of computer output are prepared automaticallyon a card punch . Machines called verifiers are sometimes used to checkthe ' correctness of the punched data . The type of card used most frequently has 80 columns ; however, IBM introduced in 1970 a card thatcontains 96 columns of data .vo. C) W'4-,!7No1Eb0a nor.o.uw (VC"' x o. EoE ca K ;;y woy040Uac W,.ov V7o?.AAo0Ev Oa . 000 s--e 3ow ' oU U CDc" :, Q4)eda)9) a.a 3 m y40a ooG cno.wC1 U{"Magnetic tape : Data are recorded on magnetic tape as magnetized marks .The recording and reading of data is performed by the same machine, atape drive, which is operated by an employee of the computer center .Magnetic tape is usually 1/2 inch wide (or, more recently, cassettes areused) . It is a very popular medium for storing data for long periods oftime, where cards might be subject to warping or other age problems .Tapes are so inexpensive that the user often purchases and stores the tapeshimself .Cayca aEca 0.0IUCVw-Kc7dt wa0 ed' Em o mcd.wmE eocvAaeAUUAF nUE -'Vy4.cc *'ov 0 r.Eh- ''; ocdTa VAC .Er-- aMagnetic disk : The term used for a stack or pack of round disks, uponwhich data can be recorded as magnetized spots . Access to the data is usually faster than tape, but use charges generally are greater than for tape .This medium is used to store data and programs which are being used frequently, where the user does not want to carry around and constantly reread large card decks .In Figure 7 .6, the advantages and disadvantages of the most commonlyused input, output, and storage mediums are detailed .-Myeao Printers : Typically 14 5/8" wide line printer output with 132 columns ofcharacters across the page and 55 to 60 rows vertically per page . Terminalprinters usually have 8'/Q" wide paper with 72 to 80 characters across thepage .aa v ; w-.0co(D0HAqcc 3c'D Q.w sw 'arcca cre ,IT.Zx A: ""cGWUcooA.V.d04aa,607azwaQ
ComputersoOa'C7Oa.2Ua.a 12.Aa Oc8o03y Ea0)oO CC .ro aa ymv Cdy. bo's oE ;, E-aEm '0(dQa x 4 r-AUa. to-CScd KrZEneC-0 ,Q mW 0 atCN.b(5So ta V Z r.d)A3 wa, A ,oL'O O „Eat cC00O. y 0w C d OuUo. O Z -0 1 '0 aoONZ: co Etyb0Ayy-p y ma .JaXp' Va Eas6 CVo0aw,'. „0. 0 w V cot2Z -5 2 oOA U .aC'rbl)0aCAE0y o rO wUcpAaL i3 acaa0na)oGwo.co acoeUC3 -. 30 ,, Da 0 3., ,.,a v a.c a.EyHU A0oy V aaT's 0y-.ecC4:OwV)w i .GHyt, I4181Once the decision is made as to the desired input and output format, instructions are given to the computer in the form of a computer program,or set of instructions for the processing of data . Fifteen years ago, thosepersons using a computer usually had to learn a computer language inorder to write a program or processing the data and performing calculations . Today many already written or "packaged," programs are availablefor processing data relating to social and economic studies . Some of thesepackages include good operating instructions for the beginning user . Inaddition to performing calculations, these package programs usually labelthe results for clear reporting . With these programs, in addition to simplyproviding coded data, the user must create a set of commands to the program for reading the data, requesting the specific calculations to be performed, and labeling and writing the output . This is much easier thanwriting a program from scratch and generally the diagnostics for detecting errors in the set-ups are very good .PROGRAM PACKAGESProgram packages are highly recommended for the user who needs toprocess data, yet doesn't want to invest large amounts of time required tolearn computer prpgramming . One such package that is readily availableat colleges, universities, and some computer service businesses is theStatistical Package for the Social Sciences . This set of "canned" programswill perform a wide variety of calculations and will label the outputclearly, according to a set of given instructions . The package is wellknown for its excellent documentation and user's guide (see under theauthor, Nie, in Additional Sources) . Some examples of the capabilitiesand kind of report output that is available with SPSS follow .Example 1 : This sample printout, Figure 7 .7, is from the programFREQUENCIES of the Statistical Package for the Social Sciences(SPSS) . The program has labelling capabilities and is particularlyuseful for reporting purposes . In this example, a progress report is beingprinted for the project, "American Indian Center---Urban AdjustmentSurvey ." The variable summarized is "Tribe," with the numbers listedunder "Code" having been defined as representing the tribe labels listedto the left . The absolute frequency is the number of times each tribe islisted in the sample . The relative frequency represents a percentage ofthe total, for each tribe listed . The adjusted frequency refers to thepercentage calculated with missing values excluded . For example, if wehad asked that the value "0" (zero) mean "not certain," this responsewould be calculated excluding the cases having that response . This provides the ability to selectively disregard certain answers in calculatingthe results . The cumulative frequency totals the frequencies, or accumulates the values vertically down the column .
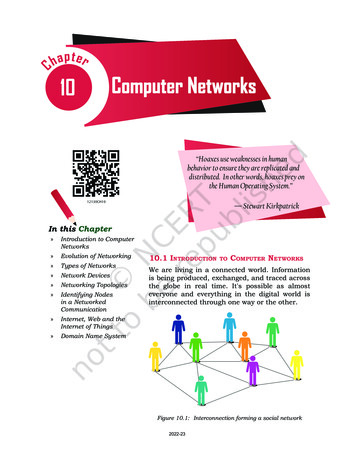
182 Community-Based Research : A Handbook for Native AmericansFigure 7 .7 EXAMPLE OF A FREQUENCES TABULATIONAMERICAN INDIAN CENTER URBAN ADJUSTMENT SURVEYTRTRIBERELATIVEABSOLUTE FREQ(PCT)CODEFREQCATEGORY LABELNOT CERTAIN0.11 .5ALABAMA4.11 .5APACHE8.57 .7CHEYENNE31 .11 .5CHIPPEWA36.46 .2CHOCTAW1 .538.1HOPI23 .164.KICKAPOO76 .11 .5MONO CA106.11 .5NAVAJO4 .6115 .3PAIUTE CA133 .46 .2PIMA144 .23 .1PONCA1 .5146.14.6QUECHAN152 .3SEMINOLE3 .1162 .230 .8SIOUX172 .207 .7UTE192 .54 .6WINNEBAGO3204 .1 .5YAQUI211 .111 .5MISSION219.3.1CREEK2220.11 .5OTHER CALIFORNIA INDIAN221 .TOTAL65100.0Example 2 : This example of a FREQUENCIES output from SPSSillustrates the value of the cumulative frequency calculation . For example, if community planning efforts required information concerningthe educational level of community members, this table would indicatethat 49 .2 % of the sample had completed the 11th grade or less . dF a5 14 0C)0CI000 C) U)0ctncoccooaic00-rAa04 V --(0 V 0t- - .- ., i g-419WF-00to .-icv00yt- V) Vj I o-,I - U,haxVx00 U 0oG UAw"ice C xUx00FUWAtAzUzW6 C6 t-: 066-4-4 ciri 4WUA
184Community-Based Research : A Handbook for Native AmericansExample 3 : This histogram of the variable "Indian Blood Quantum"illustrates on option of the program FREQUENCIES from SPSS . Thistype of visual display of data is useful in research reports to present information in an interesting, as well as descriptive, format .Figure 7 .9 EXAMPLE OF A HISTOGRAMAMERICAN INDIAN CENTERBLDQTURBAN ADJUSTMENT SURVEYBLOOD QUANTUMCODEI0. . (1)I NOT CERTAINI2.I(7)I FOURTH TO HALFI3 .I26)(I OVER HALFI4 .I(I FULL BLOODIIII01020FREQUENCYVALID CASES65I30I40MISSING CASES31)I500Example 4 : This example of output from program CROSSTABS illustrates the type of breakdowns of data that can be obtained anddisplayed . This chart shows a breakdown of the variables "FrequencySpeak Native Language" by "Blood Quantum," illustrating the numberand percentage of responses for "Blood Quantum" for each frequencyinterval represented in the sample .
186Community-Based Research : A Handbook for Native AmericansA minimal setup for SPSS will require the user to define a variablelist (a list of short names for the variables used), labels for the variables(a list of labels to indicate a longer label to be printed out as identification for variables), values for the responses (a list of words describingwhat the numerical responses stand for), an input format (set of instructions indicating which card columns have which variable values),a definition of the input medium (for example, whether the data wouldbe read from cards, tape, or disk file), an indication of the number ofcases to be processed, and an indication of the SPSS program(s) to beused for processing . In Appendix B, an example SPSS setup for thesample Needs Assessment questionnaire presented in Chapter 2 is listedin detail .A WORD ON PROGRAMMING LANGUAGESFor the majority of community projects, program packages can fill dataprocessing needs . For others that require specific applications, thedevelopment of an original program may be necessary . For example,some accounting systems set up with a small home or office computermight require an original program . To learn a programming languageyou will need much study and practice, with the emphasis on practice .Several self-teaching books are listed in the bibliography for this chapter .Here is a brief description of the more common programming languages :Basic(Beginner's All-purpose Symbolic Instruction Code)A simple and straight-forward language, with relatively few rules,which is particularly appropriate for beginners . BASIC is a versatile language which is commonly used for time-sharing systems, medium to thelargest computers as well as mini-and microcomputers . It has unusuallypoor control of printing format .Cobol(Common Business-Oriented Language)This language was originally developed for commercial purposes, andis particularly popular for business and accounting applications . COBOLreads quite like English, yet has more rules than many other languages . Itis more awkward than most for calculations, but excellent control ofprinting format .Fortran (Formula Translator)Although this language was originally developed for mathematicalcapabilities, FORTRAN has become a common language for publishingComputers187social science applications . The arithmetic statements in this language aresimilar to algebraic statements .RPG (Report Program Generator)This language has a specialized function, that of preparing reports . Theinstructions are straightforward and simple, yet specific or formalized .Although mathematical computations are possible, the advantages ofRPG lie with the input and output, or file management and reportwriting features .Other programming languages in common use include PL/1(Programming Language 1) and APL (A Programming Language) . Theselanguages are used more frequently for mathematical applications .Some knowledge of programming is always very useful to the usersetting up an already existing package program, like SPSS . The decision tolearn a computer program depends on the interests of the user, the availability of assistance, the availability of computer resources, and (aboveall) the availability of a large amount of time . The description of severalprogram packages in Figure 7 .11, may be useful in making the decision touse an available package . Another alternative to consider, if you have aspecialized computer application, is that of hiring a computerprogrammer to write the program for you . This may save a great deal oftime and funds in generating a custom program, but will still probablycost much more than use of a packaged program .SummaryThe main advantage of using a computer for data processing relates tothe speed and accuracy at which large amounts of data can be handled .The instructions and methods for examining the data remain the samewhether a pencil, a small calculator, or a large computer is used .Constructing a computer setup and preparing data take time . Some of theadvantages of investing this time are the report writing capabilities andthe speed at which intermediate runs and output can be gained .Particularly with community-based research, the intermediate reports ondata collection progress can be valuable in providing information back toresearchers and to the community before the study is completed . Crosstabulations can be valuable in discovering possible correlations at an earlystage in the project, enabling the researcher and/or advisory committee tofocus on a particular topic if the crosstabs indicate a likely relationship .When progress is reported gradually, advisory committees can trulyprovide advice on redirection or confirm the course of the research .
188Community-Based Research : A Handbook for Native AmericansFigure 7 .11TypeDescriptionBMDStatisticalA package of statistical programs designedfor the use of social science and biomedicaldata, intended for the user familiar withadvanced statistics . Includes programs fordescriptive statistics, linear and nonlinearleast squares, multiple group stepwise discriminant analysis, factor analysis, principal component analysis, time series, univariate and multivariate analysis of variance, and variance component estimation .StatisticalA general purpose system for the statisticalanalysis of social science data, with advantages in processing an unlimited number ofvariables in correlation and factor analysisroutines . Relatively expensive to run, yetmore cost effective than other packageswith large amounts of data AMULUS189PROGRAM PACKAGESNameDATA-TEXTComputersBibliographicPackage for the statistical analysis of timeseries by ordinary least squares and twostage least squares methods, designed forcomputational and data processing requirements encountered in econometericresearch .Designed to process reference collectionsmaintained by researchers . FAMULUScontains programs for editing, sorting,merging, galley printing, indexing, andsearching according to keywords . FAM-NameTypeDescriptionOSIRISStatisticalPackage designed for the analysis of socialscience data, with capabilities includingdata generation, correction and modification of data files, transformation of data,and univariate and multivariate analysisprograms . Other features include uniquestatistical programs which perform multivariate analysis using qualitative data,provisions for handling missingdata,weighting, case selection, and filedocumentation .PSTATStatisticalPackage for the analysis of social sciencedata, including capabilities for stepwise regression, factor analysis, crosstabulation,and multivariate analysis of variance . System is well adapted for time-sharing systems .SASStatisticalCapabilities include transforming or deleting variables or cases, flexible commands for reading, printing, sorting,merging, sorting data, and report writing .Package also has procedures for converting(Statistical AnalysisSystem)SPSS, OSIRIS, BMDP, or DATA-TEXTfiles into files for use with SAS . Adaptedfor time-sharing systems .SOUPACStatisticalThe package of statistical data processingprograms includes populations statistics,analysis, and nonparametric statistics .May be expensive to run .SPSSStatisticalDeveloped for the analysis of social sciencedata, the package includes descriptive statistics, aggregate statistics, crosstabulation,correlation, regression, discriminant analysis, and factor analysis . The package useis designed for those without previous programming experience and the explanationsof statistical procedures in the accompanying manual are excellent .ULUS also allows for the storing and printing of abstracts .MINITABStatisticalGeneral purpose, easy for beginners in statistical and line plotter package .Capabilities include univariate parametricstatistics (standard deviation, t-test, oneway analysis of variance, multiple regression, etc) and nonparametric statistics .Also offers random data generation capabilities, flexible histogram, . and two andthree dimensional plotting routines . Errorscanning & diagnosis is extensive and explicit for beginners .(StatisticalPackage forthe SocialSciences)
190Community-Based Research : A Handbook for Native AmericansComputersWHERE TO GO FOR SERVICESOne of the most available and least expensive sources for computerservices is a college or university . Although some limit service to researchprojects funded through the college, many do accomodate outside users .Costs may be more reasonable because the college does recover somefunds for computer use through student tuition, but one of the mainreasons why this source is recommended is the availability of consultantservices . Most college facilities provide a reasonable amount of consultanttime, free of charge . The billed cost for computer time generally alsoincludes the use of keypunch machines and CRTs and, sometimes, verifiermachines for checking keypunch accuracy . For persons in remote areas,time-sharing computing by telephone connected equipment, can often bepurchased from colleg
computers, how to prepare data to be processed by computers, and a guide to the different choices one faces in using the computer. Sample printouts are given to illustrate the capabilities of available computer program packages. Sometimes researchers avoid using computers because of the difficulty presented by technical terms and equipment.