Transcription
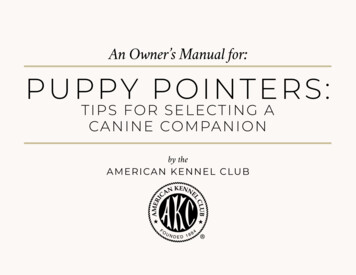
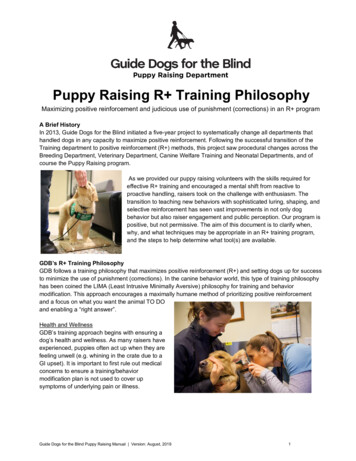
The complete guide toPuppy Growth ChartsFEMALELess than 6.5kgPuppyDog’Growe: th Charts Nampuppy’sallows assessment of theA series of measurementsle line, and growththat there is no ideal centigrowth. Please note12tracks along the sameitthatdedprovialcan be considered normlines) over time.in between two centilecentile line (or ‘channels’MALEs Name:Dog’Predicted adult body weight6.5-9kgD.O.B.Dog’s Name:Neuter Date:DateAge (weeks)Weight (kg)11goal for each puppy.The 50th centile is not thepuppy.is not the goal for eachLikewise, the 99.6th centile tPredicted adult body weighPuppy Growth ChartRecorded bycentiles or a flatin growth beyond twoIncreases or decreasessigns ofing adult weight) are allgrowth line (prior to reaches.rbanc9potential growth distuin a change in direction 99.6th Centile10 98.0th Centilerapid resultingA growth rate that is toocentiles could indicateupwards across multiple.8ing overweight or obesea risk of the puppy becomards acrossa change in direction downwSlow growth resulting in-to-thrive.failureofsignabemultiple centile7 s couldWeight in kg 91.0st Centile75.0th Centile6Vet Contact Details:50.0th Centile525.0th Centile49.0th Centile32.0nd Centile0.4th Centile2WPGC06100-6101520253035Age in Weeks40455055 WALTHAM Centre For60Pet Nutrition
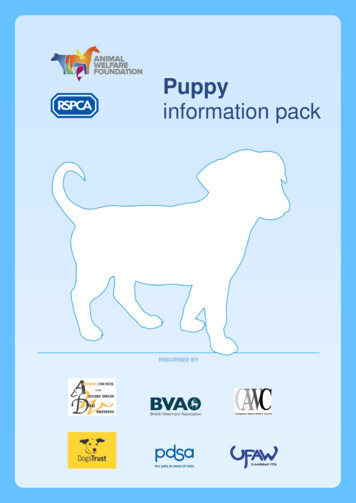
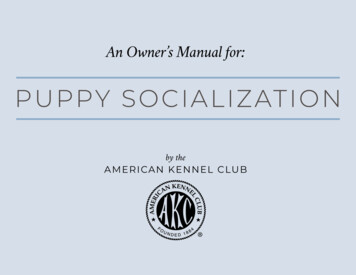
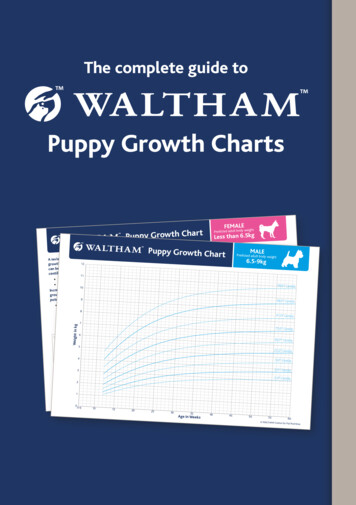
What are the WALTHAM Puppy Growth Charts?How do I use the WALTHAM Puppy Growth Charts?WALTHAM Puppy Growth Charts are a user-friendly clinical tool designed for veterinary professionals to monitorgrowth in dogs. The charts are based on data from 50,000 healthy young dogs and are intended to be a standardfor healthy growth. They have been scientifically developed in a similar manner to charts used to monitor thegrowth of children (e.g. the WHO growth standards), which are used by healthcare professionals around the world.As dogs come in a variety of shapes and sizes there are 10 charts comprising separate charts for male and femaledogs in five size categories, valid for dogs up to a predicted adult weight of 40 kg. Calculate the puppy’s age– The chart plots weights against age in weeks– If you have a WALTHAM Age Wheel, set the first wheel to the date of birth, and the second wheel tothe date of weighing, to see the age in weeks in the window. You can also use the WALTHAM Age App th ChartPuppy GrowD.O.B.DateDog’s Name:Age (weeks)Vet ContactDetails: Weight (kg)not the goal for eachpuppy.7Likewise, the 99.6thcentile is not the goalfor each puppy.Increases or decreasesin growth beyond twocentiles or a flatgrowth line (prior toreaching adult weight)are all signs ofpotential growthCentile ces.99.6thdisturbanRecorded by 10 9Dog’s Name:Dog’s Name:PuppD.O.B.Dog’s Name:y GrowNeuter Date:th CDateAge (weeks)hartWeight PredFEMALE(kg) icted aduRecorded byLess thlt bodyweian 6.5kghtg6A growth rate that istoo rapid resulting ina change in directionupwards across multiplecentiles could indicatea risk of the puppy becomingoverweight or obese.thSlow growth98.0resultingCentilein a change in direction5downwards acrossmultiple centiles couldbe a sign of failure-to-thrive.Vet Contact Details:91.0st Centile8499.6 th Centile75.0th CentileWeight in kg resultthat is too rapid could indicateesA growth ratemultiple centilor obese.upwards acrossing overweightacrosspuppy becomion downwardsa risk of thechange in directrive.resulting in afailure-to-thSlow growthbe a sign ofcouldescentilmultiple6.5-9kg:DateNeuter11 ofgrowth beyoht) are all signsdecreases inIncreases oring adult weig(prior to reach es.growth linee in directionth disturbancing in a changpotential grow of the puppy’sno ideal centile line,can be considered normaland growthprovided that it trackscentile line (or ‘channelsalong the same’ in between two centilelines) over time. The 50th centile isDog’s12Name:Dog’s Name:FEMALEPredicted adult bodyweightLess than 6.5kgMALEA series of measurements allows assessmentgrowth.Please note that therePredicted adult bodyweightist in kggoal fore is not thepuppy.goal for eachThe 50th centile is not the99.6th centilles or a flatLikewise, thend two centi Puppy Growth Chart6.5-9kgWeighy’st of the pupps assessmengrowthurements allow no ideal centile line, and sameA series of measthere iss along thee note that.that it trackgrowth. Pleasal providedlines) over timedered normtwo centilecan be consiin between(or ‘channels’each puppy.centile linePuppy Growth ChartMALEbody weightPredicted adult798.0 th Centile350.0th Centile650.0 th Centile2.0nd Centile25.0 th Centile0.4 Centileth300-6WPGC069.0 th Centile102.0 nd Centile0.4 th Centile152 Plot a weight on the chart– Find the age of the puppy along the bottom of the chart– Find the puppy’s weight along the side, and mark with a small dot75.0 th Centile9.0th Centile14 Choose the right chart– There are 10 charts available to choose from based on the puppy’spredicted adult weight and whether they are male or female91.0 st Centileth25.02 Centile5 Weigh the puppy– When weighing the puppy, remove any items such as a collar, lead or harness or ensurethe puppy is wearing the same collar at every weighing to account for the added weight– Ensure the puppy has all four feet on the scales and note the weight, in kilograms20WPGC1225The science behind the charts30Age in1Weeks3540450500-6101520253035Age in Weeks4045505560 WALT WALTHAM Centre For Pet Nutrition55HAM Centre For PetNutritionWhy should I use WALTHAM Puppy Growth Charts?When it comes to canine weight problems, we know that prevention is better than cure. Healthy weight for lifestarts with healthy growth in puppyhood. However, tracking healthy growth in puppies can be a challenge as itcan be hard to know the correct weight for a puppy or how much weight he/she should be gaining between visitsto the practice. Whilst body condition scoring can provide some guidance as to whether an individual is over- orunderweight, it can be unreliable in puppies and young dogs. Furthermore, once early vaccinations are complete,puppies often do not visit the veterinary clinic again until either neutering or booster vaccination. This means thatthere is a long period during early life when a puppy’s growth is not assessed, and no veterinary guidance is givento owners. This is a crucial period in development, and it is important that the right support is in place to minimisethe chances of problems occurring.The WALTHAM Puppy Growth Charts are the first evidence-based growth standards for pet dogs and have beendeveloped using professionally accepted scientific methods using data derived from 50,000 dogs. The chartsprovide a useful tool to track puppy growth and tailor your advice to build a strong and lasting client bond. Itfacilitates a programme of early-life checks, which present opportunities for the veterinary team to provideguidance on various aspects of preventive healthcare including nutrition, vaccinations, ecto- and endoparasitecontrol and behaviour. It also provides opportunities to identify potential growth issues quickly and implementcorrective measures.Therefore, by using the WALTHAM Puppy Growth Charts, you can provide guidance to owners about puppygrowth including: Providing an owner with reassurance that they are feeding the right amount and type of food Identifying puppies that are growing too quickly and are at risk of becoming overweightWhere did the data come from to create the charts?In order to develop evidence-based growth standards for pet dogs, WALTHAM and collaborators from BanfieldPet Hospitals, University College London and the University of Liverpool analysed bodyweight and age data from50,000 healthy young dogs attending Banfield Pet Hospitals, Mars Petcare’s network of primary care veterinaryclinics across the USA. Data used to construct the charts were derived only from dogs that remained healthy andin ideal body condition for the first three years of their life.Why does it matter that the data were only from healthy dogs?As illnesses in early life have the potential to disturb the pattern of growth it was important to limit the analysisto dogs that were known to have stayed healthy. Furthermore, to ensure that the centile lines on the charts trulyreflect healthy growth, it was important to exclude dogs who were overweight or underweight since these dogsgrow too quickly, and too slowly, respectively. As a result, using the WALTHAM Puppy Growth Charts means thatdogs which are not growing at a healthy rate can be identified and supported.How were the curves on the charts created?Statistical modelling techniques were used to develop the growth curves, which were then displayed graphicallyas a set of centile lines covering the age range 12 weeks to 2 years. The methodology was similar to that used toconstruct the WHO Child Growth Standards and was undertaken in conjunction with colleagues at UniversityCollege London, who have considerable expertise in growth modelling. A large number of growth curves werefirst created for dogs of various breeds; further analysis of similarities and differences amongst these curvesenabled the development of curves for five “size categories” for dogs based on predicted adult bodyweight. Thesecentile curves were then validated by comparing the pattern of growth depicted with growth patterns in differentpopulations of healthy dogs, dogs with abnormal body condition (underweight, overweight and obese), and dogsdiagnosed with conditions associated with accelerated or retarded growth. Identifying puppies that are growing too slowly as this may indicate under-feeding or a growth disorderHow did the curves become the WALTHAM Puppy Growth Charts? Providing a basis on which to recommend changes to a puppy’s nutrition plane.g. increasing or decreasing food if a puppy is growing too slowly or too quicklyThe growth centile curves created during statistical modelling were used as a basis for constructing theWALTHAM Puppy Growth Charts. The design process also involved the development of user-friendly instructionsand a host of supporting materials for training and education. Providing a justification for recommending further investigations if a disorder of growth is suspected
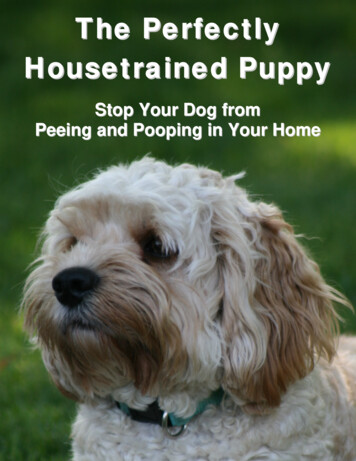
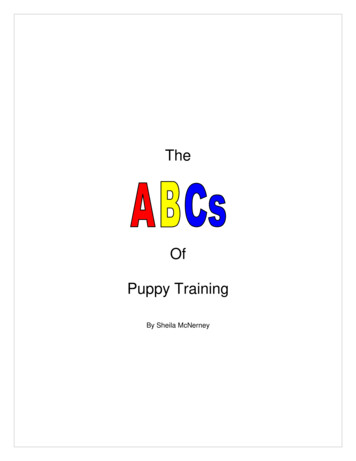
What tools are available to help me use the growth charts?FAQs - Frequently Asked QuestionsThere are a number of tools to help you use the WALTHAM Puppy Growth Charts Waltham Puppy Growth Charts Instructions For UseWhat do regular weight measurements tell us? The complete guide to WALTHAM Puppy Growth ChartsA single weight measurement provides a guide that enables the puppy to be compared with others at a similarage. However, on its own, it does not confirm that the puppy has developed normally, and/or will do so in thefuture. The process of growth monitoring means taking a series of measurements over time and plotting themto determine whether a puppy is developing normally (i.e. at a healthy rate). This is done by comparing thepuppy’s individual growth chart with the growth trajectories of a large population of healthy puppies known tobe developing normally. The major strength of this approach is that growth disturbances can be recognised morerapidly, enabling corrective measures to be implemented sooner. Infographic Instructional video WALTHAM Age App - coming 2017What do the lines on the charts mean?Each chart includes curves, called centile lines, which represent the expected range of growth which is considered tobe normal for dogs of that sex within that category. Nine centile lines are shown, which depict the 0.4th centile, 2ndcentile, 9th centile, 25th centile, 50th centile, 75th centile, 91st centile, 98th centile, and 99.6th centile. The numberof the centile reflects the percentage of the population whose weight falls below that line; for example, if a dog is onthe 75th centile, it means than 75% of dogs in that population group will weigh less (and 25% will weigh more).Although weights falling between the 0.4th centile and 99.6th centile are considered to be ‘normal’, it is importantto realise that growth of an individual dog depends on a number of variables, and growth patterns can be markedlydifferent. Typically, you would expect a healthy puppy’s weights to stay approximately in the same part of thechart throughout growth. However, some healthy puppies track more closely to the centile lines than others. Byplotting weights on the chart and tracking growth, problems can also be identified and managed more quickly.For example, puppies crossing centile lines upwards are growing quicker than expected, whilst those crossingdownwards are growing more slowly than expected. Whilst such centile crossing can occur in healthy dogs, it ismore likely to occur when there is a problem with nutrition or development.Why have size charts rather than charts for individual breeds?1Providing every puppy with theopportunity for healthy growth2Extensive research has been undertaken to develop and validate the growth charts. We have found that, despitethe breed differences, pure-bred dogs of a similar predicted adult weight develop in a similar manner. Thisobservation mirrors the research into healthy growth in children which appears to be similar worldwide, despitedifferences in ethnicity and geographical location. A further advantage of using an ‘predicted adult size’ approachis the fact that fewer charts are required to cover the majority of the dog population, than would be the case ifindividual breed charts were used. The only exception to the adult breed size approach is for giant breed dogs(see FAQ below).3What is the basis for the predicted adult size ranges which were chosen?Predicted adultbody weightFind the ageLess than 6.5kgWeigh the puppyof the puppy in weeksusingthe WALTHAM AgeWheelMALE FEMALEPredicted adultbody weight6.5-9kgMALE FEMALEPredicted adultbody weight9-15kgMALE FEMALEChoose the right WALTHPredicted adultbody weight15-30kgMALE FEMALEAM Growth Chart45Plot weight onthe chartBuild up more plots(weigh monthly untilpuppyis 6 months old theneverythree months until adulthood)Predicted adultbody weight30-40kgMALE FEMALEThe ranges are based on the average bodyweights of a collection of dog breeds which grow at a similar rate. Theupper and lower limits of the predicted adult body weight range are based on the average adult weight of thelargest and smallest breeds within each size range.Why do the top and bottom centile curves sometimes plateau at weights outsidethe predicted adult weight range?6Assess growthpatternThe upper and lower limits of the predicted adult size ranges are based upon an average weight, whereas thecentile curves represent the full range of bodyweights of all individuals within a particular size class. Dogs growingon the lower (0.4th) or upper (99.6th) centile curve within a size class may be growing at a healthy rate, howeverthey are likely to be smaller or larger than is typical for the breed.Can the growth charts be used for mixed-breed dogs?UNDERWEIGHTInvestigate furtherHEALTHY WEIGHTGreat! ContinuemonitoringOVERWEIGHTInvestigate furtherWhilst the growth charts were developed and validated using data from pure-bred dogs, the use of size chartsmeans that they are also valid for mixed breed dogs, where the date of birth and expected adult weight is known.The charts should be used more cautiously if either the predicted adult weight is not known (for example if thebreed mix is unclear) or the date of birth are not known.
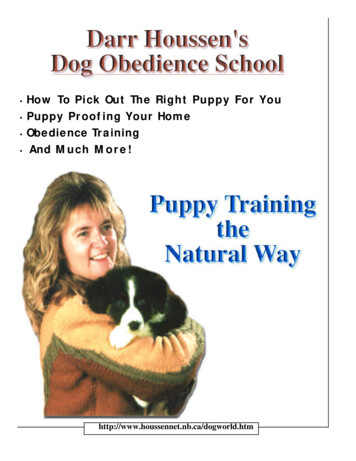
What if the predicted adult size of the puppy is unknown?The charts can still be used to monitor growth, but veterinary professionals should be more cautious in interpretingthem. Start by choosing the chart on which the puppy’s current weight lies between the 9th and 91st centiles, andplot three serial measurements at monthly intervals. At that stage, decide whether the puppy’s growth continuesto follow a centile line (or is tracking between centiles). If this is the case, and if the puppy is healthy and in goodbody condition, it is likely that you have selected the correct chart, and can proceed with subsequent weightmeasurements. However, if the puppy appears to be healthy and in good bodily condition but the growth pattern ismarkedly deviating from the curves on the chart selected, you may need to consider transferring the plotted pointsonto a different chart to determine if it fits the growth pattern better.What if the age of the puppy is unknown?Where the age is not known, it may be possible to ascertain a reasonable estimate by looking at the dentition ofthe puppy, based upon the eruption times of permanent teeth. Since this age will only ever be an estimate, thegrowth curves should be interpreted with more caution, and complemented with other information. Making serialassessments of dentition, undertaken at the same time as the weight measurements, can help to confirm and/orrefine the accuracy of the age estimate. In addition, regular assessments of body condition score, comparison withgrowth development in litter mates, and reference to the adult weight of the parents will also help to confirm thatgrowth is on track.Why are growth charts not available for giant breeds?During research, it became clear that there were marked differencesin growth patterns amongst the giant breeds, meaning that itis not possible to construct a single growth chart and centilecurves to represent the growth of dogs that attain a bodyweightabove 40kg. As a result, validated growth charts for dogs in thissize category are not yet available but we plan to develop growthcharts in the future for the most common giant breeds.What is a normal rate of weight gain and growth?Puppies don’t all grow at the same rate. A dog’s weight is most likely totrack along one centile line or within one centile space (the gap betweentwo centile lines). Some puppies may cross a centile line upwards ordownwards during growth and this isn’t necessarily an issue if they areotherwise well. Acute illness can affect how a puppy grows, for exampleby crossing centiles downwards. However, on recovery the puppy’s weight would beexpected to return to its original centile within a few weeks. In contrast, any sustaineddrop or rise through two or more centile spaces (crossing two centile lines) is unusual and should be carefullyassessed, as it can indicate a possible growth disturbance. Whilst healthy dogs can occasionally cross two ormore centiles, this occurs more commonly in puppies that are growing too quickly or too slowly i.e. are at risk ofbecoming overweight or have a growth disturbance.Should all healthy puppies be on the 50th centile line?The 50th centile line is not a target for puppies to achieve, it simply indicates the weight at which 50% of puppies inthe population are lighter. In fact, any centile line (or space between two centile lines) can be considered a healthyweight for an individual puppy; what is more critical is that the centile is tracked, and centile crossing does not occur.A puppy which is very small or very big compared to its peers (i.e. puppies of the same age and predicted adultweight) can sometimes have an underlying illness, or may be receiving improper nutrition. Puppies who are atthe extremes of the ranges (i.e. greater than the 99.6th or less than the 0.4th centile) are displaying a pattern ofgrowth that is very unusual. This does not mean that this puppy’s growth is definitely abnormal, but extra careshould be taken to monitor growth in these dogs. By regularly plotting weights on the chart and tracking growth,problems can be identified and managed more quickly.What if the puppy’s individual growth curve crosses more than two centiles ordisplays a flat growth line?Both of these patterns are signs of growth disturbances and indicate the need to consider some form of intervention.If the puppy’s individual growth trajectory crosses centiles in an upwards direction, it could suggest that the puppyis becoming overweight, especially if two or more centiles are crossed. Assessing the puppy’s body condition scoreusing a validated BCS system can help to guide your decision. Overly rapid growth can also be associated withskeletal abnormalities such as osteochondrosis and hip dysplasia. When interpreting such changes, consider parentalweight, sibling growth rates, and nutritional intake wherever possible. Also consider whether the puppy has recentlybeen neutered, as this may affect growth. In these cases, it may be necessary to make adjustments in feeding andactivity, together with close weight monitoring (monthly) in order to rectify the problem.If the puppy’s weight crosses in a downwards direction (especially when two or more centiles is crossed), ordemonstrates a flat growth line, it could be a sign of either inadequate nutrition or a disease associated withretarded growth (e.g. nutritional hypoparathyroidism, portosystemic shunt, pituitary dwarfism). Considerwhether there have been any recent acute illnesses e.g. gastroenteritis, which can lead to a temporary halt ingrowth (although growth should catch up subsequently). Also consider parental weight, sibling growth rates andnutritional intake wherever possible. If an obvious cause is not evident consider performing investigations intooverall health status, and/or adjustments to feeding and activity.If a puppy has crossed two or more centiles in the same direction, does thatdefinitely mean it has a problem?Not necessarily. For example, it is possible for healthy growing dogs to cross two or more centiles in the samedirection, but this is relatively uncommon. In contrast, about 60% and 70% of dogs that become overweightand obese, respectively, cross two or more centiles. Therefore, crossing centiles upwards should be a flag to aveterinary professional to check the health status of the puppy, review the nutrition plan, and consider if specificinvestigations are required.If a puppy has not crossed any centiles, does that guarantee it will be healthy?Not necessarily. Tracking centiles and not crossing them is certainly a characteristic of healthy dogs. Therefore, apuppy following the expected trajectory is much more likely to be healthy and remain at an ideal weight. However,some dogs with diseases that affect growth may not cross many centiles, not least those with disorders that tend toretard growth. For example, dogs with conditions such as portosystemic shunt and dwarfism tend to be light for age(in the lowest quartile) at 12 weeks, but under half of them cross two or more centiles. Instead, many may continueto track the lower centile curves. Therefore, absence of centile crossing should not be used to rule out a possibledevelopmental disease, not least if the puppy is showing suspicious clinical signs. Always consider the puppy’shealth status, and review the clinical history and nutrition plan before deciding whether investigations are required.Will neutering affect puppy growth?The charts have been validated for use in both entire dogs and also those neutered during their growth phase.After neutering, you should monitor growth monthly for the first three months, and then every three months untilthe puppy reaches adult size. If subsequent growth is healthy, the weight will continue to follow the centile lines.Of course, neutering can lead to growth disturbances if puppies are overfed for their energy requirements, with themost likely pattern being upwards crossing of centile lines. In such cases, an adjustment to the feeding plan (e.g. areduction in food intake) may be necessaryWhat if a weight measurement is missed?Whilst not ideal, missing the occasional measurement is not critical. In such circumstances, try to encouragethe owner to bring the puppy to the veterinary practice as soon as possible so that weight can be checked, andencourage regular measurements thereafter.
What if the owner wants to weigh the puppy at home?It is not advisable for owners to weigh dogs at home. The charts are designed to be used by veterinaryprofessionals in partnership with owners. This ensures that calibrated weighing equipment is used and enables thechart to be incorporated into the puppy’s health record. It also ensures that appropriate veterinary advice is givenif a growth disturbance is identified.Who should be responsible in the veterinary practice forperforming and recording weight measurements?It is advisable for weight measurements to be taken either by qualifiedveterinary surgeons or registered veterinary nurses/technicians, after appropriatetraining. This ensures that growth trajectories can be properly monitored andadvice given to puppy owners should the need arise. Since different practices mayfunction differently, it is best for the individual practice to decide which staff are bestfor overseeing the use of the growth charts.What is the latest age that recording can start?Although recording weight can start at any age, too long a delay in starting beyond12 weeks means that the most rapid period of growth may be missed.The puppy has come for scheduled weight check but is unwell.Should the reading still be taken?The weight can still be measured and recorded but further weight measurementsare advisable after the puppy recovers (e.g. at least monthly for 3 months).Acute illnesses (e.g. gastroenteritis) can lead to a temporary halt in growth,and may mean one centile line is crossed. However, in most cases, growthshould catch up again subsequently, and again follow the original centileline. It can be useful to note on the chart if the puppy was unwell at theweight check. If more than two centile lines are crossed, or growth doesnot catch up again, further assessment may be advisable.The owner wants to weigh the puppy more frequently. Is that advisable?Whilst many owners may wish to have more regular weight measurements this is not always worthwhile andcan lead to unnecessary worry. This is because day-to-day variability in measurements (e.g. effect of recentmeal consumption, urination or defecation) might lead to unnecessary concern. Weight measurements over alonger period are more likely to reflect the true change in weight of body tissues. Therefore, as long as growthis developing normally, it is usually best to carry out monthly weight checks until 6 months of age, and at leastevery 3 months thereafter. Of course, more regular checks may be needed if you are concerned about a growthdisturbance but this should be decided upon, and conducted by, the veterinary care team.Can I use the chart to predict the adult weight of the dog?Whilst a single weight measurement can demonstrate the puppy’s size relative to others of a similar age, repeatedmeasurements are more accurate. Once you have taken enough measurements so as to establish the centile linethat the puppy is following (we recommend three serial measurements), you can then use this to predict expectedadult weight, assuming that the puppy continues to grow at a healthy rate.I have used growth charts in the past and they have not been helpful. How are thesegrowth charts different?Over 6 million bodyweight measurements from 50,000 healthy growing puppies have been used to develop andvalidate the charts. The work has been undertaken in collaboration with scientists at University College London,who have developed similar growth charts for children. The same statistical methodology used for the childgrowth charts has been used to create and refine the centile lines, and the final charts have then been furthervalidated in prospective studies in different populations of dogs. WALTHAM Centre For Pet Nutrition
The WALTHAM ª Puppy Growth Charts are the Þrst evidence-based growth standards for pet dogs and have been developed using professionally accepted scientiÞc methods using data derived from 50,000 dogs. The charts provide a useful tool to track puppy growth and tailor your advice to build a strong and lasting client bond. It