Transcription
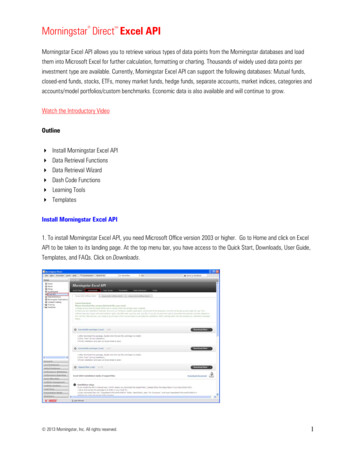
Morningstar Direct Excel API SMMorningstar Excel API allows you to retrieve various types of data points from the Morningstar databases and loadthem into Microsoft Excel for further calculation, formatting or charting. Thousands of widely used data points perinvestment type are available. Currently, Morningstar Excel API can support the following databases: Mutual funds,closed-end funds, stocks, ETFs, money market funds, hedge funds, separate accounts, market indices, categories andaccounts/model portfolios/custom benchmarks. Economic data is also available and will continue to grow.Watch the Introductory VideoOutline Install Morningstar Excel API Data Retrieval Functions Data Retrieval Wizard Dash Code Functions Learning Tools TemplatesInstall Morningstar Excel API1. To install Morningstar Excel API, you need Microsoft Office version 2003 or higher. Go to Home and click on ExcelAPI to be taken to its landing page. At the top menu bar, you have access to the Quick Start, Downloads, User Guide,Templates, and FAQs. Click on Downloads. 2013 Morningstar, Inc. All rights reserved.1
Morningstar Direct Excel API SM2. You have three choices. You can download the API to Excel 2003, Excel 2007, or Excel 2010. For demonstrationpurposes, we will use Excel 2003 which is activated as the default tab. Go to the Executable package (.exe) and clickon Download Now.3. You will be taken to the File Download window. Click Run.4. Once the download is complete, open a new workbook in Microsoft Excel where you will now see the Morningstaradd-in listed in the menu bar. You have successfully downloaded the Morningstar Excel API. 2013 Morningstar, Inc. All rights reserved.2
Morningstar Direct Excel API SMData Retrieval FunctionsMorningstar Excel API provides five data retrieval functions: MSDP, MSTS, MSDate, MSHOLDING and MSMEMBER.MSDP, MSTS, MSHOLDING functions work the same way for funds, stocks and accounts/model portfolios/custombenchmarks. All the examples below use funds or stocks for these three functions but you can apply the same logic toaccounts/model portfolios/custom benchmarks by following the wizard to retrieve the global unique identifier (GUID)shown in the Formula Result Box to then get the corresponding data.Click Here for Guide on Accounts/Model Portfolios/Custom Benchmarks1. MSDP (Morningstar Data Point) Retrieve discrete value Requires 2 parameters: security identifier and data attribute identifier Example: MSDP(“MORN”,”sector”)MSDP is designed for retrieving current data points such as stock name, Morningstar Category for a mutual fund shareclass. MSDP requires two parameters, security identifier and data attribute identifier.Security identifiers are trading symbol (long form such as NAS:AAPL or short form such as AAPL), ISIN, and CUSIP.When security types are not traded on exchanges, you need to provide an identifier defined by Morningstar (SecID).This would apply to market indices, separate accounts, and pension/life products.As mentioned above, the security identifier for accounts/model portfolios/custom benchmarks is the global uniqueidentifier (GUID), which can only be found in Direct log file - shown in the Formula Result Box.Data point or attribute identifier defines the data point uniquely. Therefore, the data point names in text serve as thedata identifier. For example, “name” represents name, “close” represents security closing price, or “ret market”represents market return. Parameter values are presented in quotation marks and separated by commas. 2013 Morningstar, Inc. All rights reserved.3
Morningstar Direct Excel API SMExample 1: for single security with single data point MSDP("GOOG"," Base CUR") MSDP("A2", "B1")Example 2: for single security with multiple attributes MSDP( A2, B1) or MSDP( A2,C1) or MSDP( A2, D1)Example 3: for multiple securities with multiple data points MSDP( A2, B 1) 2013 Morningstar, Inc. All rights reserved.4
Morningstar Direct Excel API SM2. MSTS (Morningstar Time Series) Time series calculation 4 parameters required: security identifier, data attribute identifier, start date, end dateFor most time series data like price, MSTS requires at least four parameters, but for custom calculation data points,MSTS requires more parameters dependent on the data point requirements. For example: to calculate an average,MSTS also requires source parameter; to calculate beta, MSTS requires source, benchmark, and RFP parameters – alldependent on your target data points.Click Here for Guide on Custom Calculations Relative dates can be applied Example: lmktclose”)MSTS is designed for retrieving data time series such as historical prices for stocks, NAVs for mutual fund, orhistorical calendar period returns for securities. MSTS requires a minimum of four parameters - security identifier, datapoint identifier, start date, and end date. For information on security identifier and data point identifier, refer to theMSDP section above. For start data and end data, the time range is defined for the intended data series. For example,function MSTS("COLB", "close", "3/1/2011", "3/31/2011")” retrieves daily close price of Columbia Banking System,Inc. from 3/1/2011 to 3/31/2011.Additional parameters are also offered to meet specific needs. For example, daily series can be displayed fully or at alower frequency such as weekly or monthly. A maximum of fifteen parameters can be utilized to fully convey thereturn data requirements. 2013 Morningstar, Inc. All rights reserved.5
Morningstar Direct Excel API SMExample 1: to generate historical series MSTS("WFC", "close", "3/1/2011", "3/31/2011")Example 2: to retrieve return data point by using “return” as data point identifier and specifying return type as theadditional parameter MSTS("TSE:WFC","return", "3/1/2011", "3/31/2011","CorR R,Dates True,Freq D,Days C,Fill B,Curr USD,rtype total")Example 3: to retrieve return data point by using “return type” as data point identifier and achieve the same result MSTS("TSE:WFC","total ret", "3/1/2011", "3/31/2011","CorR R,Dates True,Freq D,Days C,Fill B,Curr USD") 2013 Morningstar, Inc. All rights reserved.6
Morningstar Direct Excel API SMExample 4: to calculate alpha for stocks rR C,Dates True,Source HS440,Benchmark XIUSA04G92,RFP XIUSA000OC,Comp S,Win 9,Shift 3,Ann False,Fill B,Curr BASE")HS440 is ID of monthly market return; XIUSA04G92 is ID of S&P 500 TR; XIUSA000OC is ID of USTREAS TBill Auction Ave 3 Mon;In the examples above, we indicated the start and end date but there are many different ways to save time inspecifying a time range clearly without having to type full values for start date and end date. Below are two groups ofexamples to apply relative dates.Group 1: Using “ ” or “–“ to define a date relative to a specific dateFor example, with SD representing start date and ED representing end date, you can use “ ” and “–“ to define a daterelative to a specific date. Date abbreviations are: D for working daily, W for week, M or C for month, Q for quarter, Y,X or G for year, S for half year. For detailed definition of these parameters, please refer to dash code part.Example 1: when end date equals the start date plus six days MSTS("NAS:VIFSX","NAV daily", "4/4/2011", "SD 6D","Dates True") 2013 Morningstar, Inc. All rights reserved.7
Morningstar Direct Excel API SMExample 2: Alternatively, when start date equals the end date minus six days MSTS("NAS:VIFSX","NAV daily", "ED-6d", "4/12/2011","Dates True")Group 2: Using frequency abbreviations to retrieve values for the whole calendar period.M represents monthly, Q represents quarterly, and S represents half year. Please note that a similar logic may beprovided in a future release to address fiscal calendar periods.Example 1: to retrieve daily closing prices for the month of February 2010 MSTS("NYS:GD", "close", "2010m2","Dates True") 2013 Morningstar, Inc. All rights reserved.8
Morningstar Direct Excel API SMExample 2: to retrieve daily closing prices for the first quarter of 2010 MSTS("NYS:GD", "close", "2010Q1","Dates True")Example 3: to retrieve daily closing prices for the first half of the year, 2010 MSTS("NYS:GD", "close", "2010S1","Dates True") 2013 Morningstar, Inc. All rights reserved.9
Morningstar Direct Excel API SMThe table below shows the full range of configuration capability. In the Possible Values column, the first value isconsidered the default value with the exception of the rtype parameter. Therefore, if you do not specify a parameterexplicitly, Morningstar API will use the first value by default.ParameterNameDescriptionPossible ValuesCorRIndicate whether retried values be displayedvertically or horizontallyC for the next cell in the same columnDatesShow the dates or notR for the next cell in the same rowTrue for show the datesFalse for hide the datesD for dailyW for weeklyM for monthlyFreqBase frequency of retuned dataQ for quarterlyS for semi annuallyY for yearly1 for day to day returnDaysTypically used to indicate whether to return values C for returning data of all calendar daysfor all calendar days, days with actual values in the W for returning data week daysdatabase or week daysT for returning data trading daysFillDesigned to deal with days without real values,like a non-trading daysC for carrying over the last available dataP for carrying over the previous day's dataB for showing blank0 for filling 0CurrCurrency of the returned dataThe three letter ISO currency code, in quotation marks, i.e.,"EUR" for Euro.ScaleReduce result 10x times0, 00, 000, 000,000, etcB2P for Bid Price ReturnB2B for Bid-Bid ReturnrTypeApply only to return data points, indicate returntype. Default value for Italy and UK mutual fund ispost tax return; for other domiciled mutual fund istotal return; For closed ends, ETF, stocks andmarket index are market return; for money marketfund is total return; for separate account is grossreturn.gross for Gross Returnincome for Income Returninvestor for Investor Returnmarket for Market Returnnet for Net ReturnO2B for Offer Bid Returnpost tax for Post-Tax Returnprice for Price Returntotal for Total ReturnAnnSourceBenchmarkRFPCompWinShiftRetrieve annualized or not annualized day to dayreturn.False for not annualized day to day returnTrue for annualized day to day returnSource data used to calculate the target custom ca Data Point ID, e.g. HP010 for Monthly ReturnBenchmark used to calculate the selected custom c SecID of securitiesRisk-free proxySecID of securitiesCompounding MethodS for standard; L for logarithmic;Rolling windowsPositive numbersWindow shiftPositive numbers 2013 Morningstar, Inc. All rights reserved.10
Morningstar Direct Excel API SM3. MSDate (Morningstar Date) Retrieve dynamic dates Examples: MSDATE(“lmktclose”)MSDate is designed to provide more convenience in defining time periods or effective dates. For example, MSDatecan be used to dynamically retrieve last year end, last quarter end, last month end, last week end and last marketclose date. This function is considered necessary when you need to move time windows dynamically. Below is a tableof these important dates.Example 1: to retrieve the date for last year end MSDATE("lyend")Example 2: to retrieve the date for last quarter end MSDATE("lqend") 2013 Morningstar, Inc. All rights reserved.11
Morningstar Direct Excel API SM4. MSHOLDING (Morningstar Holding Data) Retrieve holding data Require 2 parameters to retrieve latest holding: portfolio ID and position ID Require 4 parameters to retrieve historical holding: portfolio ID, position ID, start date, end date Example: MSHOLDING("VFIAX","ISIN",), 31/2011")MSHOLDING is designed for retrieving holdings of portfolios. MSHOLDING requires at least two parameters to retrievethe latest holding, portfolio ID and position ID. Portfolio IDs are ticker, ISIN, CUSIP and Morningstar SecID, the same assecurity identifiers of MSDP and MSTS. Position IDs define the output IDs of holdings and could be ticker, ISIN, CUSIPand Morningstar SecID.MSHOLDING requires a minimum of four parameters to get historical holdings, portfolio ID, position ID, start date andend date.Additional parameters are offered to meet more needs. The table below shows all additional parameters.Parameter NameParameter ValueHolding Type/HTall/stocks/bonds/cash/other, default as "all".FreqA/D/M/Q/Y, A for all available portfolios, default as "A".NameTrue/False, default as true.WeightTrue/False, default as true.SharesTrue/False, optional parameter, default as false.Market Value/MVTrue/False, optional parameter, default as false.CurrTrue/False, optional parameter, default as false. 2013 Morningstar, Inc. All rights reserved.12
Morningstar Direct Excel API SMExample 1: to retrieve latest holdings MSHOLDING("FOUSA00CJ8","ISIN") 2013 Morningstar, Inc. All rights reserved.13
Morningstar Direct Excel API SMExample 2: to retrieve market value of latest holdings MSHOLDING("GSSMX","ISIN","market value true") 2013 Morningstar, Inc. All rights reserved.14
Morningstar Direct Excel API SMExample 3: to retrieve number of shares and currency of latest holdings MSHOLDING("FOUSA00CJA;FO","Ticker","shares true,curr true") 2013 Morningstar, Inc. All rights reserved.15
Morningstar Direct Excel API SMExample 4: to retrieve historical holdings 1/2011") 2013 Morningstar, Inc. All rights reserved.16
Morningstar Direct Excel API SMExample 5: to retrieve historical stock holdings req A,Holding type stocks,MV true,name true")5. MSMEMBER (Morningstar Fund groups) Retrieve IDs of investment list or search saved in Direct Require 3 parameters to retrieve IDs of investment list or search: Source ID, Group Value and Security ID. Example: MSMEMBER("L","SAMPLE-US OE","SecId")MSMEMBER is designed for retrieving the IDs of all members of an investment list or a search, which is saved inDirect. MSMEMBER requires three parameters, Source ID, Group Value and Security ID. Source ID defines the source,“L” for investment list and “S” for search. Group Value is investment list name or search name. Security ID defines theoutput IDs of members and could be ISIN, Ticker, CUSIP, and SecID.Additional parameter “CorR” is offered to indicate whether retried values are displayed vertically or horizontally, “C” forthe next cell in the same column and “R” for the next cell in the same row. 2013 Morningstar, Inc. All rights reserved.17
Morningstar Direct Excel API SMExample 1: to retrieve IDs of members for an investment list MSMEMBER("L","ITALY TEST FUNDS","ISIN") 2013 Morningstar, Inc. All rights reserved.18
Morningstar Direct Excel API SMExample 2: to retrieve IDs of members for a search MSMEMBER("S","5 STAR","SecId","CORR R")Data Retriever WizardData Retriever Wizards (investment data retriever wizard and economic data retriever wizard) are convenient tools tospecify your data needs. If you are building a new formula into a cell, you need to find Data Retriever wizards from themenu indicated below. Data wizards are applicable for MSDP, MSTS, MSHOLDING and MSMEMBER functions, but notapplicable for the MSDate function, since you can "show dates" as seen in the image below.1. Before you launch the wizard, click on a cell where the resulting formula will be entered (e.g. A1). Proceed to go tothe Morningstar add-in and click on Investment Data or Economic Data. 2013 Morningstar, Inc. All rights reserved.19
Morningstar Direct Excel API SM2. For demonstration purposes, we will discuss the Investment Data Retriever Wizard first and fill in the necessarycriteria to generate your formula. Investment Data Retriever Wizard has two tabs: the Securities tab is for funds, stocks, indices and separate accounts the Portfolio Management tab is for accounts, model portfolios and custom benchmarks.There are three sub-tabs available in the Securities tab: Attribute/Time Series, Holdings and Identifier and two subtabs available for Portfolio Management tab: Attribute/Time Series and Holdings. As we go through each sub-tab,notice the formulas in the bottom box.Attribute/Time Series Sub TabSupplementary/Time Series sub-tab is applicable for MSDP and MSTS functions. 2013 Morningstar, Inc. All rights reserved.20
Morningstar Direct Excel API SMParametersDescriptionAvailable under Securities tab; Find specific security by name, ticker or ISIN; AnSecurityauto look-up.Available under Portfolio Management tab; Select the target object, accounts,Objectmodels portfolios or custom benchmarks.Available under Portfolio Management tab; Select accounts, models portfoliosAccountsor custom benchmarks for the dropdown.Data PointFind data point name with auto look-up.CurrencySelect currency.Start DateSelect start date of time series data.End DateSelect end date of time series data.LayoutSelect column or row layout.Show DatesCheck "show dates" to display corresponding dates.FillSelect the returned value for non-trading days.FrequencySelect the display frequency for time series data.Return Type*Select total, market, post-tax or other return type;Annualized*Check annualized if you want to annualize your return;Source**Select source data from the dropdown;Benchmark**Find the benchmark to calculate the custom calculation data; An auto look-up.Find the Risk-free proxy to calculate the custom calculation data; An auto lookRisk-free proxy**up.Compounding method** Select the Compounding methodRolling window**Set the time period for each calculationWindow shift**Set how often each calculation is performedView your formula as you fill in the parameters; At any point, you can copy theFormulaformula in to an active cell.* Return Type and Annualized are activated when using return datapoints.**Source, Benchmark, Benchmark, Risk-free proxy, Compounding method, Rolling window and areactivated when using custom calculation datapoints. 2013 Morningstar, Inc. All rights reserved.21
Morningstar Direct Excel API SMHoldingsHoldings sub-tab is applicable for MSHOLDING function.ParametersSecurityObjectAccountsPosition IDStart DateEnd DateHolding TypeData TypeShow nameFrequencyDescriptionAvailable under Securities tab; Find specific security by name, ticker or ISIN; Anauto look-up.Available under Portfolio Management tab; Select the target object, accounts,models portfolios or custom benchmarks.Available under Portfolio Management tab; Select accounts, models portfoliosor custom benchmarks for the dropdown.Select from ISIN, ticker or SecID.Select start date of time series data.Select end date of time series data.Select from stocks, bonds or all holding.Select from weight, market value or number of shares.Check "show name" to display name of holdings.Select the display frequency for time series data. 2013 Morningstar, Inc. All rights reserved.22
Morningstar Direct Excel API SMIdentifiersIdentifiers sub-tab is applicable for MSMEMBER function. 2013 Morningstar, Inc. All rights reserved.23
Morningstar Direct Excel API SM3. Let’s now turn our attention to Economic Retriever Wizard which is applicable to MSDP and MSTS functions toretrieve discrete and series value of economic indicators.Criteria Tab: to set criteria and select indicatorsCountry: both country level and US regional level indicators are available; a country tree is provided.Concept: select concept from dropdown list. Concept is a broad category of indicators.Category: select category from dropdown list. Category is sub-classification of Concept.Location: applicable for US regional indicators only. Type a key word in the box and API will search by “contain”logic. Name: type a key word in the box and API will search by “contain” logic. Frequency: select disclosure frequency of indicators. 2013 Morningstar, Inc. All rights reserved.24
Morningstar Direct Excel API SMSettings Tab: to define more information Display: pick up the data point for selected indicators.Start date: select start date of series value.End date: select end date of series value.Layout: select column or row layout.Show Dates: check "show dates" to display corresponding dates.Days: select from trading days/activity days, calendar days or weekdays.Fill: select the returned value for non-trading days.Once complete with your settings, click OK and your result will be displayed in Excel. 2013 Morningstar, Inc. All rights reserved.25
Morningstar Direct Excel API SMDash Code FunctionsDash codes in Morningstar Excel API is an extension of the data retrieval functions where you can specify the start andend date in relation to a chosen number of periods before the current date or specified end date (i.e. “Latest –w1” willset the date to the end of the previous week). Multiple dash codes can be used in one date function. You also havethe benefit of setting up floating time periods.Parameters: Latest - This will be yesterday’s date as the current day’s price will not have been collected yet. Latest can alsobe used in conjunction with the codes below by adding the codes onto the end of latest (e.g. Latest-m3) For start dates only use the chosen end date plus a dash code. In the start date field if users enter just a dashcode (e.g.’-w3’ rather than ‘latest-w3’) the system will use the user specified end date and apply the dash codelogic to that to find the start date. E.g. If the end date is ‘latest-w2’ and the start date is just ‘–w3’. The start datewould go back 3 weeks from the end date (i.e. it would go back 5 weeks in total]Examples below use a date of 12th April 2011 as the latest date. The actual date is the 13th April. /-D - Goes forward/back the required number of working days, only includes Mon-Friday days.E.g.Latest–d5 will go back to 5th April 2011. (For a start date API would show this as 6th April 2011). /-W - Goes forward/back the required number of weeks and then to the previous Saturday point.E.g.Latest–w1 would return the 2nd April 2011 (back one week to the 5th April (Tuesday) then go back to the priorSaturday. (For a start date API would show this as 3rd April 2011) /-M - Goes forward/back the required number of Months and then to the previous Month end point.E.g.Latest–m0 it would go back to 31st March 2011. (For a start date API would show this as 1st April) /-C - Goes forward/back the required number of Calendar months to the same date in the monthE.g.Latest–c3 would go back to the 12th Jan 2011. (For a start date API would show this as 13th Jan) /-Q - Goes forward/back the required number of quarters and then to the previous quarter end pointE.g.Latest-Q2 would go back to 30th Sep 2010. (For a start date API would show this as 1st Oct 2010) /-S - Goes forward/back the required number of 6 month periods then to the previous Dec/June end point e.g.Latest-s1 would go back to 31st June 2010. (For a start date API would show this as 1st July 2010) 2013 Morningstar, Inc. All rights reserved.26
Morningstar Direct Excel API SM /-X - Goes forward/back the required number of years and then to the previous year end pointE.g.Latest-x4 would go back to 31st Dec 2006. (For a start date API would show this as 1st Jan 2007) /-Y - Goes forward/back the required number of years and then to the previous month end pointE.g.Latest –y1 would go back to 31st March 2010. (For a start date API would show this as 1st April 2010) /-G - Goes forward/back the required number of calendar years to the same point in the monthE.g.Latest –g1 would go back to 12th April 2010. (For a start date API would show this as 13th April 2010)Manually Write Dash Codes in MSTS functionExample 1 (generated on 9/29/2011): when latest 9/28/2011, start date 9/1/2011, end date 9/28/2011 MSTS("NAS:JGBAX","Return", "latest-m0", "latest","Dates True,Freq d,Days C,RType total") 2013 Morningstar, Inc. All rights reserved.27
Morningstar Direct Excel API SMExample 2 (generated on 9/29/2011): when latest 9/28/2011, start date 1/1/2010, end date 12/31/2010. MSTS("NYS:MMM","Close", "ED-1X", "latest-0X","Dates True,Freq d,Days C,Fill B")Example 3 (generated on 9/29/2011): when latest 9/28/2011, start date 4/1/2011, end date 6/30/2011 MSTS("NAS:PHDAX","NAV daily", "ED-1Q", "lqend","Dates True,Freq d,Days C") 2013 Morningstar, Inc. All rights reserved.28
Morningstar Direct Excel API SMExample 4: when end date is specified to be April 6, 2011 plus 6 working days, i.e. April 14, 2011. MSTS("NAS:VIFSX","NAV daily","4/4/2011","4/6/2011 6d","dates true,days c")Enter Dash Codes in Data Retriever DialogTo enter dash codes in Data Retriever Dialog, choose the End Dash Codes option in the Start date and End date dropdown. The default dash code of “End date” is latest. Therefore, if you do not add an End date, the default is latest.Example 1 (generated on 9/29/2011): when latest 9/28/2011, API will return daily closing price of Microsoft from8/29/2011 to 9/28/2011. 2013 Morningstar, Inc. All rights reserved.29
Morningstar Direct Excel API SMExample 2: use –Ow as the End date which will take you back to the beginning of the current week and -2w as theStart date which will take you back to the start of two weeks ago.Use Dash Codes in MSDate FunctionDash code parameters can be used in MSDate function. When MSDates is referred to or included in MSTS as startdate, API will automatically add one day for MSDate result and use it as start date for MSTS calculation.Example 1 (generated on 9/29/2011): When lmktclose 9/28/2011, in MSTS start date 8/1/2011, enddate 8/31/2011MSTS("GOOG","close",A1,A2,"dates true,days c");A1: MSDATE("lmktclose-1m"); A2: MSDATE("lmktclose-0m"). 2013 Morningstar, Inc. All rights reserved.30
Morningstar Direct Excel API SMExample 2 (generated on 9/29/2011): When latest 9/28/2011, in MSTS start date 1/1/2010, enddate 12/31/2010.MSTS("XXX:9146","total ret", A1, A2,"Dates True,Freq m,Days T");A1: MSDATE("latest-3s"); A2: MSDATE("latest-1s").Example 3: When lsyend 6/30/2011, in MSTS start date 7/1/2010, end date 6/30/2011. MSTS("NAS:PASAX","NAV daily", MSDATE("lsyend-2s"), MSDATE("lsyend"),"Dates True,Freq d,Days C") 2013 Morningstar, Inc. All rights reserved.31
Morningstar Direct Excel API SMLearning toolsThere are many tools to help you maximize the value of Morningstar Excel API. In addition to this user guide and thevideo provided on the first page, you have access to live sessions located in Morningstar Direct’s training page as wellas the data dictionary, templates, and FAQs located in Excel API landing page. Also, from the Morningstar Excel APIadd-in, you get easily get access to most of this information in addition to sending us feedback should you have anyquestions, concerns, or suggestions.1. For example, go to your add-in and click on Data Dictionary.2. You will be taken to the Data Dictionary folder in the Morningstar Excel API landing page where you can build yourknowledge of the available data points. Simply locate the universe or search for specific data point. 2013 Morningstar, Inc. All rights reserved.32
Morningstar Direct Excel API SM3. Go back to the Morningstar add-in and this time, click on Templates.4. You will be taken to the Templates folder in the Morningstar Excel API landing page where you can utilize thetemplates to build your knowledge of Morningstar Excel API. 2013 Morningstar, Inc. All rights reserved.33
Morningstar Direct Excel API SMTemplates (created in Microsoft Excel 2010) Asset Class Winners & Losers Correlation Matrix Best Month Worst Month Heatmap Year to Year Heatmap Fund Sheet Stock SheetAsset Class Winners & Losers TemplateClick Here to Access the TemplateRetrieve annual returns on 10 investments to visualize asset class fluctuations over time.1. Be sure to install the latest version of Excel API (1.01.023), enable all macros, and open the attached file.2. Log in with your Morningstar Direct credentials. “Ctrl Alt F9” will refresh the spreadsheet.3. Enter your investments in the “Inputs” worksheet by entering a SecID, Ticker, or CUSIP into the cells in column B.4. Once these investments have been entered, go back to the “Winners & Losers” worksheet.5. Now press “Ctrl Shift R” to run a macro to sort the spreadsheet according to the investments entered. 2013 Morningstar, Inc. All rights reserved.34
Morningstar Direct Excel API SMCorrelation Matrix TemplateClick Here to Access the TemplateRetrieve 3 years of monthly returns on 20 investments to automatically create a correlation matrix containingconditional formatting. A red cell indicates high correlation and a blue cell indicates low correlation. Just enter tickers,SecIDs, or CUSIPs into the cells in column A. 2013 Morningstar, Inc. All rights reserved.35
Morningstar Direct Excel API SMBest Month Worst Month Heatmap TemplateClick Here to Access the TemplateRetrieve historical monthly returns to visualize seasonal market trends. Just enter a ticker, SecID, or CUSIP in cell A1.Quickly identify best and worst months dating back over 20 years. 2013 Morningstar, Inc. All rights reserved.36
Morningstar Direct Excel API SMYear to Year Heatmap TemplateClick Here to Access the TemplateRetrieve a matrix of returns to illustrate multiple holding periods of any investment. Just enter a ticker, SecID, orCUSIP in cell A2. 2013 Morningstar, Inc. All rights reserved.37
Morningstar Direct Excel API SMYield Curve TemplateClick Here to Access the TemplateRetrieve dynamic yield curve and credit spread charts updated on a monthly basis. 2013 Morningstar, Inc. All rights reserved.38
Morningstar Direct Excel API SMFund Sheet TemplateClick Here to Access the TemplateRetrieve managed portfolio content such as performance relative to benchmark, allocation, risk statistics, asset flows,and more. Just enter the ticker, SecID, or CUSIP
1. To install Morningstar Excel API, you need Microsoft Office version 2003 or higher. G o to Home and click on Excel API to be taken to its landing page. At the top men u bar, you have access to the Quick Start, Downlo