Transcription
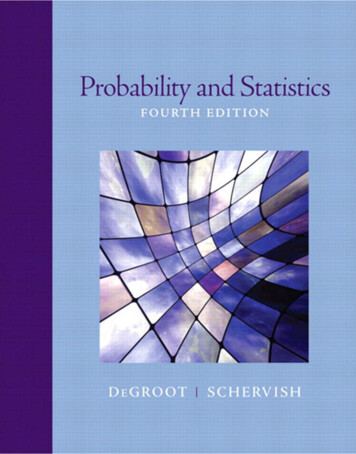
Statistics and Probabilityfor Engineering ApplicationsWith Microsoft Excel
[This is a blank page.]
Statistics and Probabilityfor Engineering ApplicationsWith Microsoft ExcelbyW.J. DeCourseyCollege of Engineering,University of SaskatchewanSaskatoonAmsterdamBostonLondonSan DiegoSan FranciscoN e w Yo r kSingaporeOxfordSydneyParisTo k y o
Newnes is an imprint of Elsevier Science.Copyright 2003, Elsevier Science (USA). All rights reserved.No part of this publication may be reproduced, stored in a retrieval system, ortransmitted in any form or by any means, electronic, mechanical, photocopying, recording, or otherwise, without the prior written permission of thepublisher.Recognizing the importance of preserving what has been written,Elsevier Science prints its books on acid-free paper whenever possible.Library of Congress Cataloging-in-Publication DataISBN: 0-7506-7618-3British Library Cataloguing-in-Publication DataA catalogue record for this book is available from the British Library.The publisher offers special discounts on bulk orders of this book.For information, please contact:Manager of Special SalesElsevier Science225 Wildwood AvenueWoburn, MA 01801-2041Tel: 781-904-2500Fax: 781-904-2620For information on all Newnes publications available, contact our World WideWeb home page at: http://www.newnespress.com10 9 8 7 6 5 4 3 2 1Printed in the United States of America
ContentsPreface . xiWhat’s on the CD-ROM? . xiiiList of Symbols . xv1. Introduction: Probability and Statistics. 11.11.2Some Important Terms . 1What does this book contain? . 22. Basic Probability . 62.12.2Fundamental Concepts . 6Basic Rules of Combining Probabilities . 112.2.1 Addition Rule . 112.2.2 Multiplication Rule . 162.3 Permutations and Combinations . 292.4 More Complex Problems: Bayes’ Rule . 343. Descriptive Statistics: Summary Numbers . 413.13.23.33.4Central Location . 41Variability or Spread of the Data . 44Quartiles, Deciles, Percentiles, and Quantiles . 51Using a Computer to Calculate Summary Numbers . 554. Grouped Frequencies and Graphical Descriptions . 634.14.24.34.44.5Stem-and-Leaf Displays . 63Box Plots . 65Frequency Graphs of Discrete Data . 66Continuous Data: Grouped Frequency . 66Use of Computers . 75v
5. Probability Distributions of Discrete Variables . 845.15.25.35.45.55.6Probability Functions and Distribution Functions . 85(a) Probability Functions . 85(b) Cumulative Distribution Functions . 86Expectation and Variance . 88(a) Expectation of a Random Variable . 88(b) Variance of a Discrete Random Variable. 89(c) More Complex Problems. 94Binomial Distribution . 101(a) Illustration of the Binomial Distribution . 101(b) Generalization of Results . 102(c) Application of the Binomial Distribution . 102(d) Shape of the Binomial Distribution . 104(e) Expected Mean and Standard Deviation . 105(f) Use of Computers . 107(g) Relation of Proportion to the Binomial Distribution. 108(h) Nested Binomial Distributions. 110(i) Extension: Multinomial Distributions. 111Poisson Distribution . 117(a) Calculation of Poisson Probabilities . 118(b) Mean and Variance for the Poisson Distribution. 123(c) Approximation to the Binomial Distribution . 123(d) Use of Computers . 125Extension: Other Discrete Distributions . 131Relation Between Probability Distributions andFrequency Distributions . 133(a) Comparisons of a Probability Distribution withCorresponding Simulated Frequency Distributions . 133(b) Fitting a Binomial Distribution. 135(c) Fitting a Poisson Distribution. 1366. Probability Distributions of Continuous Variables . 1416.16.26.36.4Probability from the Probability Density Function . 141Expected Value and Variance . 149Extension: Useful Continuous Distributions . 155Extension: Reliability . 156vi
7. The Normal Distribution. 1577.17.27.37.47.57.67.77.8Characteristics . 157Probability from the Probability Density Function . 158Using Tables for the Normal Distribution . 161Using the Computer . 173Fitting the Normal Distribution to Frequency Data . 175Normal Approximation to a Binomial Distribution . 178Fitting the Normal Distribution to CumulativeFrequency Data . 184Transformation of Variables to Give a Normal Distribution . 1908. Sampling and Combination of Variables . 1978.18.28.38.4Sampling . 197Linear Combination of Independent Variables . 198Variance of Sample Means . 199Shape of Distribution of Sample Means:Central Limit Theorem . 2059. Statistical Inferences for the Mean. 2129.1Inferences for the Mean when Variance Is Known . 2139.1.1 Test of Hypothesis . 2139.1.2 Confidence Interval . 2219.2 Inferences for the Mean when Variance IsEstimated from a Sample . 2289.2.1 Confidence Interval Using the t-distribution . 2329.2.2 Test of Significance: Comparing a Sample Meanto a Population Mean . 2339.2.3 Comparison of Sample Means Using Unpaired Samples . 2349.2.4 Comparison of Paired Samples . 23810. Statistical Inferences for Variance and Proportion . 24810.1 Inferences for Variance . 24810.1.1 Comparing a Sample Variance with aPopulation Variance . 24810.1.2 Comparing Two Sample Variances . 25210.2 Inferences for Proportion . 26110.2.1 Proportion and the Binomial Distribution . 261vii
10.2.2 Test of Hypothesis for Proportion . 26110.2.3 Confidence Interval for Proportion . 26610.2.4 Extension . 26911. Introduction to Design of Experiments. 27211.111.211.311.411.5Experimentation vs. Use of Routine Operating Data . 273Scale of Experimentation . 273One-factor-at-a-time vs. Factorial Design . 274Replication . 279Bias Due to Interfering Factors . 279(a) Some Examples of Interfering Factors . 279(b) Preventing Bias by Randomization . 280(c) Obtaining Random Numbers Using Excel . 284(d) Preventing Bias by Blocking . 28511.6 Fractional Factorial Designs . 28812. Introduction to Analysis of Variance . 29412.112.212.312.4One-way Analysis of Variance . 295Two-way Analysis of Variance . 304Analysis of Randomized Block Design . 316Concluding Remarks . 32013. Chi-squared Test for Frequency Distributions . 32413.113.213.313.4Calculation of the Chi-squared Function . 324Case of Equal Probabilities . 326Goodness of Fit . 327Contingency Tables . 33114. Regression and Correlation . 34114.114.214.314.414.514.6Simple Linear Regression . 342Assumptions and Graphical Checks . 348Statistical Inferences . 352Other Forms with Single Input or Regressor . 361Correlation . 364Extension: Introduction to Multiple Linear Regression . 367viii
15. Sources of Further Information . 37315.1 Useful Reference Books . 37315.2 List of Selected References . 374Appendices . 375Appendix A: Tables . 376Appendix B: Some Properties of Excel UsefulDuring the Learning Process . 382Appendix C: Functions Useful Once theFundamentals Are Understood. 386Appendix D: Answers to Some of the Problems . 387Engineering Problem-Solver Index . 391Index . 393ix
[This is a blank page.]
PrefaceThis book has been written to meet the needs of two different groups of readers. Onone hand, it is suitable for practicing engineers in industry who need a better under standing or a practical review of probability and statistics. On the other hand, thisbook is eminently suitable as a textbook on statistics and probability for engineeringstudents.Areas of practical knowledge based on the fundamentals of probability andstatistics are developed using a logical and understandable approach which appeals tothe reader’s experience and previous knowledge rather than to rigorous mathematicaldevelopment. The only prerequisites for this book are a good knowledge of algebraand a first course in calculus. The book includes many solved problems showingapplications in all branches of engineering, and the reader should pay close attentionto them in each section. The book can be used profitably either for private study or ina class.Some material in earlier chapters is needed when the reader comes to some of thelater sections of this book. Chapter 1 is a brief introduction to probability andstatistics and their treatment in this work. Sections 2.1 and 2.2 of Chapter 2 on BasicProbability present topics that provide a foundation for later development, and so dosections 3.1 and 3.2 of Chapter 3 on Descriptive Statistics. Section 4.4, whichdiscusses representing data for a continuous variable in the form of grouped fre quency tables and their graphical equivalents, is used frequently in later chapters.Mathematical expectation and the variance of a random variable are introduced insection 5.2. The normal distribution is discussed in Chapter 7 and used extensively inlater discussions. The standard error of the mean and the Central Limit Theorem ofChapter 8 are important topics for later chapters. Chapter 9 develops the very usefulideas of statistical inference, and these are applied further in the rest of the book. Ashort statement of prerequisites is given at the beginning of each chapter, and thereader is advised to make sure that he or she is familiar with the prerequisite material.This book contains more than enough material for a one-semester or one-quartercourse for engineering students, so an instructor can choose which topics to include.Sections on use of the computer can be left for later individual study or class study ifso desired, but readers will find these sections using Excel very useful. In my opiniona course on probability and statistics for undergraduate engineering students shouldxi
include at least the following topics: introduction (Chapter 1), basic probability(sections 2.1 and 2.2), descriptive statistics (sections 3.1 and 3.2), grouped frequency(section 4.4), basics of random variables (sections 5.1 and 5.2), the binomial distribu tion (section 5.3) (not absolutely essential), the normal distribution (sections 7.1, 7.2,7.3), variance of sample means and the Central Limit Theorem (from Chapter 8),statistical inferences for the mean (Chapter 9), and regression and correlation (fromChapter 14). A number of other topics are very desirable, but the instructor or readercan choose among them.It is a pleasure to thank a number of people who have made contributions to thisbook in one way or another. The book grew out of teaching a section of a generalengineering course at the University of Saskatchewan in Saskatoon, and my approachwas affected by discussions with the other instructors. Many of the examples and theproblems for readers to solve were first suggested by colleagues, including RoyBillinton, Bill Stolte, Richard Burton, Don Norum, Ernie Barber, Madan Gupta,George Sofko, Dennis O’Shaughnessy, Mo Sachdev, Joe Mathews, Victor Pollak,A.B. Bhattacharya, and D.R. Budney. Discussions with Dennis O’Shaughnessy havebeen helpful in clarifying my ideas concerning the paired t-test and blocking.Example 7.11 is based on measurements done by Richard Evitts. Colleagues werevery generous in reading and commenting on drafts of various chapters of the book;these include Bill Stolte, Don Norum, Shehab Sokhansanj, and particularly RichardBurton. Bill Stolte has provided useful comments after using preliminary versions ofthe book in class. Karen Burlock typed the first version of Chapter 7. I thank all ofthese for their contributions. Whatever errors remain in the book are, of course, myown responsibility.I am grateful to my editor, Carol S. Lewis, for all her contributions in preparingthis book for publication. Thank you, Carol!W.J. DeCourseyDepartment of Chemical EngineeringCollege of EngineeringUniversity of SaskatchewanSaskatoon, SK, CanadaS7N 5A9xii
What’s on the CD-ROM?Included on the accompanying CD-ROM: a fully searchable eBook version of the text in Adobe pdf form data sets to accompany the examples in the text in the “Extras” folder, useful statistical software tools developed by theStatistical Engineering Division, National Institute of Science andTechnology (NIST). Once again, you are cautioned not to apply any tech nique blindly without first understanding its assumptions, limitations, andarea of application.Refer to the Read-Me file on the CD-ROM for more detailed information onthese files and applications.xiii
[This is a blank page.]
List of SymbolsA or A′A BA BB AE(X)f(x)fiinCn rPn rpp̂p(xi)Pr [.]qQ(f )ss2sc2sy2 xtcomplement of Aintersection of A and Bunion of A and Bconditional probabilityexpectation of random variable Xprobability density functionfrequency of result xiorder numbernumber of trialsnumber of combinations of n items taken r at a timenumber of permutations of n items taken r at a timeprobability of “success” in a single trialestimated proportionprobability of result xiprobability of stated outcome or eventprobability of “no success” in a single trialquantile larger than a fraction f of a distributionestimate of standard deviation from a sampleestimate of variance from a samplecombined or pooled estimate of varianceestimated variance around a regression lineinterval of time or space. Also the independent variable of thet-distribution.X (capital letter) a random variablex (lower case)a particular value of a random variablearithmetic mean or mean of a samplexzratio between (x – µ) and σ for the normal distributionαregression coefficientβregression coefficientλmean rate of occurrence per unit time or spaceµmean of a populationσstandard deviation of populationstandard error of the meanσxvariance of populationσ2xv
[This is a blank page.]
CHAPTER1Introduction:Probability and StatisticsProbability and statistics are concerned with events which occur by chance. Examplesinclude occurrence of accidents, errors of measurements, production of defective andnondefective items from a production line, and various games of chance, such asdrawing a card from a well-mixed deck, flipping a coin, or throwing a symmetricalsix-sided die. In each case we may have some knowledge of the likelihood of variouspossible results, but we cannot predict with any certainty the outcome of any particu lar trial. Probability and statistics are used throughout engineering. In electricalengineering, signals and noise are analyzed by means of probability theory. Civil,mechanical, and industrial engineers use statistics and probability to test and accountfor variations in materials and goods. Chemical engineers use probability and statis tics to assess experimental data and control and improve chemical processes. It isessential for today’s engineer to master these tools.1.1 Some Important Terms(a) Probability is an area of study which involves predicting the relative likeli hood of various outcomes. It is a mathematical area which has developedover the past three or four centuries. One of the early uses was to calculatethe odds of various gambling games. Its usefulness for describing errors ofscientific and engineering measurements was soon realized. Engineers studyprobability for its many practical uses, ranging from quality control andquality assurance to communication theory in electrical engineering. Engi neering measurements are often analyzed using statistics, as we shall seelater in this book, and a good knowledge of probability is needed in order tounderstand statistics.(b) Statistics is a word with a variety of meanings. To the man in the street it mostoften means simply a collection of numbers, such as the number of peopleliving in a country or city, a stock exchange index, or the rate of inflation.These all come under the heading of descriptive statistics, in which items arecounted or measured and the results are combined in various ways to giveuseful results. That type of statistics certainly has its uses in engineering, and1
Chapter 1we will deal with it later, but another type of statistics will engage ourattention in this book to a much greater extent. That is inferential statistics orstatistical inference. For example, it is often not practical to measure all theitems produced by a process. Instead, we very frequently take a sample andmeasure the relevant quantity on each member of the sample. We infersomething about all the items of interest from our knowledge of the sample.A particular characteristic of all the items we are interested in constitutes apopulation. Measurements of the diameter of all possible bolts as they comeoff a production process would make up a particular population. A sample isa chosen part of the population in question, say the measured diameters oftwelve bolts chosen to be representative of all the bolts made under certainconditions. We need to know how reliable is the information inferred aboutthe population on the basis of our measurements of the sample. Perhaps wecan say that “nineteen times out of twenty” the error will be less than acertain stated limit.(c) Chance is a necessary part of any process to be described by probabilityor statistics. Sometimes that element of chance is due partly or even perhapsentirely to our lack of knowledge of the details of the process. For example,if we had complete knowledge of the composition of every part of the rawmaterials used to make bolts, and of the physical processes and conditions intheir manufacture, in principle we could predict the diameter of each bolt.But in practice we generally lack that complete knowledge, so the diameterof the next bolt to be produced is an unknown quantity described by arandom variation. Under these conditions the distribution of diameters can bedescribed by probability and statistics. If we want to improve the quality ofthose bolts and to make them more uniform, we will have to look into thecauses of the variation and make changes in the raw materials or the produc tion process. But even after that, there will very likely be a random variationin diameter that can be described statistically.Relations which involve chance are called probabilistic or stochastic rela tions. These are contrasted with deterministic relations, in which there is noelement of chance. For example, Ohm’s Law and Newton’s Second Lawinvolve no element of chance, so they are deterministic. However, measure ments based on either of these laws do involve elements of chance, sorelations between the measured quantities are probabilistic.(d) Another term which requires some discussion is randomness. A randomaction cannot be predicted and so is due to chance. A random sample is onein which every member of the population has an equal likelihood of appear ing. Just which items appear in the sample is determined completely bychance. If some items are more likely to appear in the sample than others,then the sample is not random.2
Introduction: Probability and Statistics1.2 What does this book contain?We will start with the basics of probability and then cover descriptive statistics. Thenvarious probability distributions will be investigated. The second half of the bookwill be concerned mostly with statistical inference, including relations between twoor more variables, and there will be introductory chapters on design and analysis ofexperiments. Solved problem examples and problems for the reader to solve will beimportant throughout the book. The great majority of the problems are directlyapplied to engineering, involving many different branches of engineering. They showhow statistics and probability can be applied by professional engineers.Some books on probability and statistics use rigorous definitions and many deriva tions. Experience of teaching probability and statistics to engineering students has ledthe writer of this book to the opinion that a rigorous approach is not the best plan.Therefore, this book approaches probability and statistics without great mathematicalrigor. Each new concept is described clearly but briefly in an introductory section. In anumber of cases a new concept can be made more understandable by relating it toprevious topics. Then the focus shifts to examples. The reader is presented with care fully chosen examples to deepen his or her understanding, both of the basic ideas andof how they are used. In a few cases mathematical derivations are presented. This isdone where, in the opinion of the author, the derivations help the reader to understandthe concepts or their limits of usefulness. In some other cases relationships are verifiedby numerical examples. In still others there are no derivations or verifications, but thereader’s confidence is built by comparisons with other relationships or with everydayexperience. The aim of this book is to help develop in the reader’s mind a clear understanding of the ideas of probability and statistics and of the ways in which they areused in practice. The reader must keep the assumptions of each calculation clearly inmind as he or she works through the problems. As in many other areas of engineering,it is essential for the reader to do many problems and to understand them thoroughly.This book includes a number of computer examples and computer exerciseswhich can be done using Microsoft Excel . Computer exercises are included be cause statistical calculations from experimental data usually require many repetitivecalculations. The digital computer is well suited to this situation. Therefore a bookon probability and statistics would be incomplete nowadays if it did not includeexercises to be done using a computer. The use of computers for statistical calcula tions is introduced in sections 3.4 and 4.5.There is a danger, however, that the reader may obtain only an incompleteunderstanding of probability and statistics if the fundamentals are neglected in favorof extensive computer exercises. The reader should certainly perform several of themore basic problems in each section before doing the ones which are marked ascomputer problems. Of course, even the more basic problems can be performed usinga spreadsheet rather than a pocket calculator, and that is often desirable. Even if aspreadsheet is used, some of the simpler problems which do not require repetitive3
Chapter 1calculations should be done first. The computer problems are intended to help thereader apply the fundamental ideas in conjunction with the computer: they are not“black-box” problems for which the computer (really that means the original pro grammer) does the thinking. The strong advice of many generations of engineeringinstructors applies here: always show your work!Microsoft Excel has been chosen as the software to be used with this book for tworeasons. First, Excel is used as a general spreadsheet by many engineers and engi neering students. Thus, many readers of this book will already be familiar with Excel,so very little further time will be required for them to learn to apply Excel to prob ability and statistics. On the other hand, the reader who is not already familiar withExcel will find that the modest investment of time required to become reasonablyadept at Excel will pay dividends in other areas of engineering. Excel is a veryuseful tool.The second reason for choosing to use Excel in this book is that current versionsof Excel include a good number of special functions for probability and statistics.Version 4.0 and later versions give at least fifty functions in the Statistical category,and we will find many of them useful in connection with this book. Some of thesefunctions give probabilities for various situations, while others help to summarizemasses of data, and still others take the place of statistical tables. The reader iswarned, however, that some of these special functions fall in the category of “black box” solutions and so are not useful until the reader understands the fundamentalsthoroughly.Although the various versions of Excel all contain tools for performing calcula tions for probability and statistics, some of the detailed procedures have beenmodified from one version to the next. The detailed procedures in this book aregenerally compatible with Excel 2000. Thus, if a reader is using a different version,some modifications will likely be needed. However, those modifications will notusually be very difficult.Some sections of the book have been label
one hand, it is suitable for practicing engineers in industry who need a better under standing or a practical review of probability and statistics. On the other hand, this book is eminently suitable as a textbook on statistics and probability for engineering students. Areas of practic

