Transcription
4 – Will robots steal our jobs?The potential impact of automationon the UK and other major economies1Key points Our analysis suggests that up to 30%of UK jobs could potentially be athigh risk of automation by the early2030s, lower than the US (38%) orGermany (35%), but higher thanJapan (21%). The risks appear highest in sectorssuch as transportation and storage(56%), manufacturing (46%)and wholesale and retail (44%),but lower in sectors like healthand social work (17%). For individual workers, the keydifferentiating factor is education.For those with just GCSE-leveleducation or lower, the estimatedpotential risk of automation is ashigh as 46% in the UK, but this fallsto only around 12% for those withundergraduate degrees or higher. However, in practice, not all of thesejobs may actually be automated fora variety of economic, legal andregulatory reasons.130 Furthermore new automationtechnologies in areas like AI androbotics will both create some totallynew jobs in the digital technologyarea and, through productivitygains, generate additional wealthand spending that will supportadditional jobs of existing kinds,primarily in services sectors thatare less easy to automate. The net impact of automation ontotal employment is thereforeunclear. Average pre-tax incomesshould rise due to the productivitygains, but these benefits may not beevenly spread across income groups. There is therefore a case for someform of government intervention toensure that the potential gains fromautomation are shared more widelyacross society through policies likeincreased investment in vocationaleducation and training. Universalbasic income schemes may also beconsidered, though these sufferfrom potential problems in termsof affordability and adverse effectson the incentives to work andgenerate wealth.IntroductionThe potential for job losses due toadvances in technology is not a newphenomenon. Most famously, theLuddite protest movement of the early19th century was a backlash by skilledhandloom weavers against themechanisation of the British textileindustry that emerged as part of theIndustrial Revolution (including theJacquard loom, which with its punchcard system was in some respects aforerunner of the modern computer).But, in the long run, not only were therestill many (if, on average, less skilled)jobs in the new textile factories but,more importantly, the productivity gainsfrom mechanisation created huge newwealth. This in turn generated manymore jobs across the UK economy in thelong run than were initially lost in thetraditional handloom weaving industry.The standard economic view for mostof the last two centuries has thereforebeen that the Luddites were wrongabout the long-term benefits of thenew technologies, even if they wereright about the short-term impact ontheir personal livelihoods. Anyone puttingsuch arguments against new technologieshas generally been dismissed as believingin the ‘Luddite fallacy’.This article was written by Richard Berriman, a machine learning specialist and senior consultant in PwC’s Data Analytics practice, and John Hawksworth,chief economist at PwC. Additional research assistance was provided by Christopher Kelly and Robyn Foyster.UK Economic Outlook March 2017
However, over the past few years, fearsof technology-driven job losses havere-emerged with advances in ‘smartautomation’ – the combination of AI,robotics and other digital technologiesthat is already producing innovationslike driverless cars and trucks, intelligentvirtual assistants like Siri, Alexa andCortana, and Japanese healthcare robots.While traditional machines, includingfixed location industrial robots, replacedour muscles (and those of other animalslike horses and oxen), these new smartmachines have the potential to replaceour minds and to move around freely inthe world driven by a combination ofadvanced sensors, GPS tracking systemsand deep learning, if not now thenprobably within the next decade or two.Will this just have the same effects aspast technological leaps – short termdisruption more than offset by long termeconomic gains – or is this something morefundamental in terms of taking humansout of the loop not just in manufacturingand routine service sector jobs, but morebroadly across the economy? What exactlywill humans have to offer employersif smart machines can perform all ormost of their essential tasks better inthe future2? In short, has the Ludditefallacy finally come true?This debate was given added urgencyin 2013 when researchers at OxfordUniversity (Frey and Osborne, 2013)estimated that around 47% of total USemployment had a “high risk ofcomputerisation” over the next coupleof decades – i.e. by the early 2030s.However, there are also dissenting voices.Notably, Arntz, Gregory and Zierahn(OECD, 2016) last year re-examined theresearch by Frey and Osborne and, usingan extensive new OECD data set, cameup with a much lower estimate that onlyaround 10% of jobs were under a “highrisk3 of computerisation”. This is based onthe reasoning that any predictions of jobautomation should consider the specifictasks that are involved in each job ratherthan the occupation as a whole.In this article we present the findingsfrom our own analysis of this topic,which builds on the research of bothFrey and Osborne (hereafter ‘FO’)and Arntz, Gregory and Zierahn(hereafter ‘AGZ’). We then go on todiscuss caveats to these results in termsof non-technological constraints onautomation and potential offsettingjob creation elsewhere in the economy(though this is much harder to quantify).The discussion is structured as follows:Section 4.1What proportion of jobsare potentially at highrisk of automation?Section 4.2Which industry sectorsand types of workers couldbe at the greatest risk ofautomation in the UK?Section 4.3Why does the potentialrisk of job automationvary by industry sector?Section 4.4How does the UK compareto other major economies?Section 4.5What economic, legal andregulatory constraintsmight reduce automationin practice?Section 4.6What offsetting joband income gains mightautomation generate?Section 4.7What implications mightthese trends have forpublic policy?Section 4.8Summary andconclusions.Further details of the methodologybehind our analysis in Sections 4.1-4.4are contained in a technical annex atthe end of this article, together withreferences to the other books andstudies cited.23Martin Ford, The Rise of the Robots (Oneworld Publications, 2015) is one particularly influential example of an author setting out this argument in detail.In both studies, this is defined as an estimated probability of 70% or more. For comparability, we adopt the same definition of ‘high risk’ in this article.UK Economic Outlook March 201731
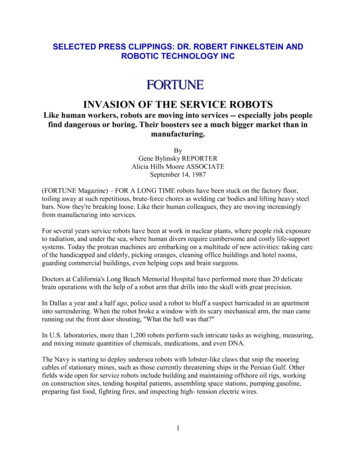
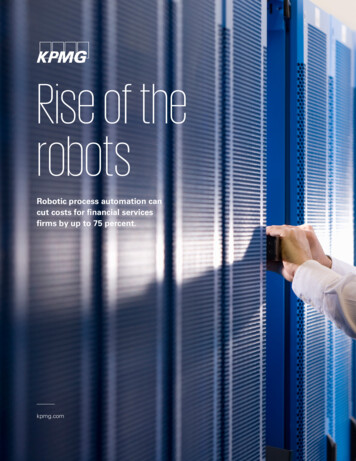
In the present article, we start byrevisiting the sharply contrasting resultsof FO and AGZ, who estimate respectivelythat around 47% and 9% of jobs in the US,and around 35%4 and 10% of jobs inthe UK are at high risk of automationby, broadly speaking, the early 2030s(see Figure 4.1).The AGZ study explains the differenceas the result of a shift from the occupationbased approach of FO to the task-basedapproach adopted in their own study.In the original study by FO, a sampleof occupations taken from O*NET,an online service developed for theUS Department of Labour, were handlabelled by machine learning experts asstrictly automatable or not automatable.Using a standardised set of features ofan occupation, FO were then able to usea machine learning algorithm to generatea ‘probability of computerisation’ acrossUS jobs, but crucially they generatedonly one prediction per occupation.By assuming the same risk in matchingoccupations, FO were also able to obtainestimates for the UK (other authors havealso applied this approach to deriveestimates for other countries).AGZ argue, drawing on earlier researchby labour market economists such asDavid Autor5, that it is not wholeoccupations that will be replaced bycomputers and algorithms, but onlyparticular tasks that are conductedas part of that occupation.45632Figure 4.1 – What proportion of jobs are potentially at high risk of automation?50% of potential jobs at high riskof automation4.1 – What proportion ofjobs are potentially athigh risk of : PwC analysis; FO; AGZFurthermore, the same occupationmay be more or less susceptible toautomation in different workplaces.Using the same outputs from the FOstudy, AGZ conducted their analyseson the recently compiled OECD PIAACdatabase that surveys task structures forindividuals across more than 20 OECDcountries. This includes much moredetailed data on the characteristics ofboth particular jobs and the individualsdoing them than was available to FO.While recognising the differences inapproach, it is still surprising that AGZobtain results which differ so muchfrom those of FO, bearing in mind thatthey started from a similar assessmentof occupation-level automatability.We therefore conducted our ownanalyses of the same OECD PIAACdataset as used in the AGZ study.We first replicated the AGZ study findings,but then subsequently enhanced theapproach through using additional dataand developing our own machine learningalgorithm for identifying automation risk6.Our findings offer some support for AGZ’sconclusion that taking into account thetasks required to be carried out withineach worker’s occupation diminishesthe proposed impact of job automationsomewhat relative to the FO results.Nevertheless, we conclude that theparticular methodology used by AGZover-exaggerated this mitigatingeffect significantly.Haldane (2015) cites a Bank of England estimate of around this level for the UK based on their version of the FO analysis. This is also in line with other estimates by FOthemselves for the UK.For example, Autor (2015).See Annex for technical details of the methodology used.UK Economic Outlook March 2017
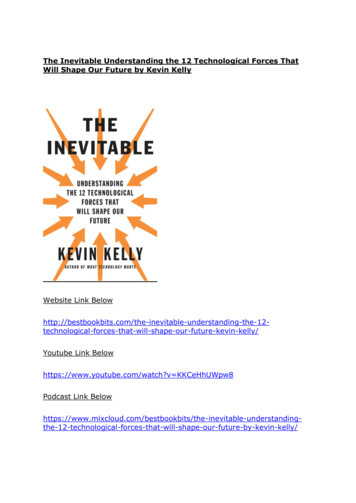
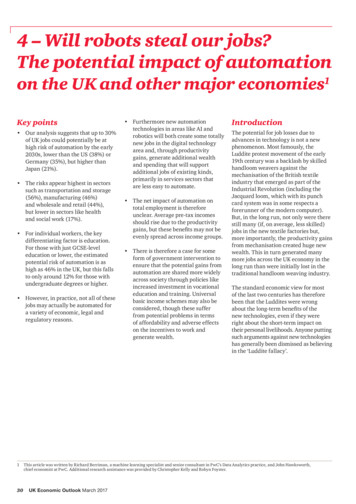
Figure 4.2 – Potential jobs at high risk of automation by country% of potential jobs at high riskof es: ONS; PIAAC data; PwC analysisSpecifically, based on our own preferredmethodology, we found that around30% of jobs in the UK are at potentialhigh risk of automation and around38% in the US. These estimates arebased on an algorithm linkingautomatability to the characteristics ofthe tasks involved in different jobs aswell as those of the workers doing them(e.g. the education and training levelsrequired). Our estimates are somewhatlower than the original estimates by FO,but still much closer to those than to the9-10% estimates of AGZ (see Figure 4.1).7Intuitively, the main reason for thisis because the specific approach usedby AGZ biased their results towardsjobs having only a moderate risk ofautomation, but we found that this wasmore an artefact of their methodologythan a true representation of the data(see Annex for more technical detailsof why we reach this conclusion).Our algorithm could also be appliedto other OECD countries in the PIAACdatabase. For the purpose of the currentarticle, we focus on the results for theUK, US, Germany and Japan7. We foundthat both the US and Germany have anincreased potential risk of job automationcompared to the UK, whilst Japan has adecreased potential risk of job automation(see Figure 4.2). These reasons forthese differences are explore furtherin Section 4.4 below.Before exploring our results in moredetail, we want to stress one importantcaveat that applies both to our resultsand those of FO and AGZ. This is thatthese are estimates of the potentialimpact of job automation based onanticipated technological capabilitiesof AI/robotics by the early 2030s.Not only is the pace of technologicaladvance, and so the timing of theseeffects uncertain, but more importantly: not all of these technologicallyfeasible job automations may occurin practice for the economic, legaland regulatory reasons discussedin Section 4.5 below; and even if these potential job losses domaterialise, they are likely to be offsetby job gains elsewhere as discussed inSection 4.6 below – the net long-termeffect on total human employmentcould be either positive or negative.Unfortunately, it is much more difficultto quantify the effects of these caveats,particularly at the industry level, in partbecause the second one involves newtypes of jobs being created that do noteven exist now. In contrast, we can tryto quantify and analyse the number ofjobs at potential high risk of automationby country, industry sector and type ofworker as discussed below. But, ininterpreting these results, we shouldnever lose sight of these two key caveats.We also produced estimates for South Korea, but the results – both in aggregate and for particular industry sectors – were very similar to those for Japan, so we donot report them here for reason of space. AGZ also estimated very similar risks for Japan and South Korea, albeit with lower risk levels than our estimates due tothe different methodology they applied to essentially the same data set.UK Economic Outlook March 201733
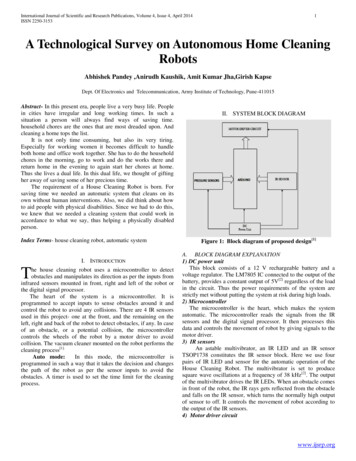
4.2 – Which industrysectors and types ofworkers could be at thegreatest potential risk ofautomation in the UK?If, for the sake of illustration, we applyour 30% estimate from the previoussection to the current number of jobsin the UK8, then we might conclude(subject to the caveats noted above)that several million jobs could potentiallybe at high risk of automation in the UK.Broken down by industry, over half ofthese potential job losses are in four keyindustry sectors: wholesale and retailtrade, manufacturing, administrativeand support services, and transportand storage (see Table 4.1 and Figure 4.3for details).Figure 4.3 – Potential jobs at high risk of automation by UK industry sector10.43Total UK job automation2.25Wholesale and retail trade1.22Manufacturing1.09Administrative and support service0.95Transportation and stoage0.78Professional, scientific and technical0.73Human health and social work0.59Accomodation and food service0.52Construction0.47Public administration and defence0.39Information and communication0.35Financial and insurance0.26Education0.83Other024681012UK jobs at high risk of automation (millions)Sources: ONS; PIAAC data; PwC analysis834In practice, the total number of jobs in the UK is likely to be higher by the early 2030s, which is the approximate date by which we (and FO/AGZ) assume these potentialjob losses from automation might occur. But, since we do not have detailed job projections that far ahead, we present some illustrative estimates using current data(for 2016) instead.UK Economic Outlook March 2017
Instead the highest potential impact onUK jobs is in the wholesale and retailtrade sector, with around 2.3 millionjobs at potential high risk of automation(22% of all UK jobs estimated to be athigh risk) given that this is the largestsingle sector in terms of numbers ofemployees. Manufacturing has a similarproportion of current jobs at potentialhigh risk (46%), but lower total numbersat high risk of around 1.2 million due toit being a smaller employer. A further0.7 million jobs could be at potentialhigh risk of automation in human healthand social work, but this is a much lowerproportion of all jobs in that sector(around 17%).Figure 4.4 – Potential impact of job automation by UK industry sector70% of potential jobs at high riskof automation by sectorThe magnitude of potential job losses bysector is driven by two main components:the proportion of jobs in a sector weestimate to have potential high risk ofautomation, and the employment share ofthat sector (see Figure 4.4 and Table 4.1).The industry sector that we estimate couldface the highest potential impact of jobautomation is the transportation andstorage sector, with around 56% of jobsat potential high risk of automation.However, this sector only accounts foraround 5% of total UK jobs, so theestimated number of jobs at potential highrisk is around 1 million, or around 9%of all potential job losses across the UK.60Transportationand storage50Manufacturing40Financialand insurance30Information andcommunication20Public administrationand defenceAccommodationand foodConstructionserviceProfessional,scientificand technicalHuman healthand social work100Wholesaleand retail tradeAdministrativeand support serviceEducation05101520Employment share by sector (%)Sources: ONS; PIAAC data; PwC analysisTable 4.1 – Employment shares, estimated proportion and total number of employeesat potential high risk of automation for all UK industry sectorsIndustryWholesale and retail tradeEmploymentshare (%)Job automation Jobs at high risk(% at potential of automationhigh %1.22Administrative and support services8.4%37.4%1.09Transportation and storage4.9%56.4%0.95Professional, scientific and technical8.8%25.6%0.78Human health and social work12.4%17.0%0.73Accommodation and food c administration and defence4.3%32.1%0.47Information and communication4.1%27.3%0.39Financial and insurance3.2%32.2%0.35Education8.7%8.5%0.26Arts and entertainment2.9%22.3%0.22Other services2.7%18.6%0.17Real estate1.7%28.2%0.16Water, sewage and waste management0.6%62.6%0.13Agriculture, forestry and fishing1.1%18.7%0.07Electricity and gas supply0.4%31.8%0.05Mining and quarrying0.2%23.1%0.01Domestic personnel and self-subsistence0.3%8.1%0.01Total for all sectors100%30%10.4Sources: ONS for employment shares (2016); PwC estimates for last two columns using PIAAC dataUK Economic Outlook March 201735
Which types of UK workers may bemost affected by automation?The potential impact of job automationalso varies according to the characteristicsof the workers. On average, we find thatmen and, in particular, those with lowerlevels of education (GCSE-level andequivalent only or lower) are at greater riskof job automation. This is characteristic ofthe sectors that are at highest estimatedrisk. For example, the transportation andstorage, manufacturing, and wholesaleand retail trade sectors have a relativelyhigh proportion of low educationemployees (34%, 22%, and 28%respectively). Men also make up the greatmajority of the workforce in the first twoof these sectors (85% and 73%).We also estimate that private sectoremployees and particularly those inSMEs are most at risk, which is linkedto variations in job and employeecharacteristics (e.g. education andtraining levels required).Table 4.2 – Employment shares, estimated proportion and total number of employeesat potential high risk of automation by UK worker characteristicsWorker characteristicsEmploymentshare (%)Gender:Female46%26%4.1Male54%35%6.3Low education (GCSE level or lower)19%46%3.0Medium education51%36%6.2High education (graduates)30%12%1.2Education:Sources: PwC estimates using PIAAC dataTable 4.3 – Estimated proportionof employees at potential high riskof automation by UK employercharacteristicsEmployercharacteristicsJob automation(% at potentialhigh risk)Public sector22%Private sector34%Employees: 1130%11-100032%1000 24%Sources: PwC estimates using PIAAC data36UK Economic Outlook March 2017Job automation Jobs at potential(% at potentialhigh risk ofhigh risk)automation(millions)
4.3 – Why does potentialrisk of job automationvary by industry sector?Task compositionOne of the main drivers of a job being atpotential high risk of automation is thecomposition of tasks that are conducted.Workers in high automation risk industriessuch as transport and manufacturingspend a much greater proportion of theirtime engaged in manual tasks that requirephysical exertion and/or routine tasks suchas filling forms or solving simple problems.In contrast, in lower automation riskindustries such as education, there is anincreased focus on social and literacy skills,as shown in Figure 4.5, which arerelatively less automatable9.Figure 4.5 – Task composition for UK employees in transportation and storage, manufacturing, and education industry sectorsTransportation and 22%20%19%27%7%33%Compared to UK average (%)59Computation87Management050Routine 0200050144Social skills64Literacy skills10090110Social skills5169Manual tasksRoutine tasksManagement68Social skillsLiteracy skillsCompared to UK average (%)131Manual tasks127Routine tasks12%Compared to UK average (%)143Manual tasks22%13%38%179Literacy skills100150200050100150200Sources: PIAAC data; PwC analysis9Although the considerable growth of e-learning shows that there is scope for automation in education, this may widen access to courses rather than replacing humanteachers altogether. For a discussion of how UK universities can prosper in a digital age, see this age.pdfUK Economic Outlook March 201737
Figure 4.6 – Task composition comparison for UK employees in wholesale and retail trade, and human health and social workindustry sectorsWholesale and retail tradeIncreased task share in humanhealth vs wholesaleHuman health and social work2%14%4%14%18%-3Manual tasksRoutine tasks0Computation0-4Management26%18%4Social skills31%31%22%3Literacy skills-10-5051010%10%Sources: PIAAC data; PwC analysisTask composition of jobs is not, however,the only driver of high automation risk.In the two largest sectors by employmentshare - wholesale and retail trade andhuman health and social work - there arebroadly comparable task compositions(see Figure 4.6). However, the proportionof jobs at potential high risk of automationis over 2.5x greater in the wholesaleand retail trade (44%) than for healthand social work (17%).Instead differences in job requirementsare the main factors that cause the riskof automation to differ between thesetwo sectors, mostly significantly asregards education.On the whole, education requirementsare higher in the human health andsocial work sector, with more than twicethe proportion of employees having higheducation levels (i.e. degree level orhigher): 33% compared with 15% inwholesale and retail. Health and socialwork also has much lower proportionsof low education workers (i.e. GCSElevel or lower): 11% compared with 28%in wholesale and retail (see Figure 4.7).38UK Economic Outlook March 2017Figure 4.7 – Potential impact of job automation by education level for UK employeesin wholesale and retail trade, and human health and social work industry sectors60575650% of potential jobs athigh risk of automationWorker and job characteristics40333028201015110Low education(GCSE level or lower)Wholesale and retail tradeSources: PIAAC data; PwC analysisMedium EducationHuman health and social workHigh education(graduates)
Table 4.4 – Job characteristics for UK employees in wholesale and retail trade,and human health and social work industry sectorsWholesale andretail tradeHuman healthand social workNationalaverageRequired 1 year work experience32%48%47%High educational job requirements14%44%33%More training required at work14%29%21%Moderate/complex computer use at work51%61%68%Feel challenged at work11%15%12%Responsible for staff30%41%35%Co-operate with others 25% of the time73%77%70%Sources: PIAAC data; PwC analysisThe difference in education levels is alsoreflected in the job characteristics foremployees in the health and social worksector. There is a much higher proportionof employees that need work experienceprior to employment, have highereducational requirements in theircurrent role, and are engaged inmore training at work (see Table 4.4).A more detailed examination of theoccupations in both sectors also revealsthat a higher proportion of occupations inhealth and social work are jobs that are farless automatable than in wholesale andretail trade. In particular, sales workersthat comprise the majority of employmentshare in the wholesale and retail tradesector have twice the job automationpotential (38%) compared with personalcare workers in the human health andsocial work sector (18%).The human health and social work sectoralso has a high proportion of employees(23%) in health professional or healthassociate professional occupations,which have particularly low automationpotential according to our methodology.Advances we have seen in recent years inJapan in healthcare robots might suggestsome of these model estimates couldprove too low as this technology developsfurther and spreads to the UK, althoughsome of these may be working withrather than replacing human workers.Similarly surgeons may be able to conductoperations remotely now using digitallycontrolled robotics, but (at least for themoment) we are some way from robotsurgeons carrying out operations unaided.4.4 – How does the UKcompare to other majoreconomies?As shown in Figure 4.2 earlier in thisarticle, we estimate that there is a greaterpotential impact of job automation in theUS (38%) and Germany (35%) comparedto the UK (30%), but a decreased potentialimpact in Japan (21%). As with the UK,the potential impact of job automationin other countries is driven by theindustry composition of the country(i.e. the employment shares acrosssectors) and the relative proportion ofjobs at high risk of automation in eachof those sectors. However, a greaterproportion of the variation betweencountries is explained by differences inthe automatability of jobs within sectors.UK Economic Outlook March 201739
We find that the larger proportion ofjobs at potential high risk of automationin the US is almost exclusively driven bydifferences in the automatability of jobsfor given industry sectors. The US has asimilarly service-dominated economyto the UK with relatively little differencein employment shares by industry sector(see middle panel of Figure 4.8). However,several important industry sectorsshow significantly higher potential jobautomation risks in the US than in theUK (see bottom panel in Figure 4.8).Figure 4.8 – Comparison of potential jobs at high risk of automation between UKand USUK vs US50% of potential jobs athigh risk of automationWhy is the estimated risk of jobautomation higher in the US thanthe UK?3030038UK jobautomationImpact of industrycompositionImpact ofautomationUS jobautomation20100US employment share relative to UK (%)-1Wholesale and retail tradeThe most significant example hereis the financial and insurance sector,where automatability is assessed to bemuch higher in the US (61%) than theUK (32%). Further analysis of the datasuggests that the key difference is relatedto the average education levels of financeprofessionals being significantly higherin the UK than the US. This may reflectthe greater weight in the UK of City ofLondon finance professionals working ininternational markets, whereas in the USthere is more focus on the domestic retailmarket and many more workers who donot need to have the same educationallevels. The jobs of these US retailfinancial workers are assessed by ourmethodology as being significantly moreroutine – and so more automatable – thenthe average finance sector job in the UK,with its greater weight on internationalfinance and investment banking.8400Manufacturing1Administrative and support serviceTransportation and storage-2Professional, scientific and technical-21Human health and social work2Accommodation and food serviceConstruction0Public administration and defence0Information and communication01Financial and insurance-1Education0Arts and entertainment-40-30-20-10010203Wholesale and retail trade6Manufacturing-2Administrative and support service20Transportation and storage7Professional, scientific and technical8Human health and social work1911Construction1Public administration and defence18Information and communication29Financial and insurance3Education-5Arts and entertainment-40Sources: PIAAC data; PwC analysisUK Economic Outlook March 201740US job automatability relative to UK (%)Accommodation and food service4030-30-20-10010203040
In Germany, by contrast, the greaterproportion of jobs at potential high riskof automation is driven by broadlysimilar sized impacts from both industrycomposition and job automatability bysector (see Figure 4.9). In particular,Germany has a higher share ofemployment in the manufacturing sectorthan the UK, and manufacturing hasa relatively large proportion of jobs athigh risk of automation. At the individualsector level, relative automatabilitylevels are varied, but on average higherin Germany.Figure 4.9 – Comparison of potential jobs at high risk of automation between UKand GermanyUK vs Germany50% of potential jobs athigh risk of automationWhy is the estimated risk of jobautomation higher in Germanythan the UK?4030302UK jobautomationImpact of industrycomposition335Impact ofautomationGerman jobautomation20100German employment share relative to UK (%)0Wholesale and retail trade11ManufacturingThis is most marked for construction,where the proportion of jobs at highrisk of automation is estimated at 41%in Germany but only 24% in the UK.The main difference is that for thoseworking in building and related tradesin Germany, 60% of all tasks are eithermanual or routine, while in the UK theseaccount for only 48% of tasks. Insteadthere is a greater proportion of timespent on management tasks in the UK,such as planning and consulting others,and those that require social skills suchas negotiating.UK construction workers are thereforeclassified as being less automatable onaverage than their German counterparts.Any automation in the constructionsector will require major advances inmobile robotics by the early 2030s if ourestimates are to prove reliable. It is alsounclear here, as in many other sectors,how far these kind of constructionrobots will work alongside humanworkers, complementing and enhancingtheir productivity, rather than replacingthem totally. At the very least, there maybe a long-lasting intermediate stage inthe use of robots in construction andother sectors involving manual tas
2 Martin Ford, The Rise of the Robots (Oneworld Publications, 2015) is one particularly influential example of an author setting out this argument in detail. 3 In both studies, this is defined as an estimated probability of 70% or more. For comparability, we