Transcription
OLAP Cubes 101:An Introduction to Business Intelligence Cubes
OLAP Cubes 101:An Introduction to Business Intelligence CubesOLAP Cubes 101Page 3Clear the Tables Page 4Embracing CubismPage 5Everybody Loves CubesPage 6Cubes in Action Page 7Cube TerminologyPage 9Correcting Mis-cube-ceptionsPage 10
OLAP Cubes 101:An Introduction to Business Intelligence CubesJet Reports www.jetreports.comOLAP Cubes 101:An Introduction to Business Intelligence CubesIt’s a data-driven world; we just live in it.In today’s fast-paced, hypercompetitive business environment, having near-instantaneousaccess to the data can be the difference between a wildly successful organization and onethat goes belly up. The importance of business intelligence is significant: companies whoutilize analytics to drive decision making are 5x more likely to make decisions faster1.Business intelligence begins and ends with data—not just how the data is collected, butalso how it’s stored, organized and accessed. Whether we know it or not, most of ususe databases in our daily lives: ERP systems, SQL databases, CRM systems and evenExcel files that are cobbled together in a rudimentary “database”. These databases arewonderful for collecting and storing information, but not always so great at showing thatdata in a meaningful or actionable way when the situation calls for in-depth analysis. Thisis because these varieties of databases are designed to get data ENTERED in the mostefficient manner—frequently creating headaches when data-driven business leaders try toEXTRACT insights from that data.In this guide, we’ll explore how your databases are failingyou—and how OLAP cubes are enabling employeesto identify and access the data they need to drive truebusiness ss-intelligence-stats/3
OLAP Cubes 101:An Introduction to Business Intelligence CubesJet Reports www.jetreports.comClear the TablesDatabases frequently store information in hundreds or thousands of disparate tables whichrelate to each other in sometimes esoteric ways (imagine the most complicated Excelspreadsheet you’ve ever witnessed). To report on that data, in a sales-by-salespersonreport, for example, we must understand the relationships between these tables and theirdependencies. We take the salesperson’s name from the ‘Salesperson’ table, the items soldfrom the ‘Sales Transactions’ table, the product description from the ‘Product’ table, and soon, until a report that paints the entire picture is reached.This process of building reports from multiple tables can be time-consuming and tedious, ifnot utterly impossible—particularly for non-technical staff. Table-based reporting routinelycauses performance issues as well, particularly with large data sets. According to InformationWeek magazine, “In spite of performance tuning capabilities, it is still too easy to losecontrol of performance [when dealing with tables].”So, how are OLAP cubes improving data hierarchy?4
Embracing CubismLet’s start by stating what cubes are NOT: cubes are notrelational databases. Microsoft Dynamics NAV, AX, GP andSQL are all examples of relational databases. Relationaldatabases include tables and fields which are joined togetherby keys. Relational databases are perfectly useful – in manycases, we couldn’t run our businesses without them. However,relational databases are optimized to get information intoa system in a cohesive manner—they aren’t optimized forgetting the information out.In simple terms, cubes are multi-dimensional sections of databuilt from tables in your database. They contain calculationsand formulae and are often grouped around specific businessfunctions; one cube for sales, one for purchasing, another forinventory, and so on, with each cube containing contextual,pertinent, and useful metrics for that particular area of thebusiness.Cubes are a tremendous benefit because of the way theyare structured: the heavy lifting is already done through precalculation. When you want to get answers from your data,instead of searching multiple tables in your database(s), yourrequest goes directly to the appropriate cube. Reports thatused to take 5 minutes or more to generate are now assembledin seconds, and end users no longer need to understand thecomplex web of references tying multiples tables together.When organizations start to collect data in multiple databases,the size of the data sets grows exponentially. Running astandard query against large data sets causes seriousperformance issues which not only sacrifice productivitybut can lead to users abandoning reports altogether. Whenthis happens, important insights are discarded because thebusiness users simply do not have the time for the data to becompiled. When utilizing cubes, whether looking at yesterday’ssales transactions or sales over the past 5 years, it takes thesame amount of time to run your reports – just a few secondsin most cases – thanks to the power of pre-calculating thevalues.5
Everybody Loves CubesIf you’re hoping to roll out business intelligence for your salesteam or purchasing department, business intelligence cubesare the way to go. Cubes are designed to allow non-technicalusers to choose from any number of role-specific and highlycontextual data points to uncover new insights and adjusttactics and decisions on the fly. Chances are good thatyour average non-technical sales rep or purchasing agentwill have difficulty joining multiple tables together with astandard report, but with business intelligence cubes, allthat’s required drag and drop the metrics and dimensionsthat matter to them into their own personalized dashboard. ITteams appreciate cube environments too because end userslearn to create their own reports – freeing up the technicalstaff to do, well, technical things.Simplicity and user friendliness are what gets departmentsand companies on board with business intelligence. Inmany cases this kind of wide user adoption can spur a datarevolution within a company as more and more managers rely“Cubes help regular businessusers like us take advantageof all the money we’ve spenton data collection and storage.Now we can use the data to runour business more efficientlyand effectively without havingto enlist or tie up high-valueresources like developers,specialists, programmersand the IT department. Thisis putting the power to makedecisive ‘game changing’decisions back in our ownhands at a fraction of the cost ofpast lengthy, manual, and timeconsuming processes, if we hadaccess to the data at all.”- Mat Ealy,Jet Enterprise customeron these systems to help them make fact-based decisions.6
OLAP Cubes 101:An Introduction to Business Intelligence CubesJet Reports www.jetreports.comCubes in ActionTo demonstrate the effectiveness of OLAP Cubes, let’s look at a hypothetical situation:Imagine you’re a global sno-cone conglomerate wondering how much profit was made onsno-cones you sold in a particular country (say, Iceland) in a particular year.To answer that question with a relational database, the information you require is scatteredacross many different tables. In a Dynamics NAV database, to answer this question youmay need to combine data from:Customer TableItem TableSales Invoice HeaderCountry/Region TableSales Invoice LineSales Credit Memo LineSales Credit Memo HeaderOnce you’ve identified where the data is located, it must be extracted and mashed up toprovide a reasonable facsimile of the information that you need. Combining the informationfrom multiple data streams in the way you want can be a slow and resource-intensiveprocess.7
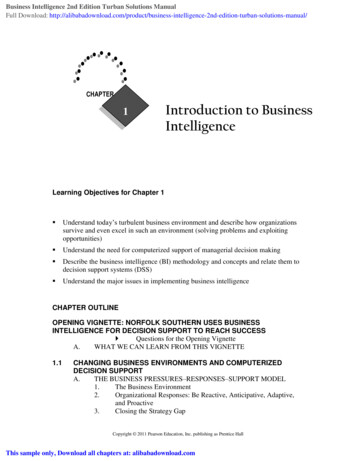
OLAP Cubes 101:An Introduction to Business Intelligence CubesJet Reports www.jetreports.comWhat every stakeholder really wants is a way that’s a) simple; and b) fast –and that’s where cubes come in.There’s a second, less obvious issue around this hypothetical question: once you know howmuch profit we made selling sno-cones to Icelanders last year, it raises other questions: Who were these customers?Are sales growing or shrinking?Did sales fluctuate month-over-month?Who was our top salesperson?Could we put that person to a better use?OLAP cubes make it easy to answer additional questions that will drive strategy with nearinstant analysis of large amounts of data.This image shows a cube with three dimensions (though really, the number of dimensionsthat can be contained within a cube are limitless): products, customers (by country) andposting date (year). If we want to see our profit for sno-cones in Iceland in 2015, that data isalready indexed by the cube and it’s set up to effortlessly pull that information out, no matterthe level of technical expertise.8
OLAP Cubes 101:An Introduction to Business Intelligence CubesJet Reports www.jetreports.comCube TerminologyDimensionA category that can be used to slice data. In the image above, we have three dimensions:products, customer/country and the year. Cubes can have many dimensions. In a typical“Sales” cube, you will see dimensions for all the different ways you can categorize a salestransaction ( for example – Company, Salesperson, Sell-to Customer, Bill-to-Customer,Sales Document type, Location, Item, etc.).MeasureA measure is a calculated numerical value. It can be a sum, a count, an average, apercentage, etc. Examples of measures would be sales, profit, profit percentage. In cubes,many measures are pre-calculated, providing extremely fast performance when analyzingdata. Examples of measures in a Sales cube may include Sales Amount, Profit YTD,Average Unit Cost, Document count, etc.LevelA level is a grouping within a dimension. For example, customers can be grouped by city orcountry. When grouped in this way, customer, city and country are categorized as differentlevels within a cube. Similarly, dates can have different levels in a Cube (day, month, quarter,year, is a common example.)HierarchyA hierarchy is a way to organize different levels of a dimension by granularity; usually fromlargest to smallest. For a date, a typical hierarchy would be organized by year, quarter,month, day. Country, state, city, customer is another example of a hierarchy of levels withina cube.OLAPOLAP is an acronym for Online Analytical Processing and is often used interchangeably torefer to cubes.9
OLAP Cubes 101:An Introduction to Business Intelligence CubesJet Reports www.jetreports.comCorrecting Mis-cube-ceptionsSystems utilizing cubes have evolved rapidly over the last few years, rendering a number ofthe historical concerns organizations had about employing them obsolete:Myth #1:Cubes require months of planning and implementation before users can get value out ofthem.As recently as a few years ago, this myth was true—it would take months or years fororganizations to get any value out of cube deployments. Now, with solutions like JetEnterprise, cubes are typically installed and running in two hours or less for Dynamics NAVand Dynamics GP customers. With pre-built cubes, it’s a snap from deployment to runningyour first report— without the months and months of planning.Myth #2:Customizing cubes is slow and difficult.This myth can be true, depending on the warehousing system you’re utilizing. Unless youhave an easy-to-use data warehouse automation tool like the Jet Data Manager, customizingcubes requires programming skills and deep knowledge of various data platforms (SSAS,SSIS to name a few).The Jet Data Manager, which is included with Jet Enterprise, allows you to customize orcreate cubes in a simple drag-and-drop interface. You can add dimensions, measures orcreate unique measures on the spot and apply these into the cubes – often in minutes, withno engineering degree required.Myth #3:Cubes are a luxury, applicable only to large companies with BI development teams andlarge budgets.This is no longer true. As of mid-year 2016, Jet Reports has more than 1,100 customerscurrently running cubes—from large multi-national corporations to small non-profits—and,on average, adding more than one a day to that tally. You no longer have to have a largecompany with a BI development team to be take advantage of the incredible value of cubes.With the power of cubes and business intelligence, organizations big and small are easilyachieving double digit revenue growth and beyond. If you want to see how Jet Reportscan give you organization-wide access to the data used to drive smart business decisions,contact us for a personalized demo today.10
To learn more about OLAP Cubes and business Intelligencevisit us online today.www.jetreports.comJet Reports delivers unparalleled access to data through fast and flexible reporting andbusiness analytics solutions that are cost effective, provide rapid time-to-value and arebuilt specifically for the needs of Microsoft ERP users. Embedded within the familiarExcel environment, Jet Reports leverages the existing skillsets of users and offers out-ofthe-box reports and dashboards so companies can immediately eliminate all expensive,time consuming and error-prone manual tasks to get the accurate business informationthey need, when and where they need it.Over 11,300 companies rely on Jet Reports every dayfor their financial reporting.
OLAP Cubes 101 Page 3 Clear the TablesPage 4 Embracing Cubism Page 5 Everybody Loves Cubes Page 6 Cubes in ActionPage 7 Cube Terminology Page 9 Correcting Mis-cube-ceptions Page 10 OLAP Cubes 101: An Int