Transcription
GLOBAL TRENDS IN EBOOK USAGE:PATTERNS FROM 10,000 LIBRARIESMichael Levine-ClarkUniversity of Denver
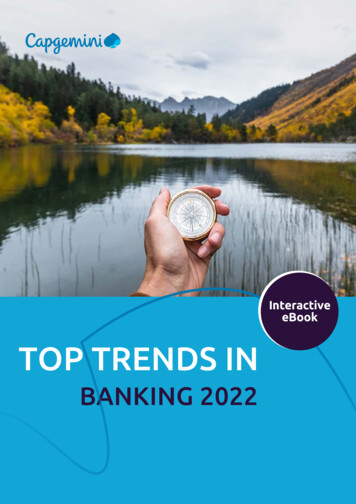
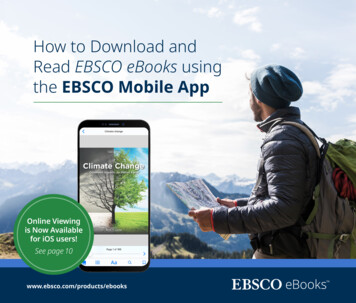
Global Trends In Ebook Usage: Patterns From 10,000 LibrariesEbooks for libraries have now been around for over fifteen years, and EBL and ebrary have been there for most of that history. Together theyhave compiled years of ebook usage data across thousands of libraries. Their merger allowed a single study of the largest accumulation ofsuch data in existence; data that can help libraries better understand the needs of their users.Libraries vary tremendously – in terms of collection size and scope; the institutional curricular and research focus; the type of library; and thesize and makeup of user populations. These variations mean that no two libraries will see the same usage patterns. A library at an institutionwith a heavy emphasis on the social sciences will see high usage of titles that might go unused at an engineering school. And a library with arelatively small collection may see greater use of any ebooks added to the mix than a library with extensive monographic holdings.Given those variations, it may seem odd to study usage patterns at a global scale. A particular institution will likely see variations from thegeneral trends shown in this study, just as that library would likely see variations from the usage patterns at another library, but across alllibraries, patterns and trends do begin to emerge. Those patterns and trends can be used to better understand disciplinary differences in use,variations in how different regions of the world use ebooks, and even to better understand monograph use in general, something that wasnever possible when comparing local circulation trends.This sort of study also allows us to test some commonly held assumptions about ebooks, such as:1. ebooks are better for some subjects than others; and2. ebooks are an inadequate format for immersive readingIt also allows us to answer some broad, but important questions:1. What can we learn from worldwide usage data?2. do trends across a large data set matter?3. is every institution so unique – with various resources competing for users’ time and ebooks comprising different aspects of alibrary’s collection – that only local data are valuable?While this study sheds light on monograph usage patterns broadly and ebook trends more specifically, hopefully it also suggests models forconducting usage studies at the local level.The dATAThis paper examines a set of worldwide usage data in order toexplore patterns, trends, and opportunities in ebook usage ona global scale. Combined, ebrary and EBL serve thousands oflibraries and institutions of all types and sizes, making these twoindustry leaders an obvious source of data of this magnitude.This study examines usage for two years – 2013 for EBL and2014 for ebrary. At the time of this study, ebrary and EBL hadnot yet completely merged, so the study examines usage fromeach separately. Usage data from all libraries were aggregatedat the title level, with all bibliographic information and a variety oftypes of usage data represented in title-level rows in a massivespreadsheet. In addition to basic bibliographic information, thisspreadsheet included Library of Congress (LC) Call Number, Class,and Subclass; BISAC; copyright year; number of libraries with thetitle available; number of libraries with usage; and multiple layers ofusage (sessions, page views, book downloads, chapter downloads;usage time; pages copied; and pages printed).The subject analysis for the study was based on LC Classes andSubclasses derived from LC Call Numbers, yet call numbers in theoriginal data set were imperfect. To the extent that there werepatterns in the flawed call numbers, it was possible to clean themup and assign correct LC Classes and Subclasses. But many callnumbers contained errors that could not be easily corrected, andmany other titles lacked call numbers entirely. When a logical LCClass or Subclass could not easily be assigned, those titles wereexcluded from a subject analysis of usage or holdings.In addition to analysis at the LC Class level, this study makes useof broad categorizations into major academic divisions – Arts &Humanities; Social Sciences; Science, Technology, Engineering,and Medicine (STEM) – derived from the LC Classes and used forhigher-level subject analysis. See Figure 1.Another difficulty in building this data set was that identifying libraryaccess retroactively was impossible. Assumptions about libraryaccess to titles before the current year are educated guesses. If aninstitution had any indicator of use, then it was clear that the titlewas available to that library. To identify titles visible to a library’susers, but with no recorded use, we counted any ebook that wasstill available to that library today and was generally available duringthe study year. This means that titles removed from a library’s pool,but still available today in ebrary or EBL generally as well as titlesthat were added to that library’s pool after the period of this studywould falsely be counted as available to that library in this study.This is likely a very small number of library/title combinations in theoverall data set and almost certainly does not change the results inany significant way, but analyses that rely on comparisons of usagevs. availability are therefore inexact. In addition, while the ebrarydata set includes library availability broken out at the regional level,the EBL set only includes that information globally.2
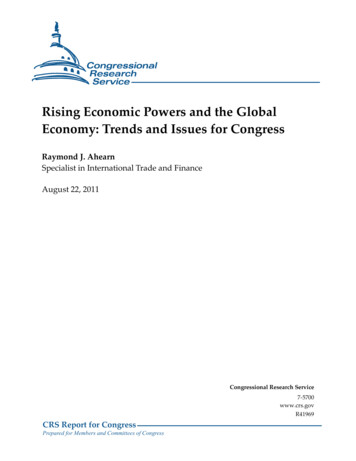
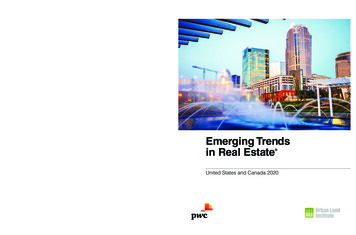
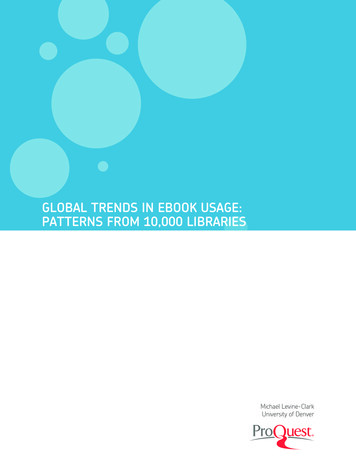
Global Trends In Ebook Usage: Patterns From 10,000 LibrariescATegoRies of AnAlysisThere are multiple elements within the data that can be grouped together to provide useful high level categories of analysis: LC Class and subclass— Broad academic division (humanities, social sciences, STEM)— SubjectBISACPublication dateRegion (Africa, Asia Pacific, etc.)Publisher or publisher typeAcAdemic divisionsUsing the LC Classes and Subclasses, we grouped all titles into broad academic divisions as shown below.Arts & humanitiessocial sciencesb (Philosophy, Religion) excluding BF (Psychology)c, d, e, f (History)m (Music)n (Fine Arts)p (Language & Literature)TR (Photography)otherFigure 1bf (Psychology)h (Social Sciences)j (Political Science)k (Law)l (Education)u, v (Military, Naval Sciences)sTemA (General)g (Geography, Anthropology, Recreation)Z (Bibliography, LIS)Q (Science)R (Medicine)s (Agriculture)T (Technology) (excluding TR)one TiTle, WoRldWide dATAThis study explores usage in relation to availability of titles, different types of usage per session, usage of the ten percent of titles with the mostsessions, and intensive vs. extensive use. This title, which is the most highly used ebook on the ebrary platform, is an example of the dataavailable for each title.craft of Reserch(3rd Edition)by Booth, Wayne C.Colomb, Gregory G.Williams, Joseph MFor every title in the study, the combined usage data from every library have been compiled into a single rowon a spreadsheet. While the numbers for the title in this example are huge, they are illustrative of the type ofinformation available at the title level in this massive data set.3
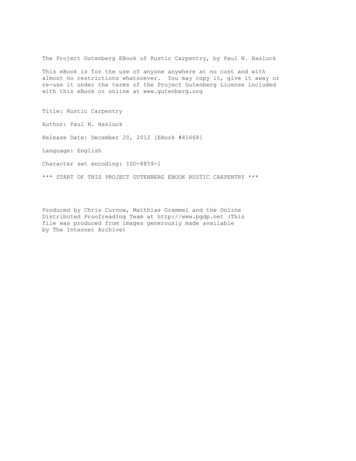
Global Trends In Ebook Usage: Patterns From 10,000 LibrariesbooTh, cRAfT of ReseARchebrary17,089 sessionssessions by RegionAdditional measures ofusageAcademicAfricaPublicAsia Pacific—SpecialAUS / NZ—Europe—97%86%Latin AmericaMiddle EastNorth AmericaFigure 2———368,879 page views1,162 pages copied62,009 pages printed0 downloads*2,323 chapter downloadsUsed 17,453,759 seconds(4,848 hours)South AsiaUK / IrelandFigure 33000Libraries with availabilityLibraries with usage25002000150010005000AfricaAsia PacificAUS/NZEuropeLatin America Middle East N. America South Asia UK / Ireland* This title was only available for a chapter download.World4
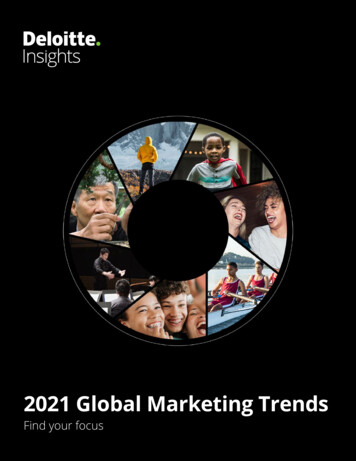
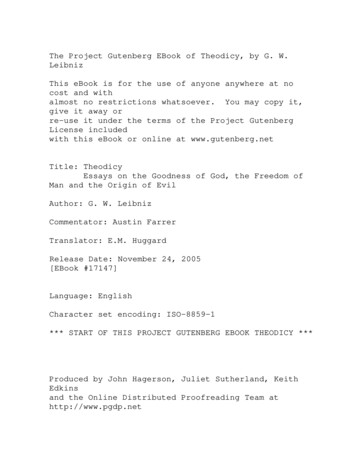
Global Trends In Ebook Usage: Patterns From 10,000 LibrariesTitles AvailableWith over 630,000 titles available on the ebrary platform and around 375,000 on EBL, this study constitutes a vast data set coveringlibraries of all types from countries around the world. Though ebrary and EBL include primarily English-language titles, the largenumber of titles available even in areas of the world where English is not generally spoken indicates broad value.ebrary Titles Available Worldwide, by RegionFigure orth AmericaEuropeUK / IrelandAUS / NZAsia PacificLatin America Middle EastAfricaSouth AsiaA Subject Breakdown of Titles Available Worldwideebrary and EBL ebook collections have a similar breakdown in terms of subject coverage, with a roughly even split between the Arts &Humanities, Social Sciences, and STEM. EBL is more heavily weighted toward the Social Sciences than ebrary.ebraryEBLFigure 61(13.9%)Arts & Humanities110,292(28.7%)Social 6.6%)5
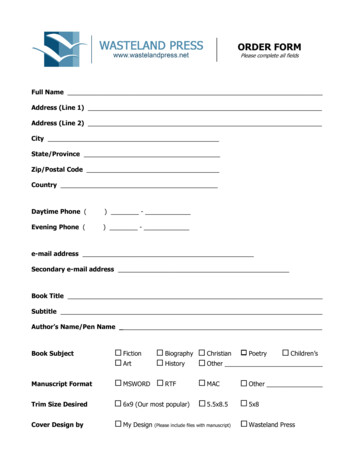
Global Trends In Ebook Usage: Patterns From 10,000 LibrariesNot surprisingly, given subject patterns in libraries generally, the LC Class with the most titles available from both ebrary and EBL is H(Social Sciences). As in libraries generally, the largest subject categories make up a disproportionately large section of the overall collection.While there are some minor variations, the subject breakdown within ebrary and EBL is fairly similar.ebrary Titles Available Worldwide by LC ClassFigure 6120000100000800006000040000200000HPQNO LCCN RTBDKLGJEFSNMZUCEBL Titles Available Worldwide by LC ClassVAFigure 725.00%20.00%15.00%10.00%5.00%0HQPNO LCCN RTBDLKGJESNMFUZCVA6
Global Trends In Ebook Usage: Patterns From 10,000 LibrariesAcademic Completeebrary’s Academic Complete subscription package weighs heavily on the ebrary data. A package of over 125,000 titles available in its entirety to over 2,000libraries worldwide, Academic Complete has a different subject makeup than the ebrary set as a whole. While the overall ebrary title set is roughly evenlydivided between arts & humanities, social sciences, and STEM, Academic Complete, as shown in the figures below, is more heavily weighted toward the arts& humanities and the social sciences.ebraryOverallAcademic CompleteFigure 32.4%)Arts & Humanities184,053(28.7%)32,133(25.7%)STEMArts & HumanitiesSocial SciencesSocial SciencesOther185,558(28.9%)Figure 9Other47,452(38.0%)The figures below are paired to show the absolute and percentage representation of subjects within ebrary as a whole and Academic Complete.ebrary40%35%30%25%20%15%10%5%0%Figure 757240482321330Arts & HumanitiesebrarySocial SciencesFigure 1138.0%32.4%28.6%28.9%25.7%Arts & HumanitiesSTEM30.2%Social SciencesSTEMFigure 12120000100000800006000040000200000HebraryPQNO LCCNRTBDKLGJEFSNMZUCVA25.00%Figure 1320.00%15.00%10.00%5.00%0HPQNO LCCNRTBDKLGOverallJEFSNMZUCAcademic CompleteVA7
Global Trends In Ebook Usage: Patterns From 10,000 LibrariesAverage Number of Libraries with TitleS AvailableWhile the overall subject breakdown described above indicates the general makeup of the ebrary and EBL collections available in libraries, itdoes not show the degree to which libraries have followed similar patterns in building these collections. At the extreme end, the count of titlesavailable weighs a title available to one library equally with a title available to 2,500 libraries. Looking at the average number of libraries withtitles available gives a better sense of how widely libraries have opted to make these titles available to their users.On average, worldwide, ebrary titles were available in 412.3 libraries. Titles were available most often in North American libraries, and leastin libraries in Australia and New Zealand (partly because of the lower number of libraries generally in those regions and partially because farmore Australian and New Zealand libraries were EBL customers.)Average Number of Libraries With ebrary Titles Available by Global RegionFigure 14450400350300250200150100500WorldNorth America Asia Pacific Latin America Middle EastAfricaEuropeSouth AsiaUK / IrelandAUS / NZAverage Number of Libraries with Titles Available – Academic DivisionsOn average more ebrary libraries had arts & humanities titles available to their users than one would expect given the general breakdown of arts& humanities titles in the ebrary pool, but not at all surprising given the heavy weight placed on those titles in the heavily-subscribed AcademicComplete collection. STEM titles, a disproportionately small part of Academic Complete, are available in fewer ebrary libraries than one mightotherwise expect. With EBL, STEM titles are available at about the average rate, with social sciences titles appearing in the most libraries overall.ebrary600Figure 15500412.34003002001000Arts & HumanitiesEBLSocial SciencesSTEMOther120Figure 1610088.9806040200Arts & HumanitiesSocial SciencesSTEMOther8
Global Trends In Ebook Usage: Patterns From 10,000 LibrariesAverage Number of Libraries with TitleS Available - LC ClassAt a narrower subject breakdown, the average number of libraries with titles available varies dramatically between EBL and ebrary, due verylikely to the subject spread within Academic Complete.ebraryFigure ZGNVEBLKRNO LCCNFigure 1812010088.9806040200HJLQGTZEKRMDCBFAVNPSUNO LCCN9
Global Trends In Ebook Usage: Patterns From 10,000 LibrariesUSAGEAverage Number of Libraries with Titles Available by SubjectThere are many ways of measuring usage, and taken together these six broad categories tell a more complete story than one alone:1. Percentage of libraries using a title – a measure of the number of libraries with usage relative to the number of libraries where a title is available2. Usage compared to availability – the percentage of titles visible across the entire data set that were used by at least one library3. Usage patterns per session – the level of usage of different types for every session that occurs4. Usage of the most popular titles – the level of usage for the ten percent of titles with most sessions5. Broad vs. deep use – a comparison of the percentage of titles in a given LC Class that are used with the number of times they are used6. Usage by copyright year – an analysis of usage compared to availability by the date of original publication of the ebookPercentage of Libraries with Titles Available by SubjectOne measure of value of a title is whether it gets used or not. Ignoring for now whether titles are used heavily, the following figures illustratethe number of libraries with different types of use on EBL relative to title availability. For instance, arts & humanities titles are available onaverage in 76.8 libraries, but on average 3.5 libraries have a session for any one of these titles. In terms of raw figures, social sciences titlesare used in more libraries, but they are also available in the most libraries.Average Number of Libraries With Usage, EBLFigure 002.001.000.00Arts & Humanities76.8Social Sciences100.6STEM87.6AverageA better way of measuring likelihood of usage at the library level is calculating the percentage of libraries with the title available to them thathave the various types of use. By this measure, arts & humanities titles perform the best in all five measures of usage.Percentage of Libraries With Usage, EBLFigure 040.030.020.010.00Arts & HumanitiesSocial SciencesSTEMAverage10
Global Trends In Ebook Usage: Patterns From 10,000 LibrariesLikelihood that a Library will see usage of a titleAverage Number of Libraries USING A TITLEThis measure of percentage of use at the regional level for ebrary shows that titles are used across the greatest range of English-languagelibraries, with the highest percentages in the United Kingdom and Ireland, followed by Australia and New Zealand and North America.Number and Percentage of Libraries Using a Title, by Region, ebraryRegionAverage # of Librarieswith TitleFigure 21Average # of Librarieswith use of Title% of Librariesusing 204.75.32.6%60.41.52.5%Asia Pacific170.01.81.0%South Asia58.00.61.0%Middle East87.50.70.8%Africa69.10.50.8%Latin America119.40.90.7%World412.39.32.2%North AmericaEuropePercentage of Libraries Using a Title By DisciplineWorldwide, the highest percentage of libraries using a title occurs in the social sciences, followed by STEM titles, with a much lowerpercentage of libraries using arts & humanities titles. This is in contrast to EBL, for which the highest percentage of libraries uses titles in thearts & humanities.Percentage of Libraries Using a title, by Discipline and Region, ebraryRegionArts & HumanitiesFigure 22Social SciencesSTEMAfrica0.3%1.0%0.9%Asia .0%2.8%2.5%Latin America0.4%0.8%1.2%Middle East0.5%0.9%1.1%North America2.4%2.7%2.6%South .5%2.4%11
Global Trends In Ebook Usage: Patterns From 10,000 LibrariesUSAGE COMPARED TO AVAILABILITYThe analysis above looks at the number of libraries using titles relative to the number of libraries at which they are available. Another wayof measuring usage relative to availability is to simply calculate the number of titles used at least once and compare that to the number oftitles available anywhere. By this measure, a title available at 1,000 libraries but used once is counted the same way as a title available atone library but used a thousand times. Worldwide, 53.1% of ebrary titles were used at least once in 2014, with regional usage varying from46.9% down to 25.4%.Percentage of Titles Used by LC Class, ebraryFigure 2%33.1%32.6%20%32.2%30.8%25.4%10%0%WorldAsia Pacific North AmericaAUS / NZUK / IrelandTitles with a SessionEuropeSouth Asia Latin America Middle EastAfricaTitles without a SessionPercentage of Titles Used By DisciplineFor both ebrary and EBL, the highest percentage of titles used is in the social sciences, though EBL sees a higher percentage of titles usedoverall, most likely because libraries typically have smaller and more carefully curated collections of EBL titles. Interestingly, though EBLlibraries tend to focus their efforts on social sciences and STEM titles, arts & humanities titles are used at exactly the same rate as STEM titles.Percentage of Titles Used by Discipline, ebraryFigure 3.1%30%20%10%0%Social SciencesArts & HumanitiesSTEMAll Subjects12
Global Trends In Ebook Usage: Patterns From 10,000 LibrariesPercentage of Titles Used by Discipline, EBLFigure %40%30%20%10%0%Social SciencesArts & HumanitiesSTEMAll SubjectsPercentage of Titles Used By LC ClassLooking a bit deeper into the percentage of titles with at least one use, three of the top five LC Classes for ebrary are in the arts & humanities(E – History of the Americas, M – Music, and N – Fine Arts) with the other two in the Social Sciences (L – Education, J – Political Science).Percentage of Titles Used by Discipline, ebraryFigure nADCGURPSKTVQNO LCCNNo Session13
Global Trends In Ebook Usage: Patterns From 10,000 LibrariesTitles Used By LC ClassSorting the same chart by the number of titles available shows that these areas with high percentages of use are subjects with relatively fewtitles available.Number of Titles Used by LC Class, ebraryFigure onGEFNMSZU NO LCCN CVANo SessionPercentage of Titles Used, By DivisionFinally, looking at regional variations of the percentage of titles used by broad academic division shows that social science titles have thehighest percentage of use in five regions of the world and STEM in four.Percentage of Titles Used, by Academic Division and Region, ebraryRegionArts & HumanitiesSocial SciencesFigure 28STEMAfrica15.0%30.7%34.0%Asia urope36.8%38.0%25.4%Latin America26.8%35.7%34.1%Middle East25.7%29.6%41.6%North America54.2%54.7%43.9%South 9.5%63.8%50.2%Another way to consider usage relative to availability is to compare the percentage of titles with different types of use (page views, downloads,copies, pages printed) with the percentage of those uses overall. For example, a subject might account for 40% of all titles with a downloadbut only 20% of all downloads. In general, across these comparisons, STEM titles account for a lower percentage of titles with one of theseactions than one would expect and an even lower percentage of those actions.14
Global Trends In Ebook Usage: Patterns From 10,000 LibrariesebraryAvailabilityebraryTitles with a brarySessions39.5%28.9%29.7%32.3%Figure 30Figure 31ebraryPage ViewsebraryTitles with a ial SciencesOtherFigure 294.3%4%Arts & itles with Copy/Paste38.0%29.4%33.2%Figure 32Figure 33Figure 34Figure 35ebraryCopy/PasteebraryTitles with PrintingebraryPages PrintedebraryTime Spent4.2%4.3%4.2%20.1%26.4%35.8%44.9%30.9%Figure 3633.5%Figure 374.3%31.6%36.4%27.8%Figure 3824.1%40.2%31.4%Figure 3915
Global Trends In Ebook Usage: Patterns From 10,000 LibrariesUSAGE PATTERNS PER SESSIONAnalyzing usage in terms of the types and volume of activity per session gives a view of how average users interact with ebooks during any given session.There are multiple measures of use – page views, pages copied, pages printed, downloads, and amount of time spent interacting with the book – and in somedisciplines and regions of the world, readers do more during a session than in others. For instance, users typically view more pages per session and downloadmore times per session in STEM disciplines than in others, but spend less time doing so than those examining books in the arts & humanities or social sciences.Page Views Per SessionIn most sessions, there is a view of at least one page (the exception being the relatively few times when a session leads directly to a download). Measuringthe number of pages viewed in a session is a way of determining how much of a book is typically examined.Page Views per Session – Regional VariationsWorldwide, for ebrary, there are just under 16 pages viewed per session, with the most in North America, the UK/Ireland, and Europe.Readers in these regions are looking at more of the book, and doing so while online, than readers in the developing world regions of SouthAsia, Latin America, the Middle East, and Africa.ebraryFigure icaAsia PacificAUS / NZEuropeLatin America Middle East N. AmericaSouth Asia UK / IrelandWorldPage Views Per Session – By Academic Division and RegionWorldwide, STEM titles have the most pages viewed per session, followed by the social sciences and arts & humanities. In most regions of theworld these patterns hold true, with the exceptions of Africa (where social sciences titles see the most pages viewed) and South Asia (wherearts & humanities titles have the most pages viewed).ebraryFigure icaAsia Pacific AUS / NZEurope Latin America Middle East N. America South Asia UK / IrelandArts & HumanitiesSocial SciencesWorldSTEMPage Views Per Session – By LC ClassAt the subject level, titles with no LC Call Number (LCCN) have the most page views per session, but these titles have so few sessions compared toother subjects that they can be excluded from the analysis. The five subjects with the most pages viewed per session are F (History of the Americas), T(Technology), N (Fine Arts), E (History of the Americas), and R (Medicine).ebraryFigure 4218.0016.0014.0012.0010.008.006.004.002.000.00NO LCCN FTNERQHDZMCGSJALKUBPV16
Global Trends In Ebook Usage: Patterns From 10,000 LibrariesDownloads Per SessionDownloads per session, unlike page views per session, do not measure level of use. Just as with print circulation data, a download simply tells us thatsomeone decided a book was worth “borrowing” from the collection. There is no way of knowing how many pages are viewed during a download. But,downloads, which take a few more steps than simply looking at a page, are a valuable indicator that someone felt that the book was of interest to them.Downloads also allow for reading offline, so may be an indicator of stability of Internet access.Downloads Per Session – Regional VariationsThe regional variations for downloads per session are almost a reverse image of the patterns for page views per session, with the fewest in North Americaand the most in South Asia. The high level of downloads per session in the developing world may be due to cost or availability of Internet access, with ahigher degree of downloading for later than in North America, Europe, Australia/New Zealand, or the UK/Ireland.ebraryFigure 430.700.600.500.400.300.200.100.00AfricaAsia PacificAUS / NZEuropeLatin America Middle East North America South Asia UK / IrelandWorldDownloads Per Session – By Academic Division and RegionJust as with page views per session, STEM titles have the most downloads per session, followed by the social sciences and the arts &humanities. And, similarly, most regions of the world follow the same pattern, with Africa (social sciences) and South Asia (arts & humanities)being the exceptions. It is worth noting that these broad patterns are almost identical to page views per session, and suggests similar rates ofdownloading relative to page views at the regional level.ebrary0.70Figure 440.600.500.400.300.200.100.00AfricaAsia PacificAUS / NZEurope Latin America Middle East N. America South Asia UK / IrelandArts & HumanitiesWorldSocial SciencesSTEMDownloads Per Session – By LC ClassThe subject breakdown is different than it is for page views per session. T (Technology), which is near the top of the page views per session chart, is alsoat the top for downloads per session. The other categories (No LCCN, F – History of the Americas, E – History of the Americas, R – Medicine, and N – FineArts) that are near the top in page views per session are at or near the bottom of downloads per session. Readers seem to examine a lot of pages of thesesubjects but to download them relatively rarely. These are subjects that appear to have more appeal for readers for onscreen reading.ebrary0.30Figure 450.250.200.150.100.050.00TQZCSVANUBLJPHKMGRDEFNO LCCN17
Global Trends In Ebook Usage: Patterns From 10,000 LibrariesCopies/Pastes Per SessionCopying/pasting per session, which measures the number of pages copied, indicates relative value of material to users. While pages viewed and downloadedmeasure a simple level of interaction, copying/pasting suggests a higher level of interaction, and that users have found something that meets a particularinformation need.Copies/Pastes Per Session – Regional VariationsWhile there are clear regional variations, these do not seem to follow any obvious patterns.ebrary0.20Figure ia PacificAUS / NZEuropeLatin America Middle East North America South Asia UK / Ireland WorldCopies/Pastes Per Session – By Academic Division and RegionUnlike pages viewed and downloaded, STEM titles have the fewest instances of copying and pasting, while social sciences titles have the most. Worldwide,these patterns hold true, except in Australia/New Zealand and UK/Ireland, where arts & humanities titles have the most pages copied per session.ebraryFigure 470.200.150.100.050.00AfricaAsia Pacific AUS / NZEurope Latin America Middle East N. America South Asia UK / IrelandArts & HumanitiesSocial SciencesWorldSTEMCopies/Pastes Per Session – By LC ClassK (Law), J (Political Science), and H (Social Sciences) are the subjects with the most pages copied per session. T (Technology), which has many pages viewedand many downloads per session, has very few pages copied per session.ebraryFigure BGLAZRCNMSTV NO LCCN Q18
Global Trends In Ebook Usage: Patterns From 10,000 LibrariesPages Printed Per SessionLike pages copied/pasted per session, the number of pages printed in a session is a measure of relative value, since printing often involves an extra cost tothe user and presumably also indicates that the content is of some value.Pages Printed Per Session – Regional VariationsAs with copies/pastes per session, there are wide regional variations, but these do not appear to follow any obvious patterns.ebrary6Figure 49543210AfricaAsia PacificAUS / NZEuropeLatin America Middle East North America South Asia UK / IrelandWorldPages Printed Per Session – By Academic Division and RegionWorldwide, STEM titles have the most pages printed per session, and that pattern holds true for five of the nine regions of the world. There is more variationhere than in the other measures of usage per session.ebrary9Figure 50876543210AfricaAsia Pacific AUS / NZEurope Latin America Middle East N. America South Asia UK / IrelandArts & HumanitiesSocial SciencesWorldSTEMPages Printed Per Session by LC ClassT (Technology), which is at the top of the page views per session and downloads per session lists, is also near the top of this category. Users look at a lot ofpages of technology books, download them a lot, and print a lot of pages. E and F (History of the Americas), which are near the top of the page views persession and near the bottom of downloads per session, are at the bottom of this chart. Readers look at a lot of pages of these history books online, but do notdownload them as often for reading later and do not prin
craft of Reserch (3rd Edition) by Booth, Wayne C. Colomb, Gregory G. Williams, Joseph M For every title in the study, the combined usage data from every library have been compiled into a single row on a spreadsheet. While the numbers for the title in th