Transcription
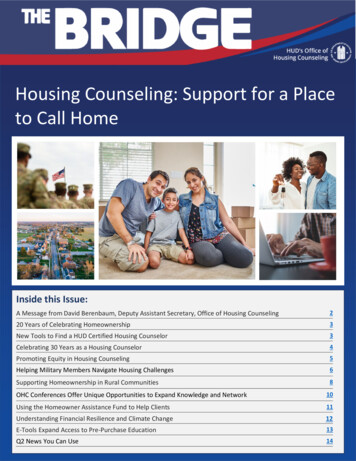
HOUSINGEXECUTIVE SUMMARYAMERIC A' SOLDERADULTS20 18A S U P P L E M E N T TO T H E S TAT E O F T H E N AT I O N ' S H O U S I N G R E P O R TMore than half of the nation’s households are nowheaded by someone at least 50 years of age.These 65 million older households are highly diverse in their living situations,financial resources, health and functional abilities, and life stages, and thusrequire different types of housing to meet their needs and preferences.Affordable, accessible housing located in age-friendly communities and linkedto health supports is in particularly short supply. Demand for these units willonly increase when the baby boomers start to turn 80 in less than a decade. Andwhether they own or rent, millions of older households struggle to pay for theirhousing and other basic necessities, and their numbers are rising. Householdsnow in their 50s to mid-60s are especially at risk of having insufficient resourcesto manage rising healthcare and housing costs in their later years.J O I N T C E N T E R F O R H O U S I N G S T U D I E S O F H A R VA R D U N I V E R S I T Y
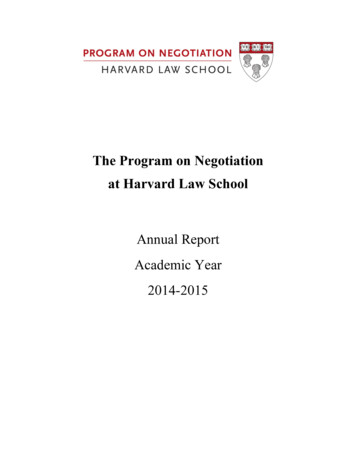
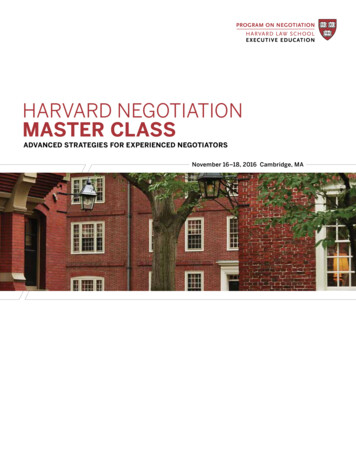
THE GROWING PRESENCE OF OLDER HOUSEHOLDSIn just the years from 2011 to 2016, the US population age50 and over grew by 10.5 million, to more than 112 million.At the same time, the number of households headed bypeople in this age group increased by 5.5 million, to 65 million. As a result, fully 55 percent of the nation’s householdsare now headed by someone at least 50 years old.The baby boomers (born 1946–1964) are driving much of thisgrowth, with the number of households headed by adults inthe 65–74 year-old age range climbing 26 percent in 2011–2016,to more than 17 million. Over this same period, the number ofhouseholds headed by 50–64 year olds rose only 3.0 percent,to 35 million. In fact, the number of households aged 50–54actually fell by 600,000 as the leading edge of the smaller generation X (born 1965–1984) began to turn 50 (Figure 1).Although growth in the number of households in their 50sand 60s will therefore slow over the next two decades, greater longevity and population growth mean that the numberof households in their 70s, 80s, and 90s is set to soar. Thenumber of households age 80 and over already jumped 71percent from 4.4 million in 1990 to 7.5 million in 2016. Withthe aging of the baby boomers, the number of households inthis age group will more than double by 2037.At the same time, the older population will become moreracially and ethnically diverse. Today, about three-quartersof all households age 50 and over are white. In 2016, whitesFIGURE 1With the Aging of the Baby Boomers, theNumber of Households in Their 60s and 70sIs Growing RapidlyPercent Change in Households, 2011–20163025made up 71 percent of households aged 50–64, 78 percentof those aged 65–79, and 83 percent of those age 80 andover. But among household heads under age 50, just 60percent are white. This younger group also includes morehouseholds that are foreign born. Immigrants now accountfor about 10 percent of households age 65 and over, but 18percent of those under the age of 50.DIVERSITY OF LIVING ARRANGEMENTSWhile many adults in their 50s still have children livingat home, most households in their 60s either live aloneor in couples. Among all households age 65 and over, 44percent are married or partnered and 43 percent are single.After age 65, though, the share of married or partneredadults falls and the share of single-person households rises(Figure 2).A large majority of older adults live in single-family homes,including 75 percent of those aged 50–64, 76 percent of thoseaged 65–79, and 68 percent of those age 80 and over. Mostof the remainder live in multifamily housing. The share living in larger multifamily buildings (with 50 or more units)increases with household age, rising from 6 percent of thosein the 50–64 year-old age range to 17 percent of those 80and over, possibly because larger buildings are more likelyto offer accessibility features (such as elevators) and otheramenities.Whether out of preference or necessity, many older adultsdouble up with others. In 2016, 5.3 million (11 percent of)adults age 65 and over lived in another person’s household—3.4 million in the homes of their children and 1.1million in the homes of their parents, siblings, or otherrelatives. The share of older adults living with roommates,boarders, or other non-family members (either in their ownhomes or those of others) is also on the increase. Althoughthese shares are modest, growth in the older populationmeans that the number of people living with non-relativesclimbed more than 70 percent over the decade, from 1.5million to 2.6 475–7980 and OverAge GroupSource: JCHS tabulations of US Census Bureau, American Community Survey 1-Year Estimates.2H O U S I N G A M E R I CA ' S O L D E R A D U LT S 201 8In addition, multigenerational living arrangements arebecoming more common. In 2016, nearly 11 million olderadults lived in households where at least two related generations were present. Almost two-thirds of these olderadults in multigenerational households resided in theirown homes. In general, adults in the 65–79 age range aremore likely to live in their own homes with younger family members, while those age 80 and over are more likelyto live in another person’s home. However, older Asian/other adults are more likely to live in others’ homes at all
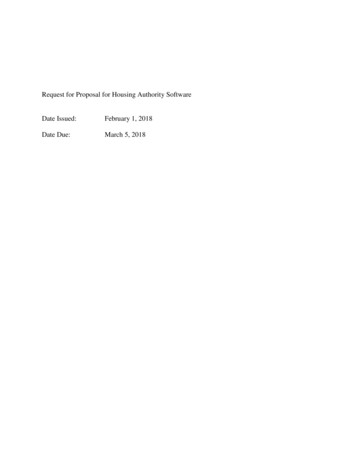
ages 65 and over, while older black adults are more likelyto live in their own homes at all ages 65 and over.The number of three-generation households with at leastone member age 65 and over grew from 1.7 million in 2006to 3.2 million in 2016. Within racial/ethnic groups, 19 percent of older Hispanic households and 20 percent of olderAsian/other households include three generations, compared with 10 percent of older black and 4 percent of olderwhite households. Meanwhile, nearly half a million olderadult households include grandparents and grandchildrenbut have no middle generation present.In 2016, 2.4 million older adults lived in group quarterssuch as skilled nursing facilities. This includes 1.4 percentof the population aged 50–74, 2.4 percent of the populationaged 75–79, and 7.7 percent of the population age 80 andover. The share of older adults living in group quartershas fallen in recent decades as home and communitybased services increasingly offer longer-term supports inresidential settings.FIGURE 2The Likelihood of Living Alone IncreasesSharply After Age 65Share of Households (Percent)6050403020100SinglePersonHomeownership rates tend to rise with age, with fully fourout of five households in the 75–79 year-old age range owning homes in 2016. After age 80, however, the homeownership rate dips and renting becomes more common. Buthomeownership rates for older adults across the board arelower than in the past. Indeed, the rate for adults already intheir retirement years (age 65 and over) has dropped belowits pre-recession level. At the same time, the rate for households aged 50–64 has declined steadily since 2004 while thatfor adults approaching age 50 has fallen even more sharply(Figure 3). Since this younger group is unlikely to matchthe homeownership rates of previous generations, many ofthese households will be unable to generate the same levelsof wealth for retirement through equity building.Homeownership rates also differ sharply by race andethnicity. While 81 percent of white households age 50and over own homes, the shares are significantly lowerfor same-aged black households (57 percent), Hispanichouseholds (60 percent), and Asian/other households (71percent). Indeed, the black-white homeownership gapamong older households has held at 24 percentage pointsFamilies withChildrenOtherFamilyNonFamilyAge Group 50–64 65–79 80 and OverNotes: Families with children include only families with their own children under the age of 18. Other non-familyhouseholds include roomers or boarders, housemates or roommates, and other unrelated adults.Source: JCHS tabulations of US Census Bureau, 2016 American Community Survey.HOMEOWNER AND RENTER TRENDSA large majority of older households—76.2 percent ofhouseholds age 50 and over, and 78.7 percent of households age 65 and over—own their homes. With the aging ofthe baby boomers, 63 percent of US homeowners are nowat least age 50 and 31 percent are at least age 65.MarriedCoupleFIGURE 3Homeownership Rates Among Adults UnderAge 65 Are Significantly Lower Today Than in 2000Homeownership Rate 82010201220142016Age Group 45–49 50–64 65 and OverSource: JCHS tabulations of US Census Bureau, Housing Vacancy Surveys.since 2013—the largest disparity since recordkeepingbegan in 1976.Meanwhile, nearly a quarter of households age 50 andover rent their housing. Given that the median income ofolder renters ( 28,000) is less than half that of older owners( 61,000), the decision to rent often comes out of necessity.J O I N T C E N T E R FO R H O U S I N G S T U D I E S O F H A R VA R D U N I V E R S I T Y3
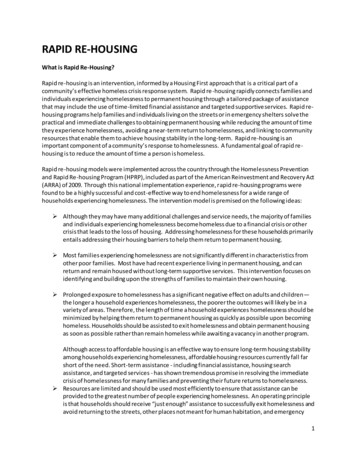
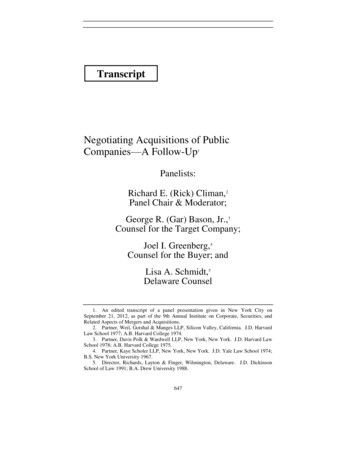
of older adults residing in the principal cities of 95 of thenation’s 100 largest metro areas declined over this period.Meanwhile, the shares living in low-density metro tractsrose significantly, from 24 percent to 32 percent—anincrease of more than 6 million older adults from 2000to 2016. The geographic dispersion of older households issignificant because lower-density areas are more difficultto service and typically provide few housing options otherthan single-family homes.FIGURE 4Growing Numbers of Older Adults Livein Lower-Density NeighborhoodsPopulation Age 65 and Over LowestDensityNon-MetroNeighborhoodsMetro Neighborhoods 2000 2016Note: Neighborhood densities are measured by the number of housing units per square mile in every metro censustract and divided into equal thirds.Source: JCHS tabulations of JCHS Neighborhood Change Database.Most of the 43 percent growth in the number of older renters since 2006 has in fact been among households earningunder 30,000 per year. This increase likely reflects theaging of existing low-income renters into their 50s, as wellas the shift of many financially strapped older householdsfrom owning to renting after the foreclosure crisis.Older renters are more likely than older owners to live alone,with shares ranging from 46 percent of those aged 50–64 (vs.22 percent), to 62 percent of those aged 65–79 (vs. 32 percent), to 77 percent at age 80 and up (vs. 50 percent). Whenthey need assistance or supportive services, these singleperson households must rely on non-resident caregiversor paid professionals. As the number of adults in their 80srises over the next two decades, providing affordable andaccessible housing for the growing number of single-personrenter households will therefore be a critical challenge.LOCATION AND RESIDENTIAL MOBILITYOF OLDER ADULTSAlthough the number of people age 65 and over livingin dense urban areas grew by nearly 800,000 between2000 and 2016, the share of all older adults living in suchneighborhoods actually fell (Figure 4). Indeed, the shares4H O U S I N G A M E R I CA ' S O L D E R A D U LT S 201 8In addition, older adults are increasingly concentratedin locations where more than half of the population isat least age 50. Between 2000 and 2016, the number andshare of census tracts with a majority of older adultsjumped from 1,499 (2 percent) to 4,764 (7 percent). Anincreasing share of these tracts are in lower-density communities within metros as well as in non-metro areas,with particularly high concentrations in rural California,Michigan, North Carolina, Oregon, Texas, Washington, andWisconsin (Figure 5). The number of tracts with large olderpopulations has also increased in certain Sunbelt metrosthat traditionally attract older adults, such as Fort Myers,Miami, Phoenix, Riverside, and Sarasota.The growing presence of older adults in lower-density communities largely results from aging in place. Households,particularly homeowners, are less apt to relocate as theyage. The share of households that have lived in their current homes for more than 20 years thus rises from 36percent of those aged 50–64, to 55 percent for those aged65–79, to 69 percent of those age 80 and over. In 2017, just5.6 percent of individuals aged 50–64 had moved within theprevious year, along with 3.5 percent of those in both the65–79 and 80-and-over age groups. Still, because the olderpopulation is so large and growing, even these small sharestranslated into 4 million residential moves in 2017.A growing share of older adults are choosing age-restricted housing, which includes senior apartments and independent living units (which may provide some servicessuch as meals or laundry), as well as assisted living facilities (which provide assistance with activities of daily living such as bathing, dressing, and eating). According tothe latest American Housing Survey estimates, the shareof households with a member age 55 and over residing inage-restricted communities rose from 5.6 percent in 2001to 6.7 percent in 2009, with most residents (53 percent)renting their units. Since 2009, when the Census Bureaubegan tracking completions of this type of housing, newconstruction has added 319,000 age-restricted units
FIGURE 5In Just 16 Years, the Number of Communities With Majority Older Populations Census Tracts Where at Least Half of Residents Were Age 50 and Over in 2000FIGURE 5B More Than Tripled, with High Concentrations in Northern and Western StatesCensus Tracts Where at Least Half of Residents Were Age 50 and Over in 2016Note: Data exclude census tracts with fewer than ten housing units in 2010.Sources: JCHS tabulations of US Census Bureau, 2000 Decennial Census and 2016 American Community Survey 5-Year Estimates; JCHS Neighborhood Change Database.J O I N T C E N T E R FO R H O U S I N G S T U D I E S O F H A R VA R D U N I V E R S I T Y5
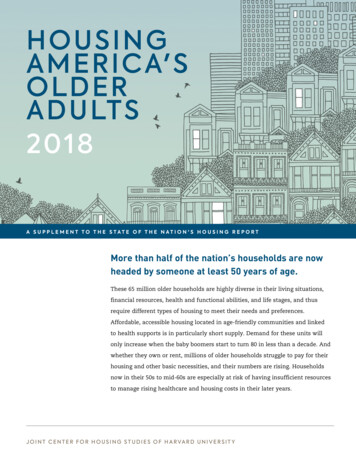
UNEQUAL DISTRIBUTION OF INCOME GROWTHHouseholds in their retirement years have seen significantincome growth in recent years. Indeed, between 2011 and2016, median incomes were up 9.6 percent for householdsin the 65–79 age range (to 44,100) and 5.2 percent for thoseage 80 and over (to 27,500). In contrast, the gains for working-aged households in their 50s to mid-60s were just 2.6percent, bringing the real median income for this age group( 66,500) only back to its 2010 level (Figure 6).For adults 65 and over, recent income growth in part reflectsa growing propensity to work past the traditional retirementage. In 2017, 8.3 percent of the population age 75 and overwas either employed or actively looking for work—nearlydouble the share 30 years ago. Over the past three decades,the labor force participation rate also rose 12.8 percentagepoints for 65–69 year olds and 9.5 points for 70–74 year olds.Between 2006 and 2016 (years that include the GreatRecession), the labor force participation rate for workersage 65 and over with bachelor’s degrees was up 5 percentage points, significantly more than among same-age adultswith high school diplomas (2.5 points) and especially thosewith less than a high school education (1 point). The ratefor older college graduates still held at 29 percent in 2016—a full 11 percentage points higher than that for high schoolgraduates and nearly three times that for older adults lacking a high school education.FIGURE 6The Incomes of Households in Their 50s to Mid-60sStill Lag Below 2010 Levels in Real TermsPercent Change in Median Household Income (2016 20122014 50–64 65–79 80 and Over All Older AdultsNote: Incomes are adjusted for inflation using the CPI-U for all items and based on three-year moving averages.Source: JCHS tabulations of US Census Bureau, Current Population Surveys.6H O U S I N G A M E R I CA ' S O L D E R A D U LT S 201 82016As it is, the number of older households with low incomesis growing. Between 2000 and 2016, the number of households age 50 and over earning less than 15,000 per yearrose by about 39 percent, from 6.4 million to 8.9 million.Households aged 50–64 accounted for 71 percent of thisnearly 2.5 million increase. Indeed, even though households in this age range made up just over half of all olderhouseholds in both 2000 and 2016, their share of olderhouseholds with low incomes increased sharply from 35percent to 45 percent. Meanwhile, the number of lowincome households aged 65–79 was also up 21 percent overthis period, while that of low-income households age 80and over grew 11 percent.DISPARITIES IN HOUSEHOLD WEALTHLike incomes, most of the recent gains in household wealthhave gone to the oldest age group. In 2013–2016, the networth of households age 80 and over rose 41 percent, settinga record of 272,000, while that of households aged 65–79remained fairly constant near 230,000. But even after a 15percent jump over this period, the net worth of 50–64 yearolds stood at just 170,000 in 2016—about 100,000 lower inreal terms than in 2007. At the same time, the share of households in the 50–64 age group with less than 20,000 in wealthincreased from 15 percent in 2001 to 22 percent of householdsin 2017.Homeowners have significantly more wealth than renters (Figure 7). The median homeowner aged 50–64 had anet worth of 292,000 in 2016—almost 60 times that ofthe same-age median renter. The difference in wealthbetween owners age 65 and over and same-age rentersis nearly as large. Even excluding home equity, the networth of owner households aged 50–64 was still nearly30 times higher than that of same-age renters, while thenet worth of owners age 65 and over was more than 24times higher.Moreover, even low-income owners have substantiallymore wealth than their renter counterparts. For example,owners age 65 and over earning under 15,000 per year hadonly 9,000 in non-housing wealth in 2016, but 80,000 inhome equity. Even so, given that low-income owners haveso much of their assets tied up in housing, they may find itdifficult to draw down that wealth if they need additionalfunds to cover basic expenses as they age.Another potentially troubling trend is that more olderhomeowners carry mortgage debt. In 1989, about 20 per-
cent of owners age 65 and over still had mortgages on theirhomes. By 2016, that share was up to 41 percent. Over thissame period, loan-to-value ratios also about doubled to 51percent for mortgage holders aged 50–64 and tripled to 39percent for those age 65 and over. A variety of mortgagemarket forces have contributed to this shift, includinglow interest rates and the increased popularity of homeequity loans once the 1986 tax reform act eliminated thedeductibility of interest on other forms of debt. Ownerswith higher net worth may in fact have the means to payoff their mortgages but choose not to because their lowinterest rates make other investments more attractive.But for financially constrained owners, carrying debt intotheir later years may mean having fewer resources fornecessities other than housing.THE BURDEN OF HIGH HOUSING COSTSThe number of households age 65 and over with housingcost burdens continues to climb. In 2016, 9.7 million households in this age group—nearly a third—spent more than30 percent of their incomes for housing. About 4.9 millionwere severely burdened, paying at least half their incomesfor housing, including 3.4 million aged 65–79 and 1.5 mil-lion age 80 and over. Although the cost-burdened shareof 50–64 year olds did decline a fraction of a point to 19.9percent in 2014–2016, a total of 10.2 million households inthis age group still faced at least moderate cost burdens,and nearly half of those households had severe burdens.The overall share of households age 50 and over with costburdens also inched down from 32 percent to 31 percent in2006–2016, but all of the improvement came on the homeowner side. For owners, growth in income outpaced anyrise in housing costs, reducing the cost-burdened share to24 percent. The cost-burdened share of older renters, however, increased from 48 percent to 50 percent. But giventhat many more older adults own homes than rent, costburdened owner households age 50 and over (11.8 million)still outnumbered cost-burdened renter households (8.0million) in 2016.Since incomes typically fall as households grow older, it isunsurprising that the share of cost-burdened householdsalso rises with age (Figure 8). In 2016, 36 percent of households age 80 and over were burdened, compared with 29percent of households aged 50–64 and 31 percent of households aged 65–79. Regardless of age, though, individuals liv-FIGURE 7Even Excluding Home Equity, Homeowners Have Far Greater Wealth than RentersMedian Value (Dollars)Homeowners Aged50–64Renters Aged50–64Home EquityNon-HousingWealthNet Worth115,000147,000292,020135,000198,00075,000Less than 15,000Homeowners Age 65and OverRenters Age 65and OverHome 10079080,0009,35094,910970 124,0003,660 00242,00019,300 ,000369,70069,000 75,000 or 7,600336,140All HouseholdsNet WorthNet WorthNet WorthRace/EthnicityWhiteMinorityIncomeNote: Medians are calculated independently, so home equity and non-housing wealth do not sum to net worth.Source: JCHS tabulations of Federal Reserve Board, 2016 Survey of Consumer Finances.J O I N T C E N T E R FO R H O U S I N G S T U D I E S O F H A R VA R D U N I V E R S I T Y7
ing alone have the highest burden rates (46 percent) of anyhousehold type, affecting 3.9 million older adults.Renters are more likely than owners to be cost burdened,including 47 percent of those aged 50–64, 53 percent ofthose aged 65–79, and 58 percent of those age 80 and over.Households in all older age groups that own their homesfree and clear fare far better, with just 15 percent facingcost burdens. Among owners age 80 and over that stillcarry mortgage debt, however, the cost-burdened share is56 percent—nearly the same as for renters.Many older households rely largely on Social Security benefits as their main source of income. Indeed, Social Securitypayments accounted for 69 percent of the income for themedian older household in 2016. But between 2006 and2016, Social Security payments rose just 6 percent in realterms while the median rent for households age 65 andover climbed at twice that rate. Looking ahead, the abilityof many older adults to afford their housing will be closelytied to the fate of the Social Security program.SHORTFALL IN HOUSING SUBSIDIESHUD’s 2017 Worst Case Housing Needs report indicatesthat the number of US households age 62 and over withvery low incomes (less than 50 percent of area median)with severe cost burdens and/or living in severely inad-equate housing rose from 1.5 million in 2013 to 1.9 millionin 2015. Only one in three of these households in needreceives housing assistance.When housing costs consume a large portion of householdbudgets, older adults often sacrifice on other necessities.According to the latest Consumer Expenditure Survey,severely cost-burdened older households in the bottomexpenditure quartile spent 53 percent less on food and 70percent less on healthcare than otherwise similar households that live in housing they can afford (Figure 9).Meanwhile, homelessness among older adults is increasing.In New York City, which has the nation’s largest homelesspopulation, the number of people age 65 and over experiencing homelessness nearly doubled between 2011 and 2015. A2013 study by Culhane et al. found that baby boomers bornbetween the mid-1950s and mid-1960s are especially atrisk, with homelessness rates twice those of other cohortsat the same age. In addition, the National Coalition for theHomeless notes that support from major safety-net programs is unavailable to the younger members of this group,with eligibility for Medicare starting at age 65 and for HUDsubsidized housing for older adults at age 62.Supportive services in permanent housing programscould help address the growing needs of low-income andvulnerable older adults. As it is, however, federal fundsFIGURE 8Shares of Both Renters and Owners with Cost Burdens Increase with Household AgeShare of Households Paying at Least 30 Percent of Income for Housing Age Group Renters Owners with Mortgages Owners without MortgagesNote: Households with zero or negative income are assumed to have burdens, while households paying no cash rent are assumed to be without burdens.Source: JCHS tabulations of US Census Bureau, 2016 American Community Survey 1-Year Estimates.Please edit notes in Exhibit note master document8H O U S I N G A M E R I CA ' S O L D E R A D U LT S 201 870–7475–7980 and Over
for new supportive housing for older adults under Section202 are scarce. In fact, no new construction has beenfunded through this program since 2012, with currentfunds covering only renewals on existing housing, servicecoordination grants, and administrative costs. And allocations for these costs were cut 5 percent, by 33 million, in2016–2017.In addition to helping older adults afford their rents, assisted housing also tends to offer more accessibility and safetyfeatures than unsubsidized units. Joint Center analysis ofthe 2016 National Health and Aging Trends Study foundthat assisted units are more likely to have ramps or no-stepentries, as well as grab bars and medical emergency callsystems in bathrooms.SHORTAGE OF ACCESSIBLE HOUSINGAccessible housing becomes increasingly important forolder adults as their functional limitations increase. In2016, 26 percent of households age 50 and over included amember with at least one vision, hearing, cognitive, selfcare, mobility, or independent living difficulty. Difficultyclimbing stairs or walking is the most common disability,affecting 17 percent of these households. Mobility challenges increase sharply with age, with the share of adults withambulatory problems rising from just 11 percent of 50–64year olds to 43 percent of those age 80 and over.Minority households are more likely than same-age whitehouseholds to have at least one difficulty, although differences narrow over time. For example, 34 percent ofblack households aged 50–64 include a member with atleast one difficulty, compared with 26 percent of whitehouseholds. Among households 80 and over, however,the shares with at least one difficulty are 62 percent forwhite households, 65 percent for Asian/other households, 66 percent for black households, and 67 percentfor Hispanic households.safely in place without making certain home modifications.Fortunately, many older homeowners are in a financialposition to make at least some modifications. The AmericanHousing Survey shows that among owners age 65 and overwho reported improvement spending in 2016–2017, 11 percent indicated that at least one of their projects was relatedto accessibility. Households in the 55-and-over age groupalready account for more than half of home improvementspending, and JCHS projections suggest they will drive morethan three-quarters of the growth in market spending in2015–2025.But renters, as well as owners with little wealth, mayrequire government assistance to make their homes moreaccessible. In fact, ambulatory and other limitations aremore common among households that can least afford thecare or home modifications they require. Half of households age 50 and over with incomes of less than 15,000had at least one difficulty in 2016, compared with onlyabout a fourth of those making at least 75,000.Some municipalities and states now offer tax credits andlow-interest or deferred loans for those seeking to makehome accessibility improvements. Localities may alsouse federal funds including Community DevelopmentBlock Grants to assist low-income older adults (and landlords) in making modifications. In addition, MedicaidHome and Community Based Waivers may support theFIGURE 9Low-Income Households with Severe Cost BurdensHave Little to Spend on Other NecessitiesMedian Monthly Expenditures of Low-Income Households Age 65 and Over (Dollars)400350300250Few homes in the United States are accessible to peoplewith mobility problems, particularly those requiring theuse of a wheelchair. According to the latest available estimates from 2011, only 3.5 percent of US homes had singlefloor living, no-step entry, and extra-wide halls and doors.If electrical controls reachable from a wheelchair and leverstyle handles on doors or faucets are included in the list,the share drops to just 0.9 percent.The lack of accessibility features in much of the nation’shousing stock will make it difficult for older adults to age200150100500FoodHealthTransportation Not Burdened Severely BurdenedNotes: Low-income households are in the bottom quartile of all households ranked by total spending. Not burdened(severely burdened) households devote 30% or less (more than 50%) of expenditures to housing, including utilities.Source: JCHS tabulations of US Bureau of Labor Statistics, 2016 Consumer Expenditure Survey.J O I N T C E N T E R FO R H O U S I N G S T U D I E S O F H A R VA R D U N I V E R S I T Y9
costs of these types of improvements. For householdswith long-term care insurance, some policies will pay forthe addition of accessibility features such as ramps andgrab bars if needed.VULNERABILITY TO NATURAL DISASTERSOlder adults are much more at risk from extreme weatherevents and natural disasters than younger age groups.According to a 2016 Environmental Protection Agencyreport on climate change and older adults, more than halfof the deaths from Hurricane Katrina we
ages 65 and over, while older black adults are more likely to live in their own homes at all ages 65 and over. The number of three-generation households with at least one member age 65 and over grew from 1.7 million in 2006 to 3.2 million in 2016. Within racial/ethnic groups, 19 per-