Transcription
100 METHODS FOR TOTALQUALITY MANAGEMENTCopyrighted Material
Copyrighted Material
METHODS FOR TOTALQUALITY MANAGEMENT100Gopal K. KanjiandMike AsherLondonSage Publications Thousand Oaks. New DelhiCopyrighted Material
Gopal K. Kanji and Mike Asher 1 996First published 1 996All rights reserved. No part of this publication may bereproduced, stored in a retrieval system, transmitted orutilized in any form or by any means, electronic, mechanical,photocopying, recording or otherwise, without permission inwriting from the Publishers.SAGE Publications Ltd6 Bonhill StreetLondon EC2A 4PUSAGE Publications Inc2455 Teller RoadThousand Oaks, California 9 1 320Sage Publications India Pvt Ltd32 M-Block MarketGreater Kailash - INew Delhi 1 10 048British Library Cataloguing in Publication dataA catalogue record for this book is available from the BritishLibraryISBN 0 8039 7746 8ISBN 0 8039 7747 6 (pbk)Library of Congress catalog record availableTypeset by Photoprint, Torquay, DevonPrinted in Great Britain at the University Press, CambridgeCopyrighted Material
CONTENTSviPrefaceUnderstanding Total Quality Management1The Role of TQM Methods8List of Methods (by Category)10Purpose of Methods (Alphabetical List)13Management Methods20Analytical Methods79Idea Generation1 23Data Collection, Analysis and Display1 54References234Index236Copyrighted Material
PREFACEAn essential part of the development of a total quality management(TOM) process should be the education and training of everyone in theorganization. The main objective should be to provide information on theprinciples and philosophy of TOM and training in the methods to helpthe organiz tion implement total quality management in a systematic way.One of the main purposes of this book is to help all employees tounderstand the proper use of the total quality management methodsrequired for the achievement of their organization's quality goals. It willalso provide the educators and practitioners in this area with a comprehen sive set of TOM methods.Total quality management encompasses certain basic principles. Toimplement and practise these principles, it is necessary to understand theworking of various methods of total quality management. These methodsare classified in this book within four categories:Management methods: for example, Deming wheel (Method 10) .Analytical methods: for example, failure mode and effect analysis (Method37) .Tdea generation: for example, brainstorming (Method 5 1 ) .Data collection, analysis and display: for example, tally charts (Method96) , histograms (Method 78) and pie chart (Method 88) , respectively.A list of methods, by category, is given on p. 10; an alphabetical list of allmethods (with a brief description of their purpose or use) is given on p. 13.Within each category, each TOM method is explained simply under thefollowing headings: purposewhen to usehow to usebenefitsexampleWhen put into practice, appropriate quality methods can rapidly give riseto quality improvement. Choosing the right methods for the developmentof a TOM process is one of the vital roles of management and the degree ofsuccess obtained will depend upon managerial skill . The total qualitymanagement process is complex and the use of some of these methodsrequires careful consideration and clear understanding.Copyrighted Material
UNDERSTANDING TOTAL QUALITYMANAGEMENTTotal quality management principlesTo understand the process of total quality management (TOM) , we willfollow Kanji and Asher (1 993) where all work is seen as 'process' andtotal quality management is a continuous process of improvement forindividuals, groups of people and whole organizations. What makes totalquality management different from other management processes is theconcentrated focus on continuous improvement. Total quality manage ment is not a quick management fix; it is about changing the way things aredone within the organization's lifetime. To improve the process, therefore,people must know what to do , how to do it, have the right methods to do it,and be able to measure the improvement of the process and the currentlevel of achievement.Total quality management encompasses a set of four principles and eightcore concepts. The four guiding principles are: delight the customer management by fact people-based management continuous improvementEach of the principles can be used to drive the improvement process.However, to achieve this, each principle is expressed with the help of twocore concepts to make the principle workable . The eight core concepts aregiven in Table 1 .Delight the customerThis focuses on external customers and asks 'What would delight them?'This implies a real need to understand the product or service, agreerequirements and fulfil them . 'Delight' means being best at what reallyTable 1Principles and core concepts of TQMPrinciplesCore conceptsDelight the customerCustomer satisfactionInternal customers are realAll work is processMeasurementTeamworkPeople make qualityContinuous improvement cyclePreventionManagement by factPeople-based managementContinuous improvementCopyrighted Material
21 00 METHODS FOR TOTAL QUALITY MANAGEMENTmatters most to the customer and this can change over time. Being in touchwith these changes and always satisfying the customer are an integral partof total quality management .Management by factKnowing the current quality standards of the product or service in yourcustomer's hands is the first stage of being able to improve. You can onlymeasure your improvement if you know the base you are starting from .Having the facts necessary to manage the business at all levels, and givingthat information to everyone so that decisions are based upon fact, are anessential aspect of continuous improvement.People-based managementIf people understand what to do, how to do it and obtain feedback on theirperformance, they can be encouraged to take responsibility for the qualityof their own work . The more people feel involved, the greater will be theircommitment to customer satisfaction . Systems, standards and technologythemselves will not provide quality. The role of people is extremely importantin the continuous improvement of quality within an organization.Continuous improvementTotal quality management is not a short-term activity that will finish whena set target has been achieved. It is not a programme or a project. It is amanagement process that recognizes that, however much we may improve ,our competitors will continue to improve and our customers will expectmore from us. Here , continuous improvement is an incremental changeand not a major breakthrough, which should be the aim of all who wish toundertake the total quality management journey.Core con cepts for improvementEach of the eight core concepts given in Table 1 can be used to drive theprocess of continuous improvement and to develop a framework forquality improvement over many years.Customer satisfactionMany companies, when they start the quality journey, become veryintroverted and deal with their own internal problems, neglecting theirexternal customers. A better way is for companies to use their customers tolearn what is important to them and then measure their own performanceagainst customer expectation. Asking your customers to set customersatisfaction goals is a clear sign of an outward looking company.To fulfil customer satisfaction , Federal Express , an American company,surveyed their customers to identify the top ten causes of aggravation . Theaggravation points were weighted according to customer views of howimportant these were . A complete check was made of all occurrences and aCopyrighted Material
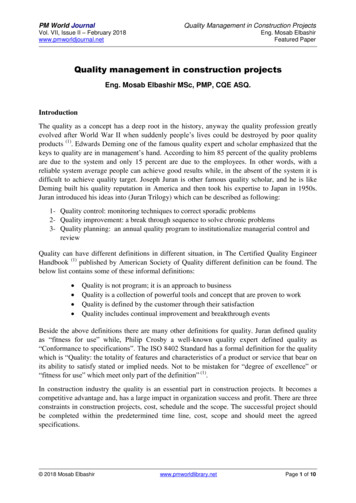
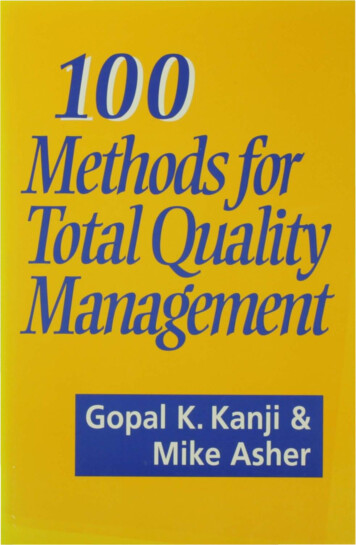
UNDERSTANDING TOTAL QUALITY al System3 ServicesMethodsEnvironmentFigure1Processweekly satisfaction index compiled. This allowed the company to keep aweekly monitor of customer satisfaction as measured by the customer.Internal customers are realKanji and Asher's (1993) definition of quality - 'satisfying agreed cus tomers' requirements' - relates to internal customers as well external ones.Many people also refer to the customer-supplier chain. We believe that itis necessary to achieve successful internal working relations in order tosatisfy the needs of the external customer.Whether you are supplying products or a service, the people you supplyinternally are as real as your external customers. They also require speed,efficiency or accurate measurement, but achieving a quality servicebetween internal customers can sometimes be time-consuming. One way todeal with this is to assess poor quality in financial terms. Measuring theactual cost of poor quality, and the way that amount is made up, canprovide an impetus for management to follow the quality improvementpath . In this way, you can use the idea of the internal customer as a focusfor improvement.All work is processAnother possible focus for improvement is that of business processes. Aprocess is a combination of methods, materials, manpower and machines(see Figure 1) that, taken together, produce a product or service . Allprocesses contain inherent variability and one approach to quality impro vement is progressively to reduce variation. This can be done , first, byremoving variation due to special causes and, secondly, by driving downthe common cause of variation , thus bringing the process under controland them improving its capability.MeasurementThis core concept of total quality management suggests that, in order toimprove, we must first of all measure how we are doing at present. Bymeasuring our present situation , we can focus both internal customerCopyrighted Material
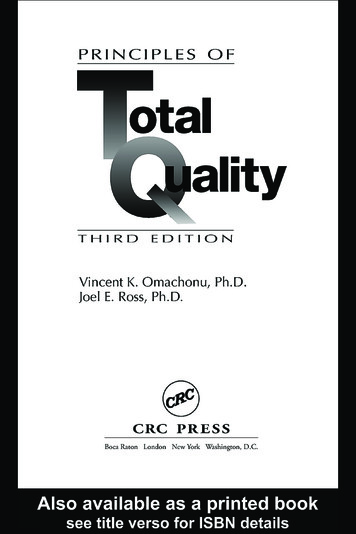
41 00 METHODS FOR TOTAL QUALITY MANAGEMENTsatisfaction and external customers' requirements. Internal qualitymeasurement of production might include : breach of promiseperformance to standardreject levelaccidentsprocess in controlyield/scraptime cost due to non-available raw materialnumber of changes to works ordercost of qualityTeamworkTeamwork can provide a real opportunity for people to work together toachieve quality improvement . People who work on their own or in a smallgroup often have a picture of their organization and the work that it doeswhich is very compartmentalized. They are often unfamiliar with the workthat is done even by people who work quite near to them: as a result theyare unaware of the consequences of poor quality in the work theythemselves do.Bringing people together in teams, with the common goal of qualityimprovement, aids communication between departmental or functionalactivities. Teamwork slowly breaks down the communication barriers andacts as a platform for change . Communication is part of the cement thatholds together the bricks of the total quality management process support ing the principle of people-based management.To communicate properly, it is necessary to focus on the receiver of themessage . Communication is very much a two-way process. Managers oftentalk about the 'middle management sponge' into which information seemsto go but out of which no information comes. Part of the problem is a lackof focus on the needs of those receiving the information. Figure 2 depicts acompany with poor communication. For successful communication , youneed to build credibility into the message and in the person giving themessage . Anything that detracts from this does damage to both.Teamwork also enables a group of people to work as a task force,looking at cross-functional problems, or as an action team , solving localproblems, in order to identify and adopt new ways of doing things.People make qualityMost of the quality problems within an organization are not normallywithin the control of the individual employee. As many as 80 per cent ofthese problems are caused by the way the company is organized andmanaged. The system often gets in the way of employees who are trying todo a good job. In such a situation it is difficult to solve the problem bysimply telling the employees to do better. In these circumstances employeeCopyrighted Material
UNDE RSTANDING TOTAL QUALITY MANAGEMENT5unior managementFigure 2Poor communication in an organizationmotivation alone cannot work. It requires real practical efforts on the partof managers to remove the barriers to quality improvement.The role of managers within an organization is to ensure that everythingnecessary is in place to allow people to make quality. This, in turn , beginsto create the environment where people are willing to take responsibilityfor the quality of their own work. Releasing the talents of everyone withinthe organization in this way can create a culture for quality improvement.Continuous improvement cycleThe continuous cycle of establishing customers' requirements, meetingthese requirements, measuring success and keeping on improving can beused both externally and internally to fuel the engine of continuousimprovement. By continually checking customer requirements, a companycan keep finding areas in which improvements can be made. This continualsupply of opportunities can be used to keep quality improvement plans up todate and to reinforce the idea that the total quality journey is never-ending.PreventionThis concept is central to total quality management and provides a positiveapproach to achieving continuous improvement. Prevention means seekingto ensure that failures will not occur. The continual process of removingthe problems and failures out of the system will create a culture ofcontinuous improvement.Copyrighted Material
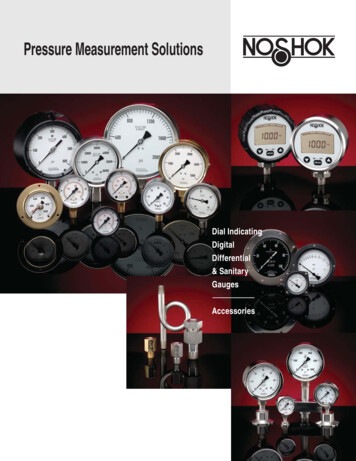
61 00 METHODS FOR TOTAL QUALITY MANAGEMENTThere are several methods which are widely used for this purpose.Failure mode and effect analysis (Method 37) is a well-known methodassociated with both design and process analysis.Pyramid model and leadershipFrom the outset, the total quality management approach has the vision thatconcentrated management action can improve the quality of service orproducts of an organization , at a very competitive cost, satisfying cus tomers' needs and increasing market share. This increased market sharewill be stable because it has been earned with the help of solid customergoodwill and not by gimmicky advertising.Kanji and Asher (1993) suggested a model which illustrates the princi ples of TOM as a pyramid. The base of the pyramid is occupied by the fourprinciples of TOM and two core concepts correspond to each side of thepyramid. Although in Kanji and Asher's model the leadership of topmanagement is central to the creation of a TOM organization, this is notemphasized in their diagram. We therefore produce a modified version ofthe pyramid model of TOM (see Figure 3) by simply extending the base ofthe pyramid. Here the organization has to be guided through the TOMprinciples and core concepts by top management leadership.Copyrighted Material
UNDERSTANDING TOTAL QUALITY MANAGEMENT ,:,.0 rq O0'. \S cP T Q MDelight the customerLeadershipFigure 3Pyramid model of TQMSource: Kanji and Asher, 1 993Copyrighted Material7
TH E ROLE OF TQM M ETHODSTotal quality management can be implemented by putting into practicesuitable TQM methods. However, adopting the right kind of method is oneof the most important jobs of senior management and the degree ofsuccess obtained will depend on their knowledge and understanding ofthese methods. TQM methods are unlikely to be useful if not usedproperly.When TQM is implemented in an organization , it invariably starts with asimple procedure : the setting up of teams to solve particular problems.However, total quality management deals with quality culture, which is allabout culture change based on a desire to satisfy the customer andeliminate existing problems permanently.Education and training are key factors in total quality management,including the process of learning TQM methods. If teams start to look atquality management problems without proper training they will lose theirway and become disheartened. If the quality problem is not identifiedaccurately and the TQM method selected for solution based only on dataanalysis, then the problem will not be eliminated forever. In addition , thequality improvement process needs to be managed by an effective leader toensure that proper implementation is achieved . By applying TQM methodsproperly and not fluctuating from one step to another before completion ,the quality team will have a much greater chance of completing the tasksuccessfully.The problem-solving process is a natural and logical sequence forovercoming quality problems and improving the standard of decision making. It is also a guide for identifying which total quality managementmethods to be applied. Problems, no matter what their size or complexity,can best be solved by proceeding through a sequence of steps. This ensuresthat everything possible will be done by applying the available TQMmethods in the most effective manner. It also gives the opportunity toconsider a number of options and to select the best solutions.Many quality problems, on the surface , appear to be simple to solve, andit is easy to leap to the first available solution . However, in the long term,for many problems it is unlikely that the best solutions will be found in thiseasy way. It is also possible that some side-effects will be generated,causing problems in other areas.In total quality management all work is a process and the problem solving process is a continuous cycle of opening your mind to a wide rangeof possible solutions and then deciding on the most feasible option . It isthis continuous approach and the narrowing of the options that makes theTQM process so powerful .Copyrighted Material
THE ROLE OF TOM METHODS9The basic role of TOM methods in problem-solving for quality improve ment is to help meet customer requirements. The methods also help togenerate possible root causes and potential solutions, and to use data andinformation to select the best options for managing quality. To implementtotal quality management, it will be necessary to apply the methods inevery aspect of business life.Copyrighted Material
LIST OF M ETHODS ( BY CATEGORY)Management 2728293031Acceptable quality level (AQL)Affinity diagramArrow diagramBenchmarkingConsensus reachingContingency planningCost-benefit analysisCriteria testingCustomers' contingency tableDeming wheel (PDCA)Departmental purpose analysis (DPA)Error proofing (pokayoke)Force analysisGannt chartsISO 9000Just in time (JIT)KaizenMystery shoppingObjective rankingPareto analysisPotential problem analysis (PPA)Problem prevention planProcess decision programme chartProgramme evaluation and review (PER) techniqueQuality circlesQuality function deployment (QFD)Relation diagramTeamworkTotal productive maintenanceWhy-how chartingZero 1636567697274757778Analytical methods3233343536Cause and effect analysisCritical path analysis (CPA)Departmental cost of qualityDomainal mappingEvolutionary operation (EVOP)Copyrighted Material798]858789
LIST OF METHODS3738394041424344454647484950Failure mode and effect analysis (FMEA)Fault tree analysisForce field analysisMinute analysisPaired comparisonsParameter designProcess cost of qualityReliabilityRobust design (off-line quality control)Solution effect analysisStratificationSystem designTaguchi methodsTolerance a tormingBrainwritingBreaking setBuzz groupsIdea writingImagineeringImprove internal process (lIP) planLateral thinkingList reductionMind mappingMorphological forced connectionsMulti-votingNominal group techniqueOpportunity analysisRich picturesSnowballingSuggestion 49151153Data collection analysis and display68 Bar charts69 Basic statistics70 Box and whisker plots71 C chart72 Checksheets73 Concentration diagrams74 Cusum chart75 Dot plots154156159161164166168171Copyrighted Material
1001 00 M ETHODS FOR TOTAL QUALITY M A N AG E M E NTFlowchartsGeometric moving averageHistogramsHoshin kanri (quality policy deployment)Is/is not matrixMatrix data analysisMatrix diagramMoving averageMulti-vari chartsNP chartPaynter chartP chartPie chartsProcess analysisProcess capabilitySamplingScatter diagramsSpider web diagramsStatistical process control (SPC)Stem and leaf diagramTally chartsTree diagramsU chartX moving range (X-MR) chartX-R chartCopyrighted 208210212214216219221223225228231
PURPOSE OF M ETHODS (ALPHABETICAL LIST)MethodTo provide astructure of sampling plans, risks and inspectionstrategies to ensure that the customer receives thequality that the supplier has contracted to deliver.Affinity diagram To organize large amounts of data ingroups according to some form of natural affinity.Arrow diagram To show the time required for solvinga problem and which items can be done in parallel.Bar charts To display discrete data collected bychecksheets so that patterns can be discovered.Basic statistics The mean , median , mode , range andstandard deviation are ways of summarizing and describinglarge volumes of data. The first three are measures oflocation, the last two are measures of spread.Benchmarking To identify and fill gaps in performanceby putting in place best practice, thereby establishingsuperior performance .Box and whisker plots To provide a simple way ofdrawing the basic shape of the distribution of a set ofdata.Brainstorming To generate as many ideas as possiblewithout assessing their value.Brainwriting To generate as many ideas as possible .Breaking set To overcome blocks in thinking bygenerating new ideas. It is particularly useful in promptinga group to be more receptive to new suggestions.Buzz groups A way of getting the immediate reactionof a group to a new idea or problem .Cause and effect analysis To examine effects orproblems to find out the possible causes and to pointout possible areas where data can be collected.C chart To identify when the number of defects in asample of constant size is changing over time.Checksheets To collect data when the number oftimes a defect or value occurs is important.Concentration diagrams To collect data when thelocation of a defect or problem is important.Consensus reaching To give a team a methodicalway of examining alternatives to reach a collectiveconclusion which all team members can accept.20Acceptable quality level (AQL)Copyrighted 7541293279711617216473166530
141 00 M ETHODS FOR TOTAL QUALITY MANAG E M E NTContingency planning To avoid 'firefighting' andwaste of resources by planning for contingencies in thecompletion of a project.Cost-benefit analysis To estimate the real cost andbenefits of a project under consideration .Criteria Testing To evaluate and compare alternativesolutions to a problem by rating them against a list ofcriteria .Critical path analysis A project planning techniquewhich separates the work to be done into discreteelements, allowing the key elements that affect theoverall project to be identified.Customers' contingency table To understand theneeds of both internal and external customers for thefulfilment of customer satisfaction .Cusum chart To identify when the mean value ischanging over time.Deming wheel (PDCA) A management concept tosatisfy the quality requirements of the customer byusing the cycle: plan, do , check and action .Departmental cost of quality To provide a financialmeasure of the quality performance of an organization.Departmental purpose analysis (DPA) To review theinternal customer-supplier relationship.Domainal mapping To assist in the identification ofinternal customers and their needs.Dot plots A simple graphic device which presentsobservations as dots on a horizontal scale .Error proofing (pokayoke) To design an operation insuch a way that specific errors are prevented fromcausing major problems to the customer.Evolutionary operation (EVOP) A sequentialexperimental procedure for collecting informationduring on-line production to improve a process withoutdisturbing output.Failure mode and effect analysis (FMEA) To assist inthe foolproofing of a design or a process.Fault tree analysis To perform a quantitative as wellas qualitative analysis of a complex system .Flowcharts To generate a picture of how work getsdone by linking together all the steps taken in a process.Force analysis To identify external and internal forcesat work when developing a contingency plan.Force field analysis Allows you to identify thoseforces that both help and hinder you in closing the gapbetween where you are now and where you want to be.Copyrighted 12433689379138967617313443998
PU R POSE O F M ET H O DSGannt charts For planning the steps necessary toimplement quality improvement.Geometric moving average To identify trends in smallchanges in the process mean . The geometric movingaverage is sometimes called the exponentially weightedmoving average (EWMA) .Histograms To display continuous data collected bychecksheets so that any patterns can be discovered.Hoshin kanri (quality policy deployment) To delightthe customer through the manufacturing and servicingprocess by implementing the quality goals of theorganization .Idea writing To bring all participants into groupwork.Imagineering To assist a company to identify areas ofopportunity by concentrating on the ideal outcomethen working back from it.Improve internal process (lIP) plan To provide thestructure to develop work plan details for a task usingvarious factors, such as measurables, responsibleresources, times and previous task owners.Is/is not matrix To identify patterns in observedcharacteristics by a structured form of stratification .ISO 9000 To demonstrate to yourself, your customersand an independent assessment body that you have aneffective quality management system in place.Just in time (JIT) To deliver the raw materials orcomponents to the production line to arrive just in timewhen they are needed.Kaizen A Japanese term meaning 'change for thebetter' , the concept implies a continuous improvementin all company functions at all levels.Lateral thinking A way of transferring from oneframe of reference to another, enabling you to breakdown barriers which inhibit creative thought.List reduction To reduce a list of ideas to one ofmanageable size.Matrix data analysis To provide a picture ofnumerical data from a matrix diagram in an efficientway.Matrix diagram To provide information about therelationship and importance of task and methodelements of the subject.Mind mapping A way of generating and recordingideas individually rather than in a group. Mindmapping makes use of word associations, encouragingyou to fol low your own thought patterns, whereverCopyrighted 548165017515813659138811868218860140
161 00 M ETHODS FOR TOTAL QUALITY MANAG E M E NTthey lead. It also provides a written record of the ideasgenerated.Minute analysis To estimate the survival period of aparticular product unit under certain conditions, usinga simulated experimental environment.Morphological forced connections To generate newideas or ways of approaching problems. It combineslists of attributes and forces new connections betweenthem, so triggering new options.Moving average To identify trends in data whenshort-term variation or cyclical patterns are confusingthe longer-term picture .Multi-vari charts To show the dispersion in a processover the short and long term , using a graphic controlchart.Multi-voting To select the most popular or importantitems from a list.Mystery shopping A technique involving looking atyour business from the outside and measuring theefficiency of your own key processes from thecustomer's viewpoint.Nominal group technique A way of generating ideasfrom a group and identifying the level of supportwithin the group for those ideas.NP chart To identify when the number of defectiveitems in a sample of constant size is changing overtime.Objective ranking Helps to place your current activityin perspective and enable you to understand thepurpose of your efforts.Opportunity analysis Offers the opportunity toevaluate quickly a long list of options against desiredgoals and available resources.Paired comparisons To help a group to quantify thepreferences of its members.Parameter design To determine which factors areimportant in the manufacturing process and to find theoptimum set of working conditions .Pareto analysis To separate the most importantcauses of a problem from the many trivial . Also, toidentify the most important problems for a team towork on .Paynter charts To display information over time in away that allows changes in patterns of failure to bediscovered. Paynter charts will show when one failureCopyrighted 4641474110342105205686197
P U R POSE O F M ETHODSmode takes over from another in terms of importanceor when the overall failure rate is changing over time.P chart To identify when the percentage of defectiveitems in a sample of variable size is changing overtime.Pie charts A way of pictorially representing data, piecharts are an effective means of showing the relativesize of the individual parts to the total.Potential problem analysis (PPA) To examine plansto identify what can go wrong with them , so thatpreventive action can be taken .Problem prevention plan To anticipate what can gowrong and plan to prevent problems.Process analysis Enables a group to look foropportunities to improve processes. It can also be usedto identify standards and measures for critical parts ofprocesses.Process capability To demonstrate whether a processis capable of meeting
Total quality management principles To understand the process of total quality management (TOM), we will follow Kanji and Asher (1993) where all work is seen as 'process' and total quality management is a continuous process of improvement for individuals, groups of people and whole organizations. What make