Transcription
4 Hour MACD Forex StrategyWelcome to the 4 Hour MACD Forex Strategy. This strategy is aimed atsimplicity as well as high probability trades. I have been in the equity market foralmost ten years now and in the forex market for two years. I learned very early thatforex trading is not for the shaky ones. One must have a tested and definite tradingstrategy as well as well organized discipline to follow the strategy and execute theplan as to the letter. One must be exact and precise.Therefore I paper traded for almost two years and read everything I could laymy hands on. I bought books and courses. I attend a 5 day live web seminar. All thisdid not help me at all as it did not fit my style of personality and I just did not seem toconnect with all this different strategies. Over two years of watching the graphs withdifferent indicators, moving averages etc. I started to get a feeling for the movementand motion of the market especially the EurUsd around certain moving averages.It wasn’t till late last year that I discover a setting with the MACD that giveseasy to read signals on a regular basis on a 4 hour timeframe. I like the 4 hourtimeframe as one are not glued to the screen full time.If you look at FIG 1 below you will see that there were 14 signals over aperiod of 5 weeks. Within that period of FIG 1 the signals given were pretty good.There are times when some signals does not produce positive results. I then had towork on a filter system to only let me take the best ones. I found that the MACDwhen moving in a certain way produces a 95% accuracy. I will show you later howthe high probability trades look like.In FIG 1 the signals are shown and FIG 2 shows that an entry is made afterthe 4 hour bar has closed and at the opening of the next bar.In FIG 3 another 19 deals were shown of which the last one was not finishedyet so out of a total of 18 trades 5 were wrong and 13 were right.As it is a 4 hour strategy it means sometimes setting the alarm clock to catchan entry in the early morning hours. What makes it nice is that one will know after theclose of a 4 hour bar whether the next 4 hour bar might close as a signal by justfollowing the MACD. Therefore one can set an alarm at that time.Have a look at FIG 1 to 3.Disclaimer:As trading in the Forex market is very risky, the reader if going beyond thispoint and applying the concepts and methods describing in this document do so onhis or her own will and risk. The writer and or anyone involved in the compiling ofthis document will not be held responsible for any losses incurred by using themethods described in this document as no money management nor stoploss levels arediscussed as it vary from trader to trader according to there own risk and capitalprofiles.
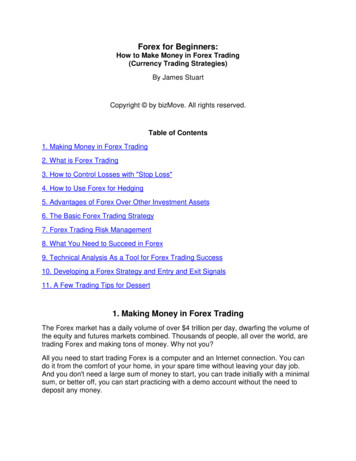
FIGURE 1
FIGURE 3This was just to see and get a feeling for the graphs. Let us start to set-up our charts.Moving Averages:First of all are the moving Averages that we are going to use.1. 365 Exponential Moving Average (365EMA)2. 200 Simple Moving Average (200SMA)3. 89 Simple Moving Average (89SMA)4. 21 Exponential Moving Average (21EMA)5. 8 Exponential Moving Average (8EMA)MACD:MACD settings at1. Fast EMA 52. Slow EMA 133. MACD EMA 1
Horizontal Lines:Three sets of horizontal lines above and below zero should be drawn on the MACDwindow at levels as well as one on zero1. Level 0.00152. Level 0.00303. Level 0.00454. Level –0.00155. Level –0.00306. Level –0.0045Your Graph should look like this: (Choose your own colour and styles)The MACD moves in certain patterns that when recognized can be very profitabletrades. Let me show you the very important ones first. By not following every signalbut only the ones that gives high probability trades through certain MACD patternsserves as a filter. The ones not familiar are not taken. This is the filter.
This pattern comes very regular especially A and D as the MACD has moved beyondthe 0.0045 level and are due for a correction and or trend reversal. B and C are trendcontinuing patterns and are entered in the direction of the trend. Red circles indicatesentry signal and entry is made on the opening of the next bar.The head and shoulder is another definite.
Double top and bottom does not need anyintroduction as it speaks in any timeframe.When the MACD comes down towards theZero line and turn back up just above theZero line it is normally a trend continuingand should be taken and are normally astrong move.
Round tops and bottoms are for sure. Justbe careful when within the first zone0.0000 to 0.0015 above or below the zero.I like the rounding to be formed over atleast 5 bars.
This was a difficult month (Jan 2007)up to now but already 190 Pips up and a greatmove is coming as the price is within a range for almost 8 days. Lets see if that willhappen.Up to now I have only concentrated to give the signal on the MACD window so thatyou will be able to recognize it. It is easy to see the formation after it has formed. Ittakes a bit of practice to recognize it while it is forming. Lets look at a couple just tosee how they look when the trade is entered.
Let us look at the graph above. See how price levels play a roll in the support andresistance of the price movement. Say we entered the trade at Entry above. Our firstprofit target will be around our fast moving averages (8EMA and 21EMA). Oursecond profit target will be around the slow moving averages(89SMA and365EMA).Our third profit target will be at price level 1.2100 etc etc etc.This is how you plan your trade in advance to take partial profits till you complete thetrade. Should there be a moving average or price level nearby and below your entrylevel you must take note that the price might go and test them. So your stoploss mustbe aware of that.Again I ask you to study the movement of the price around the moving averages.When the price are above the 89SMA the trend is normally up and visa versa. Afterthe price crosses the 89SMA it tends to pullback to the 21EMA before it carry on itsdirection if it is a trend direction change otherwise it tend to test the 89SMA again andthen it runs over and across the 89SMA till it finds direction and then it pulls back tothe 21EMA before proceeding on its path.
Here are a live trade I did for someone in explaining how I trade. This is actuale-mails that I did send. 25 January 2007 21:00 (GMT 2)HiI took it with 30 pip stoploss and hope I can add to the Gbpone earlier this week.GreetingsThe MACD pulled back to the Zero line and then closes lower which indicate a downmove.“Got entry at 1.2955 and has set stoploss at breakeven at 1.2955 whenprice did hit 1.2935. I am scared for a false breakout below supportbut now the price can turnaround as I have a free ride.”
“Took 50% profit at 1.2920 and set other half stoploss at 1.2935”“HiAmazing how it found support with Fibonacci. I wanted to dothis trade with you as it developed so that you can see how I goabout. I just had a feeling that the price is not going to go down to1.2900 straight away so I applied fibonacci as there was no otherindicator between the entry price and 1.2900. One has to listen tothat little voice inside as well. I was stopped out on the other haveat 1.2935 so the total gain was 35 pips on 50% and 20 pips on theother 50% for a total of 27.5 pips on full lot.Not bad for an hour work.Greetings”This trade however was a bit risky as it was a breakout trade after ten daysconsolidation testing a trendline angling upwards. One has to evaluate the risk notonly in terms of pips but also in terms of strategy and chart pattern. After a breakoutthe price very often turns back to test the breakout level and then that level becomeseither support or resistance in this case it becomes Eur resistance.
Stoploss have to be inside the breakout otherwise it can be triggered and thensometimes it can be very big before entry signal is given by the MACD.Here is what I normally do when the MACD shows a signal but the stoploss are to bigin relation to my capital or what I am comfortable with. I enter the trade in threestages with my stoploss set at the same level.
I stopped counting the pips for the April 2006 testing as it completelyconvinced me of the success of this method. I randomly tested it using previous yearsand the results were amazing. Average of 300 pips per month and then I only tradethe trades that gives signals at these times 17:00, 21:00 and 01:00 (GMT 2). It givesbetween 8-10 deals per month using the mentioned timeframes. (I use Metatrader anddata supply by MIG.)If you use patterns in the MACD that occur regular that gives results and usethem every time they occur you will most definitely make money.I haven’t discuss nor used trendlines so far in this document and when you addthem it will most definitely helps you in defining your exit levels. The entry level aredetermine by the MACD but the exit or profit levels is determine by support andresistance levels. I use the moving averages as described earlier as well as Fibonaccilevels and then most definitely trendlines and price levels. I normally take the dailygraph and draw the trendlines according to it and then go to the 4 hour graph. I makethem nice and thick so that I can see them. Then I draw the different price levels suchas 1.2900, 1.3000, 1.3100 etc. It is amazing to see how the price find support and orresistance at these levels.I hope that this document will help you on your way to financial independents.
Welcome to the 4 Hour MACD Forex Strategy. This strategy is aimed at . my hands on. I bought books and courses. I attend a 5 day live web seminar. All this . at 1.2935 so the total gain was 35 pips on 50% and 20