Transcription
2016 Community HealthNeeds Assessment ReportMarianjoy Rehabilitation Hospital
Northwestern MedicineContentsIntroduction. . . . . . . . . . . . . . . . . . . . . . . . . . . . . . . . . . . . . . . . . . . . . . . . . . . . . . . . . . . . . . . . . . . . . 3Acknowledgments . . . . . . . . . . . . . . . . . . . . . . . . . . . . . . . . . . . . . . . . . . . . . . . . . . . . . . . . . . . . . 4The Community Health Needs Assessment. . . . . . . . . . . . . . . . . . . . . . . . . . . . . . . . . 5Development of Implementation Plan. . . . . . . . . . . . . . . . . . . . . . . . . . . . . . . . . . . . . . 30Actions taken to address the 2013 CHNA priority health needs. . . . . . . . 32Appendix A. . . . . . . . . . . . . . . . . . . . . . . . . . . . . . . . . . . . . . . . . . . . . . . . . . . . . . . . . . . . . . . . . . . . . 43Appendix B. . . . . . . . . . . . . . . . . . . . . . . . . . . . . . . . . . . . . . . . . . . . . . . . . . . . . . . . . . . . . . . . . . . . . 45Marianjoy Rehabilitation Hospital 2016 Community Health Needs Assessment Report2
Northwestern MedicineIntroductionMarianjoy Rehabilitation Hospital (Marianjoy), part of Northwestern Medicine, has a rich history of responding to and caringfor the rehabilitative needs of residents in the Chicagoland area. The 127-bed facility located in Wheaton, Illinois, providesadvanced rehabilitation and care to members of the immediate community. It also serves as a regional destination hospitalfor individuals in need of state-of-the-art rehabilitative care.Marianjoy has 100 acute inpatient rehabilitation beds and 27 Medicare-licensed, sub-acute beds for adult and pediatricpatients recovering from illness or injury who require intensive therapy to regain their function and independence. Themain hospital is a 170,000-square-foot facility with a number of unique inpatient and outpatient offerings includingspecialty programs focused on the treatment of stroke, spinal cord injury, brain injury, orthopaedic/musculoskeletalconditions, as well as conditions affecting pediatric patients.Marianjoy addresses a patient’s body, mind and spirit through personalized treatmentprograms including inpatient, comprehensive outpatient, sub-acute and physician clinicsthat specialize in rehabilitation medicine.Marianjoy offers inpatient and outpatient pediatric rehabilitation programs and is the only pain management programin Illinois accredited by the Commission on Accreditation of Rehabilitation Facilities (CARF). The hospital includes a fullsize Chartres labyrinth, therapeutic and enabling gardens, a meditation room, a two-story chapel and many other uniquefeatures designed to establish Marianjoy as a healing sanctuary.Additionally, the Marianjoy Assistive Rehabilitation Technology Institute (MARTI ) at Marianjoy Rehabilitation Hospitaloffers solutions to the everyday problems of daily living encountered by individuals with disabilities. MARTI consists ofseven distinct centers that apply advancements in technology to benefit individuals with disabilities through maximizingfunctional independence and expanding educational, vocational, recreational and communicative opportunities. Theinstitute offers a specially designed Fitness Center and a specialized Aquatic Therapy Center to support the needs ofindividuals striving to meet their therapy goals.To identify the highest-priority health needs of community residents, Marianjoy has completed a comprehensiveCommunity Health Needs Assessment (CHNA), which will be used to guide new and enhance existing efforts to improvethe health of our community. As described in detail in this report, the goal of the CHNA was to implement a structured,data-driven approach to determine the health status, behaviors and needs of all residents within the Marianjoy servicearea, with a special emphasis on those populations served by Marianjoy.Through this assessment, Marianjoy identified health needs that are prevalent among residents across all socioeconomicgroups, races and ethnicities, as well as issues that highlight health disparities or disproportionately impact the medicallyunderserved and uninsured.Marianjoy Rehabilitation Hospital 2016 Community Health Needs Assessment Report3
Northwestern MedicineAcknowledgmentsMarianjoy gratefully acknowledges the participation of a dedicated group of organizations that gave generously of theirtime and expertise to help conduct and develop this 2016 Community Health Needs Assessment:Ability LinksKensington InternationalAnixter CenterMetropolitan Chicago Healthcare CouncilDonka, Inc.Naperville School District 203DuPage County Health DepartmentOffice of the Secretary of StateDuPage Federation on Human Services ReformPeople’s Resource CenterDuPage Workforce BoardSPR ConsultingEdward Hines VA HospitalVillage of AddisonElmhurst CUSD 205Marianjoy Rehabilitation Hospital 2016 Community Health Needs Assessment Report4
Northwestern MedicineThe Community HealthNeeds AssessmentBackgroundA Community Health Needs Assessment (CHNA) represents a systematic, qualitative and quantitative approach todetermining the health status, behaviors and needs of residents within a hospital’s given service area. Data gathered ina CHNA is utilized to inform decisions and guide efforts to improve community health and wellness, thereby affecting thegreatest possible impact on community health status. The information utilized within this CHNA was conducted on behalfof Marianjoy as part of a larger project sponsored by the Metropolitan Chicago Healthcare Council (MCHC) and ProfessionalResearch Consultants, Inc. (PRC).An external steering committee was established to ensure that organizations impacting health in central DuPage Countyand representing the broad interests of the community were meaningfully engaged in reviewing and interpreting thefindings of the CHNA. The committee’s purpose was to develop priorities among the identified areas of opportunity andassist in the formation of a collaborative plan to address the highest-priority health needs.Members include representatives of:Ability LinksKensington InternationalAnixter CenterMetropolitan Chicago Healthcare CouncilDonka, Inc.Naperville School District 203DuPage County Health DepartmentOffice of the Secretary of StateDuPage Federation on Human Services ReformPeople’s Resource CenterDuPage Workforce BoardSPR ConsultingEdward Hines VA HospitalVillage of AddisonElmhurst CUSD 205A description of the communities served by these organizations is included in Appendix A.Marianjoy Rehabilitation Hospital 2016 Community Health Needs Assessment Report5
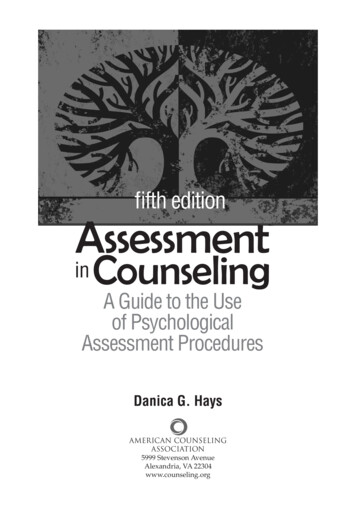
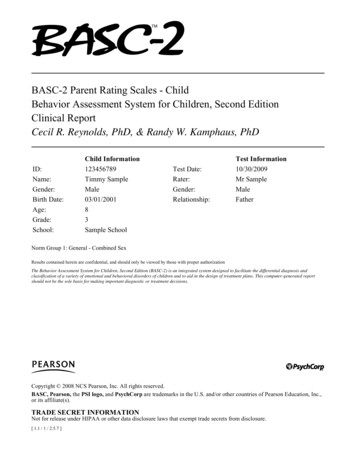
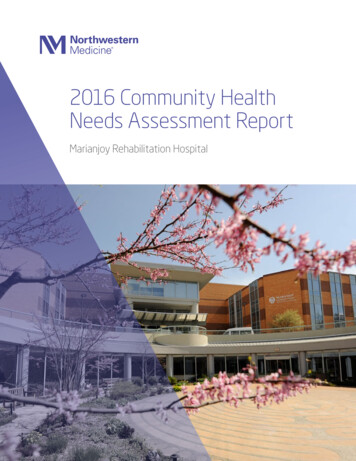
Northwestern rianjoy service area600316008560073Located in DuPage County, Marianjoy’s primary service area predominantlyincludes the ZIP codes identified below.60073However, because of the specialty nature of the hospital, Marianjoy also serves as a destination60064hospital receiving patientreferrals from surrounding counties including Cook, Will, Kane, Kendall, DeKalb and LaSalle.6008860048Marianjoy Service Area by ZIP 01036013360184601726014360191 6010660108601886013960101601266018560190 Marianjoy Rehabilitation Hospital 2016 Community Health Needs Assessment Report6
Northwestern MedicineGoals and objectivesA CHNA provides information so that hospitals may identify health issues of greatest concern among all residents anddecide how best to commit resources to those areas, thereby making the greatest possible impact on community healthstatus.The Marianjoy CHNA conducted in 2016 was performed with a systematic, data-driven approachto determine the health status, behaviors and needs of residents in the Marianjoy service area. ThisCHNA will serve as a tool toward reaching three related goals:1Improve residents’ health status, increase their life spans and elevate their overallquality of life. A healthy community is one where its residents suffer little from physicaland mental illness and also enjoy a high quality of life.2Reduce the health disparities among residents. By gathering demographic informationalong with health status and behavior data, it will be possible to identify population segmentsthat are most at-risk for various diseases and injuries. Intervention plans aimed at targetingthese segments may then be developed to combat some of the socioeconomic factors thathave historically had a negative impact on residents’ health.3Increase accessibility to preventive services for all community residents. More accessiblepreventive services will prove beneficial in accomplishing the first goal (improving healthstatus, increasing life spans and elevating the quality of life), as well as lowering the costsassociated with treating late-stage diseases that result from a lack of preventive care.MethodologyThis assessment incorporates data from both quantitative and qualitative sources.Quantitative data input includes primary research (Community Health Survey conducted by People’s Resource Center[PRC] and Metropolitan Chicago Healthcare Council [MCHC]) and secondary research (vital statistics and other existinghealth-related data). These quantitative components allow for trending and comparison to benchmark data at the stateand national levels.Qualitative data input includes primary research gathered through an online key informant survey of various communitystakeholders. All data is then compared to local, state and national trends in addition to alignment with Healthy People2020 Objectives for a Healthy Nation.Marianjoy Rehabilitation Hospital 2016 Community Health Needs Assessment Report7
Northwestern MedicineCommunity health surveySurvey instrumentThe survey instrument used for the PRC-MCHC Community Health Survey was based largely on the Centers for DiseaseControl and Prevention (CDC) Behavioral Risk Factor Surveillance System, as well as various other public health surveys.Customized questions addressed gaps in indicator data relative to health promotion and disease prevention objectivesand other recognized health issues. The final survey instrument was developed by the PRC and MCHC.Community defined for this assessmentThe study area for the survey effort was based on patient origination as defined by the Marianjoy service area, analyzedat the ZIP code level.Sample approach and designA precise and carefully executed methodology is critical in asserting the validity of the results gathered in the PRC-MCHCCommunity Health Survey. Thus, to ensure the best representation of the population surveyed, a telephone interviewmethodology — one that incorporates both landline and cell phone interviews — was employed. The primary advantages oftelephone interviewing are timeliness, efficiency and random-selection capabilities.The design used for this effort consisted of a sample of 536 individuals age 18 and older in DuPage County. Becausethis study is part of a larger effort involving multiple regions and hospital service areas, the surveys were distributedamong various strata. Once the interviews were completed, they were weighted in proportion to the actual populationdistribution to appropriately represent DuPage County. Administration of the surveys, data collection and data analysiswere conducted by PRC. For statistical purposes, the maximum rate of error associated with a sample size of 536respondents is /- 4.2 percent at the 95 percent level of confidence.Sample characteristicsTo accurately represent the population studied and minimize bias, proven telephone methodology and random-selectiontechniques were applied. While this random sampling of the population produces a highly representative sample, it isa common and preferred practice to “weight” the raw data to further the representation. This was accomplished byadjusting the results of a random sample to match the geographic distribution and demographic characteristics of thepopulation surveyed (post stratification) to eliminate any naturally occurring bias.Specifically, once the raw data were gathered, respondents were examined by key demographic characteristics (namelygender, age, race, ethnicity and poverty status) and a statistical application package applied, weighting variables thatproduced a sample that more closely matched the population for these characteristics. While the integrity of eachindividual’s responses was maintained, one person’s responses may have contributed to the whole the same weightas, for example, 1.1 respondents. Another respondent, whose demographic characteristics may have been slightlyoversampled, may have contributed the same weight as 0.9 respondents.The poverty descriptions used in this report are based on administrative poverty thresholds determined by the U.S.Department of Health and Human Services. These guidelines define poverty status by household income level andnumber of persons in the household. (For example, the 2016 guidelines place the poverty threshold for a family of fourat 24,300 annual household income or lower).The sample design and the quality control procedures used in the data collection ensure that the sample is representative.Thus, the findings may be generalized to the total population of community members in the defined area with a highdegree of confidence.Marianjoy Rehabilitation Hospital 2016 Community Health Needs Assessment Report8
Northwestern MedicinePublic health, vital statistics and other dataA variety of existing (secondary) data sources was consulted to complement the research quality of the CHNA. Secondarydata for the Marianjoy service area was obtained from the following sources with specific citations included throughoutthe PRC report:Centers for Disease Control and PreventionU.S. Census Bureau, American Community SurveyCommunity CommonsU.S. Census Bureau, Decennial CensusESRI ArcGIS Map GalleryU.S. Department of Health and Human ServicesOpenStreetMap (OSM)U.S. Department of Labor, Bureau of Labor StatisticsCommunity stakeholder inputOnline key informant surveyTo solicit input from key informants — individuals who have a broad interest in the health of the community — an online keyinformant survey was implemented. A list of recommended participants was provided by local hospitals and MCHC, whichincluded names and contact information of physicians, public health representatives, other health professionals, socialservice providers and a variety of other community leaders. Potential participants were chosen because of their ability toidentify primary concerns of the populations with whom they work as well as the overall community.Key informants were contacted by email, introducing the purpose of the survey and providing a link to take the surveyonline. Reminders were sent as needed to increase participation. In all, 10 community stakeholders took part in the onlinekey informant survey — including representatives of the following organizations:DuPage County Health DepartmentNaperville School District 203DuPage Federation on Human Services ReformPeople’s Resource CenterElmhurst CUSD 205Village of AddisonMetropolitan Chicago Healthcare CouncilThrough this process, input was gathered from several individuals whose organizations work with low-income, minorityand other medically underserved populations. Key informants were asked to rate the degree to which various healthissues are a problem in their own community. Follow-up questions asked for a description of how these issues may bebetter addressed.Marianjoy Rehabilitation Hospital 2016 Community Health Needs Assessment Report9
Northwestern MedicineSupplemental disability surveysTo specifically assess the needs of individuals with disabilities in the Marianjoy service area, input was also solicited fromthe following groups through an online survey:People who received healthcare services from the Marianjoy network within the past two years and provided avalid email addressPeople who registered with AbilityLinks, a national, web-based community where qualified job seekers withdisabilities gain access to valuable employment opportunitiesOrganizations affiliated with Marianjoy that are providing services and resources to people with disabilities whoseek assistance following return to the communityData from these surveys has been integrated into this report.Information gapsWhile this CHNA is quite comprehensive, it cannot measure all possible aspects of health in the community, nor can itadequately represent all possible populations of interest. These information gaps might in some ways limit the ability toassess all of the community’s health needs.For example, certain population groups — such as homeless or institutionalized persons, and those who only speak alanguage other than English or Spanish — are not represented in the survey data. Other population groups — for example,pregnant women, lesbian/gay/bisexual/transgender residents, undocumented residents, and members of certainracial/ethnic or immigrant groups — might not be identifiable or might not be represented in numbers sufficient forindependent analysis.In terms of content, this assessment was designed to provide a comprehensive and broad picture of the health of theoverall community. However, certainly a great number of medical conditions are not specifically addressed.Public disseminationThis CHNA is available to the public and may be viewed at marianjoy.org. A hard copy is available at the Marianjoy facilityand may be viewed upon request.Findings and opportunitiesCommunity descriptionDuPage County encompasses 327.41 square miles and is home to a total population of 922,803 residents, according tolatest census estimates. Between the 2000 and 2010 U.S. Censuses, the population of DuPage County increased by13,014 persons, or 1.4 percent. The county’s population density is reported at 2,818.47 residents per square mile. DuPageCounty is predominantly urban, with nearly all of the population living in areas designated as urban.Marianjoy Rehabilitation Hospital 2016 Community Health Needs Assessment Report10
Northwestern MedicineDemographicsIt is important to understand the age distribution of the population, as different age groups have unique health needsthat must be considered in planning to meet the needs of county residents. In DuPage County, 24.4 percent of residentsare infants, children or adolescents (age 0 to 17). Another 63.5 percent are age 18 to 64, while only 12.1 percent are 65and older. The median age in DuPage County is 38.4 years, compared to 36.8 statewide and 37.3 nationally.Race and ethnicityIn looking at race independent of ethnicity, 80.3 percent of residents in DuPage County are White and 4.6 percent areBlack. When considering ethnicity, 13.5 percent of DuPage County residents are Hispanic or Latino. The county has a higherproportion of White residents and a lower proportion of Black residents than the region, state and U.S. The percentage ofHispanic and Latino residents is also lower than that found in the region, state and U.S. However, the Hispanic populationin DuPage County increased by 40,167 between 2000 and 2010. Additionally, a total of 5 percent of DuPage Countyresidents age 5 and over live in a home in which no person age 14 or older is proficient in English.Social determinants of healthHealth starts in our homes, schools, workplaces, neighborhoods and communities. We know that taking care of ourselves(including eating well, staying active, not smoking and visiting a doctor regularly) influences our health.Our health is also determined in part by access to social and economic opportunities, community resources, qualityeducation, workplace safety, environmental factors and our personal relationships. The conditions in which we liveexplain, in part, why some Americans are healthier than others.PovertyThe U.S. Census Bureau American Community Survey 5-Year Estimates (2009 to 2013) show 6.9 percent of theDuPage County population living below the Federal Poverty Level (100 percent).A total estimated 18.6 percent of residents (168,845 individuals) live below 200 percent of the Federal PovertyLevel. A total estimated 23.5 percent of DuPage County children age 0 to 17 (52,639 children) live below 200percent of the Federal Poverty Level. Both of these statistics trend more favorably than the Chicago Metro Area(metro area), state and U.S. rates.Education and employmentAmong DuPage County residents age 25 and older, an estimated 7.9 percent (more than 48,000 people) do nothave a high school education, which is more favorable than metro, state and national findings.According to data derived from the U.S. Department of Labor, the unemployment rate in DuPage County was4.8 percent in May 2015, trending more favorably than metro, state and national unemployment rates.Marianjoy Rehabilitation Hospital 2016 Community Health Needs Assessment Report11
Northwestern MedicineGeneral health status A total of 61.8 percent of Marianjoy survey respondents rated their overall health as “excellent” or “very good.” Another 10 percent described their overall health status as “fair” or “poor.” The remaining 28.2 percent rated their health as “good.” When queried regarding activity limitations, 20.6 percent of respondents reported limitations due to a physical,mental or emotional problem.Activity limitationsAn individual can develop a disabling impairment or chronic condition at any point in life. According to Healthy People2020 (HP2020), people with disabilities are more likely to:Experience difficulties or delays in accessinghealth careNot have had an annual dental examNot have had a mammogram in the past two yearsNot have had a Pap test within the past three yearsNot engage in fitness activitiesUse tobaccoBe overweight or obeseHave high blood pressureExperience symptoms of psychological distressReceive less social-emotional supportHave lower employment ratesFurther, many social and physical factors influence the health of people with disabilities. The following three areas forpublic health action have been identified, using the International Classification of Functioning, Disability, and Health (ICF)and the three World Health Organization (WHO) principles of action for addressing health determinants.Improve the conditions of daily life by encouraging communities to be accessible so all can live in, movethrough and interact with their environment; encouraging community living; and removing barriers in theenvironment using both physical universal design concepts and operational policy shifts.Address the inequitable distribution of resources among people with disabilities and those withoutdisabilities by increasing appropriate health care for people with disabilities; education and work opportunities;social participation; and access to needed technologies and assistive supports.Expand the knowledge base and raise awareness about determinants of health for people with disabilitiesby increasing the inclusion of people with disabilities in public health data collection efforts across the lifespan;increasing the inclusion of people with disabilities in health promotion activities; and expanding disability andhealth training opportunities for public health and healthcare professionals.Marianjoy Rehabilitation Hospital 2016 Community Health Needs Assessment Report12
Northwestern MedicineA total of 20.3 percent of survey respondents identified a limitation in activities in some way due to a physical, mentalor emotional problem. This trend was lower than metro area and U.S. rates, but higher than state rates. Limitations werehigher in men (21.7 percent) than women (18.8 percent) and highest among 40- to 64-year-olds (23.7 percent).Mental health status A total of 71.3 percent of respondents reported their mental health as “excellent” or “very good,” with another 18.6percent reporting “good” and 10.1 percent reporting “fair” or “poor.” Sixteen percent of adults reported being diagnosed with a depressive disorder — higher than metro area trends, butlower than national rates — and 25.2 percent of these same respondents reported symptoms of chronic depressionlasting two or more years (lower than both metro area and U.S. rates). Sixty percent of adult respondents reported “moderate to extreme” daily stress. Inadequate sleep was reported by 64.9 percent of respondents. Between 2011 and 2013, the annual average age-adjusted suicide rate was 8.8 deaths per 100,000 residents inDuPage County — higher than regional rates, but lower than state and national rates.Morbidity and mortalityCardiovascular diseaseWhen combined, cardiovascular disease (heart disease and stroke) and cancers accounted for more than half ofall deaths in DuPage County in 2014.Nearly all residents (98.8 percent) reported having had their blood pressure tested within the past two years,exceeding the HP2020 target of 92.6 percent.A total of 32.7 percent of adults reported being told at some point that their blood pressure was high, exceedingthe HP2020 target of 26.9 percent.Ninety-six percent of respondents reported having had a blood cholesterol screening within the past five years;34.3 percent reported elevated cholesterol levels.Regarding risk of cardiovascular disease, 77.9 percent of respondents reported one or more risk factors includingoverweight, smoking cigarettes, physical inactivity, high blood pressure or high cholesterol levels.Fifty percent of survey respondents rated heart disease and stroke as a major problem in the community.Marianjoy Rehabilitation Hospital 2016 Community Health Needs Assessment Report13
Northwestern MedicinePulmonary diseaseAsthma and chronic obstructive pulmonary disease (COPD) were also significant public health burdens.Between 2011 and 2013, the annual average age-adjusted COPD mortality rate was 29.8 deaths per 100,000residents in DuPage County.Additionally, the pneumonia/influenza age-adjusted mortality rate was 16.4, exceeding the national rate.Currently, 7.1 percent of adult survey respondents suffer from asthma.Additionally, 8.1 percent of children within the Marianjoy service area were reported to have asthma.Fifty percent of key informants rated respiratory disease as a major problem in DuPage County.Injury and violenceInjuries and violence are widespread in society. Unintentional injuries and those caused by acts of violence are among thetop 15 killers for Americans of all ages.1 Poisoning (including accidental drug overdose), falls, motor vehicle accidents andsuffocation accounted for the majority of accidental deaths in the Marianjoy service area in 2013.Data shows that 17.2 percent of accidental deaths in DuPage County in 2013 were due to motor vehicleaccidents.2Between 2011 and 2013, the average annual age-adjusted motor vehicle crash mortality rate was 4.0 per100,000 residents in DuPage County — notably below state and national rates and significantly below theHP2020 target of 12.4 or lower.Among survey respondents, 93.8 percent reported “always” wearing a seat belt when driving or riding in avehicle and 99.2 percent of parents reported their child “always” wearing a seat belt.More than 25 percent of Marianjoy service area children were reported to “always” wear a helmet when riding abicycle.Half of key informants rated unintentional injury as a minor problem in DuPage County.From July 15, 2015, through June 16, 2016, Marianjoy reports total inpatient admissions of 355 patients withbrain injuries and 110 patients with spinal cord injuries.12Healthy People 2020Centers for Disease Control and PreventionMarianjoy Rehabilitation Hospital 2016 Community Health Needs Assessment Report14
Northwestern MedicinePotentially disabling conditionsArthritisThere are more than 100 types of arthritis, and it commonly occurs in combination with other chronic conditionssuch as diabetes, heart disease and obesity. Interventions to treat pain and reduce functional limitations enablepeople with these chronic conditions to be more physically active.Arthritis affects one in five adults and continues to be the most common cause of disability, costing in excess of 128 billion annually.3 Interventions include increased physical activity, self-management and weight loss inoverweight/obese adults.A total of 34.8 percent of survey respondents age 50 and over indicated having been diagnosed with arthritis,as compared to 36.3 percent in the metro area and 37.3 percent nationwide.County data demonstrate an increase in arthritis prevalence from 26.5 percent to 34.8 percent from 2009to 2015.OsteoporosisOsteoporosis is a disease marked by reduced bone strength leading to an increased risk of fractures. Accordingto HP2020, an estimated 5.3 million people age 50 and over in the U.S. have osteoporosis.A total of 13.2 percent of survey respondents age 50 and over indicated having been diagnosed withosteoporosis, as compared to 10.0 percent in the metro area and 13.5 percent nationwide.County data demonstrates an increase in osteoporosis prevalence from 8.6 percent to 13.2 percent from 2009to 2015.Chronic back painEighty percent of Americans experience low back pain in their lifetime.4 It is estimated that 15 to 20 percentdevelop protracted back pain, 2 to 8 percent have chronic back pain, 3 to 4 percent are temporarily disableddue to back pain, and 1 percent of the working-age pop
DuPage Federation on Human Services Reform DuPage Workforce Board Edward Hines VA Hospital Elmhurst CUSD 205 Kensington International Metropolitan Chicago Healthcare Council Na