Transcription
TOWARDS MOREAGILE AND EFFICIENTPRODUCT TESTINGOpportunities and limitations for small sample sizesAuthor: Nikolai Reynolds, Josef Zach, Jinho ChoContributor: Colin HoMay 2021ABSTRACTThe historic assumption that larger sample sizes are neededwhen testing prototypes in the early stage of the productfor product tests derives from the hypothesis that there isdevelopment and (for cost rationalization studies) in the latera risk of unreliable and varying consumer responses, i.e.,stage of product development. Our findings suggest smallvariance. Today, large consumer panels and databasing ofsample sizes can be considered when the objective is toconsumer responses allow us to revisit historic variancecreate differentiating products such as for pre-screeningassumptions for product development. In this paper weof prototypes. Such pre-screening allows us to save costinvestigate the variance of products tested across regionsand time by reducing the number of products required forand categories using different scales from 36,500 consumersfurther testing. However, for other types of testing such asin our database. We assess how reliable a smaller samplecost rationalization studies, or when subgroups need to besize of n 50 is versus larger samples of n 150 or moreanalyzed, larger sample sizes are recommended.IPSOS TOWARDS MORE AGILE AND EFFICIENT PRODUCT TESTING1
SAMPLE SIZE CONSIDERATIONSProduct testing measures properties or performance ofTherefore, a good planning of the right sample sizeproducts. It covers any process in which a researcherconsidering the data collection is crucial for the quality ofmeasures a product’s compliance, performance, safety, andany intended research (Maxwell et al, 2008).quality. To assess the product properties or performance,product testing survey data can be collected in many waysThe sample size also has implications for the investmentfrom face-to-face, telephone, video-based interviewing overneeded to run the research. Prototypes or in-marketto online and mixed mode designs.products need to be provided, shipped, or placed and theempty packaging shipped back or destroyed. Large sampleThe type of data collection needs to be chosen in such asizes drive these logistical investments and, in many cases,way that a sufficient sample size can be collected from thealso the research timing. To reduce the need for largerrelevant target population (Wilkinson and McTiernan, 2020).sample sizes and thus more test products, it is importantThe relevant target group sizes in the total population arethat the sample structure and quality are paid attention to inoften, depending on the category and market, in millions.the planning (Ramsey and Wagner, 2015).LARGE SAMPLE SIZES ARE NOT NEEDED IN EVERY AREADepending on the scope and subject of research, the levelof statistical means (Gosset and Fisher, 1925). His sampleof variance between a sample and the total population cansizes were below 50.be different. For instance, if we were to assess how anindigenous population raise their children, variance could beAs products may differ even when factory settings have beenhigh. But if we were to examine how the indigenous languagemaintained, it is important to select products from differentin its grammar is constructed, the variance would be lower,production batches. But typically, in product research, thereand a small sample size could be considered.is more variance coming from consumer perceptions thanfrom the variance within the same products from a factory,In the medical industry smaller sample sizes are commonlyi.e. batch variability.selected, such as n 15. If the measurements in thesetests do not vary much between people, it is possibleThe sources of such variance can be manifold: if theto handle n 15 with statistical procedures (significancesampling frame is incorrectly defined, question items uncleartest, estimating types of error). Similarly, in the productor questionnaires too long, response behavior can deviatedevelopment cycle, products need to run through clinicalstrongly. Such variance can lead to the situation where ittrials too before being tested by consumers. In these clinicalcan be observed that two identical products are statisticallystudies smaller sample sizes are also often chosen. But evensignificantly different in performance.after clinical approval, we find product tests with smallersample sizes with sensory expert panels ranging fromAt Ipsos, we put an extra effort into applying strict surveyn 10-50 (Lawless and Heymann, 2010) as well as within theresearch rules to avoid such situations by reducing thefactory where batch variability is assessed.margins of error (qualification of respondents, short enoughquestionnaire, avoiding response directed questions, clearTesting the batch variability is basically one of the startingdescription of question items, unbiased interview dynamicspoints in history for significance testing in product testing.etc.). As we put all these quality measures in place in ourWilliam Sealy Gosset, who was a master brewer at Guinness,sampling, the hypothesis is derived that data quality shouldassessed differences between batches of beer, i.e. batchprovide the same robustness, independent of its sample size.variability, by comparing arithmetic means with each other,later using his pen name “student” t-distribution and testIPSOS TOWARDS MORE AGILE AND EFFICIENT PRODUCT TESTING2
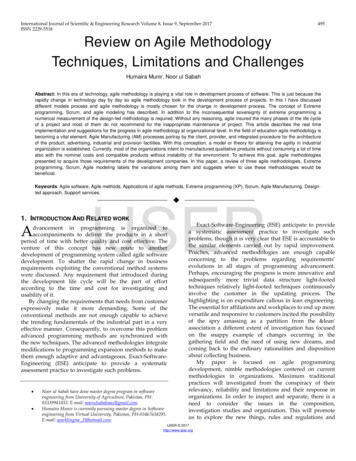
Figure 1 Ipsos Product Development Life CycleExplorationIdentify the next generationproduct features and benefitsCost Savings/QIGuidanceEnsure profitablelongevity in-marketPrototype Screeningand OptimisationRenovationBenchmarkingMonitor product’sin-market performanceInnovationValidationRefine products forin-market successSource: Ipsos 2021WITH GOOD DATA QUALITY, DO SAMPLES WITH N 50 PROVIDENEARLY IDENTICAL RESULTS AS SAMPLES WITH N 150 ?As the world’s largest product tester, Ipsos has theFor each study we considered first the full sampleadvantage to build upon massive data sets from consumer-(depending on the study: n 150-450) and estimated the gapbased product testing. To answer the key question ofbetween the best and worst performing products in overallwhether we would come to the same conclusion with aliking, i.e., “best-worst gap”. Using a Monte Carlo Simulationsmaller sample size than with a larger, we randomly selectedwith 10,000 iterations, we estimated the best-worst gaps ofa subset of studies from the Ipsos Product Database.smaller sample size of n 50 per study. To allow a relativeTo answer the second question, at what stage of productcomparison between different Overall Liking scales, wedevelopment smaller sample sizes can be considered, wedivided the best-worst gap by the number of scale points.selected studies related to guidance testing related prototypeWe then calculated a Pearson correlation coefficient betweenscreening and cost saving measures (see Figure 1).average consumer acceptance scores of all tested productsof a small sample size (n 50) and the average consumerIn total, the analyses encompassed 36,779 consumeracceptance scores from the original sample size of eachresponses to how much they liked the product testedstudy. We ran the analyses separately for early-stagerated either a 9-point, 7-point or 5-point Overall Likingprototype tests and for cost rationalization studies.scale across Africa, Asia, Europe, Latin America, NorthAmerica for 185 consumer goods products. To considercategory effects, we covered beverages, food, non-humanfood, personal and home care studies. These studies wereconducted between 2015 to 2021.IPSOS TOWARDS MORE AGILE AND EFFICIENT PRODUCT TESTING3
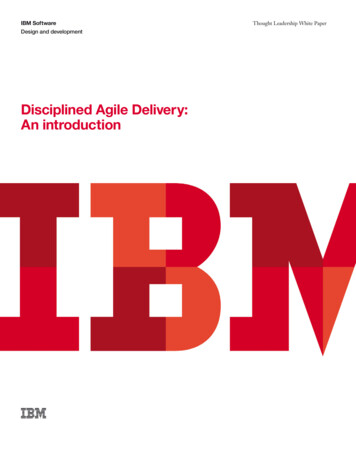
SMALL SAMPLE SIZES FOR EARLY-STAGE PROTOTYPE SCREENINGFigure 2 depicts the relationship between the correlationsdifferences between the prototypes were 20% or larger,and the relative best-worst gaps of each study. From thesemeasured by consumer acceptance, were stable with arelationships we can derive a very strong correlation of 0.9small sample size of n 50. This means that for early-stageif the relative best-worst gap is 20% of the scale range orproduct tests, we should consider prototypes which aremore. Regarding category or regional effects, no specificdifferentiating. Sensory panels can make sure differentiatedpatterns can be identified. Studies in which the performanceproducts are selected for consumer-based screening.Figure 2 Similarities of results using smaller sample sizes in prototype screening studiesSouth America,Food/Beverage1.000.95North America,Pet Food0.90Asia, Food/BeverageNorth America,Food/BeverageEurope, Pet FoodSouth America,Food/BeverageAfrica,Personal Care0.85Africa,Food/BeverageEurope,Pet FoodAsiaPersonal CareEurope,Food/Beverage0.800.75Asia, Food/Beverage0.700.650.600%10%20%30%40%50%60%Note: Y-axis: Pearson Correlation of n 50 vs n 150-n 300, X-axis: relative difference of best and worst performing products withineach study, i.e., “best-worst gap”. To statistically assess whether the gap of the mean scores explain the similarities between smaller andlarger samples, we applied a logit transformed regression model. The logit transformed regression model presented as Figure 2 reveals thatdifferences and correlations are not constant, i.e., are heteroscedastic. To counter heteroscedastic effects, a common method in statisticsis to conduct a logit transformation (Greene, 2002). The logit transformed regression model is statistically significant. The best-worst gapexplains the similarities between the larger and smaller sample sizes with 99% confidence.Source: Analysis of selective studies in early-stage product tests from Ipsos Product Testing Database.SMALL SAMPLE SIZES FOR LATE-STAGE COST SAVING STUDIESCost saving studies have an opposite objective to early-stagesuch studies it is often about ensuring product performanceprototype development. While in prototype development it isis maintained when removing/modifying ingredients to makemore about maximizing differentiation to achieve superiority,a more profitable, for example because there are regulatoryin a cost rationalization study it is about minimizingchanges, or changes in availability of specific ingredients.differentiation, i.e., creating nearly identical products. InIPSOS TOWARDS MORE AGILE AND EFFICIENT PRODUCT TESTING4
Figure 3 Similarities of results using smaller sample sizes in cost saving studies1.000.90Africa, Food/BeverageAsia, Personal CareAsia, Personal CareAsia, Personal CareAsia, Personal CareAfrica, Food/BeverageEurope, HomecareAsia, Personal CareLATAM, Personal CareAfrica, Food/BeverageAsia, Personal Care Asia, Personal CareLATAM, Personal CareAsia, Food/BeverageAsia, Personal CareEurope, Food/BeverageEurope, Personal CareAsia, Personal CareEurope, Food/BeverageLATAM, Personal CareAfrica, Food/BeverageAsia, Personal Care0.80Asia, Personal CareEurope, Food/BeverageEurope, Food/BeverageEurope, Food/BeverageEurope, Food/BeverageEurope, Food/Beverage0.60Asia, Personal CareAsia, Personal Care0.50Europe, Food/Beverage0.400%2%4%6%8%10%12%14%16%18%20%Note: Y-Axis: Probability that the same will win when considering a sample size of n 50 instead of n 150-300. X-axis: relative difference ofbest and worst performing products within each study, i.e., “best-worst gap”. The logit transformed regression model is statistically significantshowing the best-worst gap can explain sufficiently the similarities between larger and smaller sample sizes at 99% confidence.Source: Analysis of selective studies in early-stage product tests from Ipsos Product Testing Database.The objective is to avoid alienating consumers without asmall correlations with best-worst gaps smaller than 2%,negative impact in consumer acceptance. Therefore, the goalsmall sample sizes of n 50 pose other challenges in costis to create similar products.rationalization studies. First, a multivariate franchise riskanalysis requires a subgroup analyses to estimate alienationNaturally, the best-worst gap is significantly smaller inreducing the sample size even more. Second, the lowercomparison to an early-stage prototype test (Figure 3). Allthe best-worst gap, the more sensitive the statisticalrandomly selected products had a best-worst gap differencetesting needs to be. Having small sample sizes reduces thelower than 14%. Again, regarding category or regionalstatistical power. For cost rationalization studies we wouldeffects, no specific patterns can be identified. Our productnot recommend smaller sample sizes to avoid any franchisetesting experience shows that achievable differences in costrisk. Especially when examining a subset of consumers, suchrationalization studies should be less than 2%.as heavy users of a product that should not be alienated.However, the correlation declines significantly when weachieve smaller best-worst gaps of 2%. Besides theIPSOS TOWARDS MORE AGILE AND EFFICIENT PRODUCT TESTING5
Figure 4 Types of errorTotal PopulationH0H1Type II (beta)-errorThe product is not introduced into themarket although it is better! The chancefor increased sales is missed.SampleH0Type I (alpha)-errorH1The product is introduced into the marketalthough it is not better! Investments havebeen made which create a loss and thebrand equity is reduced through a poorperforming product.Source: Own depiction after Nickerson 2000DO WE NEED STATISTICAL TESTING AT ALL?Whether statistical testing is needed or not hasbeen widely discussed in the past and present inacademic research (Edwards et al, 1963, Maxwell etal, 2008). In product testing it is crucial for setting“Action Standards”. Depending on the researchobjective, the “Action Standards” are chosen in suchway that a product is either at parity with anotherproduct (no difference, i.e. Null Hypothesis), orsuperior (Alternate Hypothesis).For instance, the “Action Standard” is set to parityfor cost reduction projects, whereas for qualityimprovement projects it is set to superiority. Theconfidence interval is carefully selected dependingon the sample size. For testing purposes, a highersample size is chosen to boost the “Power”(Sedlmeier and Gigerenzer, 1989).The “Power” in a statistical test is the probabilitythat the test will reject a false null hypothesis,i.e. not making a Type II error (Cohen, 1962). As“Power” increases, the chance of a Type II errordecreases and Type I increases as Type I and TypeII errors are interconnected. The “Power” is equalto 1 – Type II error. So, if the odds for making aType II error would be 20%, the power would be1-20% 80%. However, the reduction of net samplesize has a little impact on the quality of the results.The statistical accuracy only decreases in the senseof Type II error. Type I error needs to be accountedfor, too. Depending on the business objective of aproduct test, Type I or Type II error may be moreimportant (Figure 4).Therefore, in product development, statisticaltesting needs to be carefully considered dependingon the business objective. In addition, it shouldnever overrule business related questions on whata truly meaningful difference is. Even if one productunderperforms in Sweetness, this does not have tomean that the product will underperform in-market.IPSOS TOWARDS MORE AGILE AND EFFICIENT PRODUCT TESTING6
MARGIN OF ERROR AND SAMPLE SIZESThe identification of the required sample size buildsupon calculating an acceptable margin of error. Theidea behind margins of error is that any survey willdiffer from the true population by a certain amount.A margin of error informs how many percentagepoints a sample will differ from the total consumerpopulation value. For instance, a 90% confidenceinterval with a 3 percent margin of error means thatthe sample will be within 3 percentage points of thereal population value 90% of the time. In textbooks,a maximum variance is considered (Figure 5 andKrejcie and Morgan, 1970) when a proportion(p) is unknown. A proportion (P) is for instance aspecific target group for a product among the totalpopulation. The variance is put into an equation tocalculate a margin of error. In product testing oftena margin error of 10% or below is acceptable. Asample size of n 96 would yield 10% margin oferror at 95% confidence if the maximum varianceis chosen.Figure 5 Variance in Proportion (P) and Margin of ErrorP(1-P) Var of rgin of Error11.3%10.3%8.0%The highest Variance ischosen for calcuatingthe Margin of ErrorSample SizeVarianceConfidence 0.250.250.2595%95%95%95%95%95%Source: Own depictionBut is considering the maximum variance the rightway to go in today’s world for all product tests?Online panels and databases provide today the abilityto predict proportions more precisely. In addition, themain source for variance is the different sensorialexperiences consumers have from the product theytested. There is typically more variance coming fromconsumer perceptions than from the variance withinthe same products from a factory. Batch variabilitycan be counted for by making sure products arefrom different batches or the error or noise withinthe consumer survey result is larger than merestatistical sampling error. When the same productis tested twice in different samples, it is not rare toobserve that two identical products are statisticallysignificantly different. At Ipsos, we put an extraeffort applying strict survey research rules to reducethe margin of error (qualification of respondents,short enough questionnaire, avoiding responsedirected question, clear description of questionitem, unbiased interview dynamics etc.). If all qualitymeasures are put in place in sampling, data qualityshould provide the same robustness independent ofits sample size.IPSOS TOWARDS MORE AGILE AND EFFICIENT PRODUCT TESTING7
IN CONCLUSIONOur research has shown that small sample sizescan be considered but we caution that it will notmake sense for every product test. It also revealedthat smaller sample sizes can be considered forscreening of products that are expected to bedifferent, such as in prototype development orwhen new products are created with the objectiveto be unique. In such screenings, one would cometo the same conclusion based on Overall Likingwith n 50 instead of having to produce manymore prototypes or purchase different products forlarger sample sizes thus saving significant costsand speeding up time. Sensory panels can help toselect differentiating prototypes to be screened byconsumers. Larger sample sizes should be chosenif sub-group analyses are needed or where thereis a critical franchise risk, e.g., in cost savingstudies. For cost reductions, the most severe riskis the launch of an inferior product. Furthermore,the results hold across categories and regions. Nomatter what type of testing or sample size, it iscrucial to consider a sample structure and qualitythat represent the target group sufficiently.LITERATURE REFERENCESCohen, J. (1962): The statistical power of abnormal—social psychological research: A review. Journal of Abnormal andSocial Psychology, 65, 145-153.Edwards, W., Lindman, H. and Savage, L. J. (1963): Bayesian Statistical Inference for Psychological Research.Psychological Review, Vol. 70, No. 3, 193-242Green, W. (2002): Econometric Analyses, Fifth Edition, Prentice Hall, New JerseyGosset, W. S. and Fischer (1925): Statistical Methods for Research Workers, Oliver and Boyd, Edinburgh.Lawless, H. T. and Heymann, H. (2010): Sensory Evaluation of Food, Principle and Practices”, pp201-202, Springer 2010Maxwell, S. E., Kelly, K. and Rausch, J. R. (2008): Sample Size Planning for Statistical Power and Accuracy in ParameterEstimation. Annual Review of Psychology, 2008, 59, 537–63Nickerson, R. S. (2000): Null Hypothesis Significance Testing: A Review of an Old and Continuing Controversy.Psychological Methods, Vol. 5, No. 2, 241-301Ramsey, C. A. and Claas, W. (2015): Sample Quality Criteria. Journal of AOAC International, Vol. 98, No. 2, 265-268Sedlmeier, P. and Gigerenzer, G. (1989): Do Studies of Statistical Power Have an Effect on the Power of Studies? In:Psychological Bulletin, 1989 Vol. 105 No. 2, 309-316Wilkinson, S. and McTiernan, L. (2020): Mixed Mode Research. Reaching the right people in the right way to get the datayou need. Ipsos Point of View Paper, Paris.IPSOS TOWARDS MORE AGILE AND EFFICIENT PRODUCT TESTING8
IPSOS TOWARDS MORE AGILE AND EFFICIENT PRODUCT TESTING 1. SAMPLE SIZE CONSIDERATIONS Product testing measures properties or performance of products. It covers any process in which a researcher measures a product’s compliance, performance, safety, and