Transcription
The Bull MarketThe Barron’s 400Francis Gupta, Ph.D., MarketGrader Research. September 2018
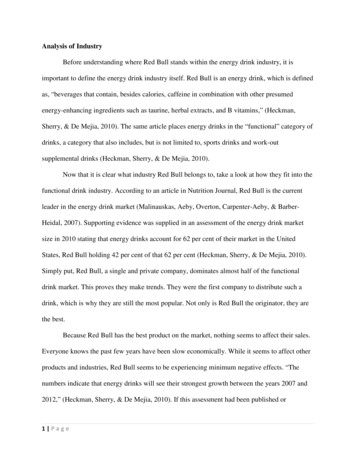
The Barron’s 400 — Bull Market Performance in the CrosshairsStock market watchers fall into two camps when discussing the start of the current bull market: thosewho believe it started in March 2009 and consequently is the longest running bull market in history, andthose who argue that it began in February 2016 and so is only 2½ years young1. At MarketGrader wefall into the former camp. But irrespective of when this bull market started, it goes without saying that ithas been a remarkable stock rally. Consequently, we thought this might be a good time to review theperformance of the Barron’s 400 (B400) Index during the current bull market and to evaluate how well ithas satisfied its stated objective as a measure of capital appreciation of the US equity market.Under the assumption that the current bull market is the longest in stock market history, most expertsagree that the rally started on March 9, 2009. This means that September 8, 2018, marked 9½ years, or114 months, since its start. Since, for convenience, we will be using returns for calendar months for thisanalysis, we will begin the bull market rally on March 1, 2009 and therefore August 31, 2018, will markthe end of the 114-month period. Figure 1 presents the cumulative and annualized performance of theB400 over this 114-month period and compares it to the performance of well accepted size and stylebenchmarks.Figure 1. B400 — Bull Market PerformanceMarch 1, 2009 Through August 31, 2018Size & StyleMulti CapLarge Cap BlendTotal ReturnsCumulative 2%12.3IndexBarron’s 400S&P 500B400S&P 500Russell 1KRussell 1K ValueRussell 1K GrowthR1KLarge Cap BlendR1K ValueLarge Cap ValueR1K Growth Large Cap ll 2KRussell 2K ValueRussell 2K GrowthR2KSmall Cap BlendR2K ValueSmall Cap ValueR2K Growth Small Cap Growth409.5359.4460.918.717.419.916.917.017.4S&P Mid CapRussell Mid CapS&P MCRMC426.1429.919.119.214.714.1Mid Cap BlendMid Cap BlendSource: Bloomberg & MarketGrader Research.The B400 is a multi-cap index that is size and style agnostic as it uses a proprietary bottoms-upmethodology based on company fundamentals to select stocks to be included into the index. On acumulative basis, the B400 outperformed the S&P 500 by more than 70 percentage points over this 9 ½year period (453.6% versus 382.0%). This is significant as it translates into an outperformance of morethan 170 basis points annually (19.7% versus 18.0%).1See, “Bull Market Hits a Milestone: 3,456 Days. Most Americans Aren’t at the Party,” by Matthew Phillips published in TheNew York Times, August 22, 2018, and “Reflections on the 9½-Year-Long Bull Market,” by John Prestbo published in The WallStreet Journal, September 9, 2018.Powered by MarketGrader Research1
The adage that a rising tide lifts all boats could not ring truer than in the current bull market. All of thesize and style benchmarks continue to perform very well. However, using the size and style categoriesas defined by Russell, it seems small stocks (as measured by the R2K) are doing slightly better thanlarge stocks (as measured by the R1K) and growth stocks (as measured by the R1K Growth and R2KGrowth) are significantly outperforming value (as measured by the R1K Value and R2K Value). Indeed,the R2K, so far, is up 409.5% while the R1K is up 388.5%. In addition, the R1K Growth and the R2KGrowth are up 457.1% and 460.9%, respectively. While, the R1K Value and R2K Value are only up325.4% and 359.4% over the same period. In summary, so far during the current bull market, small capstocks are slightly outperforming large cap stocks and growth stocks are significantly outperformingvalue stocks.Keeping this size and style summary in mind, it is obvious that from an equity asset allocationperspective, portfolios that allocated more capital to small companies and growth companies over thisbull market run would be outperforming, in terms of capital appreciation, portfolios that were size andstyle neutral. Recall, that the primary objective of the B400 is to be a measure of the capitalappreciation opportunities in the US equity market. We also know that the B400 not only significantlyoutperformed the S&P 500 but that it also satisfied its stated objective of providing a full measure ofcapital appreciation during this bull market. So how did the B400 do it? Was it overweight small stocksand growth stocks? The next section of this paper will provide the answer. Though it might be worthclarifying that for the B400 any over/under weighting of equity size and style categories is an outcomeof the bottoms-up stock selection methodology and not an outcome of a top-down asset allocationstrategy. In other words, the B400’s methodology is not making active bets on the performance of thesize and style categories but using company fundamentals to select the best companies irrespective oftheir size and style categories. If this stock selection turns out to be an implicit bet on a size and/or stylecategory, then so be it.Before we proceed to analyze the performance of the B400, a final observation from Figure 1. Noticethe annual standard deviation of the B400 of 15.2% is greater than that of the R1K (the large capbenchmark) which has a standard deviation of 12.5% but less than that of the R2K (the small capbenchmark) which has a standard deviation of 16.9%. Again, this is to be expected as the B400 is amulti-cap index and holds both large cap and small cap stocks.Return-Based Size & Style LoadingsThere are two basic methodologies to analyze the sources of returns for a portfolio. The first, aholdings-based analysis, uses the performance of all of the individual securities held by a portfolio.Given that the B400 is reconstituted and rebalanced on a semi-annual schedule, and that over this 9½year period the index was reconstituted 19 times, a holdings-based analysis of the B400 over this entireperiod will not only be cumbersome but may also be too granular so as to be insightful.The second methodology is the returns-based style analysis. The objective of the returns-based styleanalysis is to try and “best” replicate the returns of a portfolio by holding a weighted portfolio of sizeand style benchmarks — in this case we are using the R1K Value, R1K Growth, R2K Value and R2KPowered by MarketGrader Research2
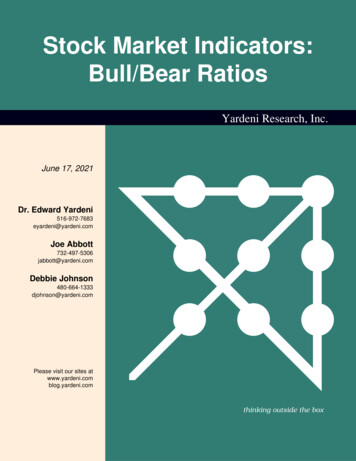
Growth2. The methodology we employed assumes that the weights add up to 100% (i.e., there is noleverage) and the portfolio is fully invested (i.e., there is no cash holding). In addition, none of theweights could be negative (i.e., there is no shorting). Figure 2 below presents the implied weights (factorloadings) for the B400 and compares the results to the S&P 500 and two mid-cap indexes.3Figure 2. B400 — Bull Market Returns-Based Size and Style LoadingsMarch 1, 2009 Through August 31, 2018BenchmarkR1K ValueR1K GrowthR2K ValueR2K GrowthSize Loadings:LargeSmallStyle LoadingsValueGrowthB40020%211940S&P 50050%50-S&P MC14%304016Russell 50R-Square77%97%87%92%Source: Returns from Bloomberg. Analysis by MarketGrader Research. “R-Square” is the R-Square from the OLS regression.The factor loadings for each of the indexes illustrate the respective weights of the four size and stylebenchmarks. These factor loadings are such that the returns of the implied weighted portfolio (made upof the four size and style benchmarks) will best mimic the returns of the index. The degree to which theactual return variation can be explained by the implied weighted portfolio is indicated by the R-Squarepresented in the figure. Therefore, a large degree (97%) of the S&P 500’s return variability over thisperiod (and in general) can be explained by a portfolio that is 50% R1K Value and 50% R1K Growthmaking it a Large Cap blend benchmark.As mentioned earlier, the factor loadings do not imply that the portfolio is holding the underlying sizeand style benchmarks (or even the stocks that are included in those benchmarks). Therefore, the S&P500 is not holding the R1K Value and R1K Growth since we know it is made up of around 500 large capstocks selected by a committee. This point is further clarified by the factor loadings of the Russell MCindex. Note that factor loadings to the large cap benchmarks (R1K Value R1K Growth) is 65% and tothe small cap benchmarks (R2K Value R2K Growth) is 35% and the implied weighted portfolioexplains 92% of the return variability of the Russell MC. However, we know that that the Russell MCindex actually holds no small cap stocks. According to its methodology, it is made up of the smallest2By “best” we mean the weightings for the size and style benchmarks minimize the return variability between the returns ofthe actual portfolio and the return of the weighted portfolio.3These weights are referred to as factor loadings so as to clarify that they are the weights derived from an optimization. Theactual portfolio, may or may not, have the implied exposures.Powered by MarketGrader Research3
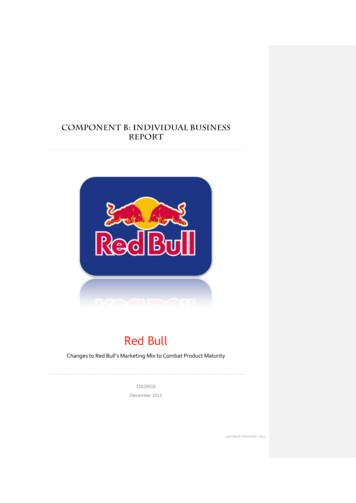
800 stocks in the R1K. In other words, it is essentially the R1K (the largest 1000 stocks by market cap)less the largest 200 stocks.4Which brings us to the B400. We know the stock selection methodology of the B400 is size and styleagnostic5. In other words, the key determinant if a company gets selected into the index is itsfundamentals. Therefore, the B400 is a multi-cap index that includes both large and small stocks. Overthe current bull market run, the implied factor loadings that best explain the returns of the B400 are20% in R1K Value, 21% in the R1K Growth, 19% in the R2K Value and 40% in the R2K Growthindexes. In terms of a size comparison only, this implies a total factor loading of 41% to large cap and59% to small cap. While in terms of style comparison only, this implies a loading of 39% to value and61% to growth.This implied overweighting of small caps (relative to large caps) and growth stocks (relative to valuestocks), partially explains the outperformance of the B400 relative to its peers as presented in Figure 1.However, notice that the factor loadings weighted portfolio in the case of the B400 only explains 77% ofthe variability in its returns. As we shall see in Figure 3, the remaining is a consequence of its stockselection methodology.Figure 3, presents the expected returns of the factor loadings weighted portfolio (rebalanced annually)and compares it to the actual benchmarks.Figure 3. B400 — Bull Market AlphaMarch 1, 2009 Through August 31, 2018IndexB400S&P 500S&P MCRussell MCTotal Return (TR)19.74%18.0119.1019.19AnnualizedExpected TR18.80%18.0318.4418.36Excess TR - Alpha94 bps-26683Source: MarketGrader Research. The “Expected TR” is calculated as the factor loadings times the annualized total returns of the size and stylebenchmarks. The “Excess TR” is the difference between the Total Return and the Expected Return.Notice that over this period, the B400, S&P Mid Cap and Russell Mid Cap indexes experienced anannual return greater than that can be explained by the factor loadings. Consequently, all of the indexeshave a positive alpha. But it is important to keep in mind that the implied sources of returns for the threeindexes was significantly different: For the S&P Mid Cap and Russell Mid Cap, the outperformance is asa result of their “beta” measures of the mid cap style segment outperforming the “beta” measures ofRussell large and small size segments. But for the B400, the outperformance is as a result of itsbottoms-up stock selection methodology based on company fundamentals, outperforming the betameasures of the Russell large, small and mid-cap size segments.4Which means that an investor allocating to the R1K and the Russell MC is essentially allocating to the R1K stocks whileoverweighting the bottom 800 stocks and therefore relatively underweighting the top 200 stocks.5The methodology of the B400 incorporates constraints to ensure that the resulting index is diversified across size andsectors, but in most cases, they are not binding. For more, go to www.marketgrader.com.Powered by MarketGrader Research4
ConclusionsThis paper set out to explore the performance of the B400 over the current bull market run. We used anempirical approach that lets the return data speak for itself. Performance of the broad beta size andstyle factors as measured by the Russell benchmarks revealed that over the current bull market thatstarted its run in March 2009 and continues through August 2018, small cap growth stocks were thesweet spot of the equity market. In other words, over this fantastic market rally, in which the broadmarket as measured by the S&P 500 had a cumulative gain of 380%, the only way for a broad portfolioto outperform the market was to be overweight the outperforming size and style factors (an overweightin outperforming sectors could have also achieved the outcome but that is the subject of anotherpaper). Small (versus large) was the outperforming size factor and growth (versus value) was theoutperforming style factor.To understand the factors driving returns, we next performed a return-based style analysis on the broadindexes and the B400. The returns-based style analysis revealed that, as measured by the factorloadings, the B400 was overweight both the outperforming factors, over the current bull market run.Consequently, the B400 outperformed the broad market by more than 70 percentage points over this9½ year period for a total cumulative gain of 452.6%, thereby, satisfying its primary objective ofproviding a measure of the capital appreciation opportunity within the US equity market. The B400accomplished this remarkable feat not by taking bets on the outperforming size and style factors, butby staying true to its methodology, i.e., implementing a proprietary bottoms-up stock selection processthat uses company fundamentals to select the 400 best companies as components of the index. It justso happened to be that this process selected more small companies and growth companies – thecategories that outperformed during this bull market run. The stock selection methodology performedso well that the B400 also outperformed other beta mid cap benchmarks.It is worth noting that although the B400 does not place top-down bets across size or style factors, theB400 stock selection methodology is designed to lean towards small to midcap companies in terms ofsize and towards growth companies in terms of style. MarketGrader believes that in the long-run thestock market has a natural upward trend and therefore included two key features into the design of theB400 that were meant to capture the above average equity premium of faster growing stocks. First,companies selected into the index should be trading at a reasonable price and should be profitable.This is the fundamental, quality-GARP-based stock selection screen incorporated into the methodologythat is implemented twice a year. The second feature included into the methodology was the equalweighting of all index constituents. This weighting rebalance is also implemented twice a year when theindex is reconstituted. These two key features have allowed the index, over time, to select fastergrowing companies, which on average tend to be smaller than the average of the market cap weightedbenchmark. Furthermore, equally weighting each company allows each company to contribute equallyto the performance of the index, irrespective of its size.The analysis presented in this paper is historical and since we know that past performance is not anindicator of future results, the next logical question is what does this mean for the B400 in terms ofwhere the market is heading? We also know that if is virtually impossible, if not extremely difficult topredict, in terms of timing, what the market is going to do. Will this bull market continue? Or, has it runout of steam and is due for a correction? Or, as some doomsayers claim a crash is imminent?Powered by MarketGrader Research5
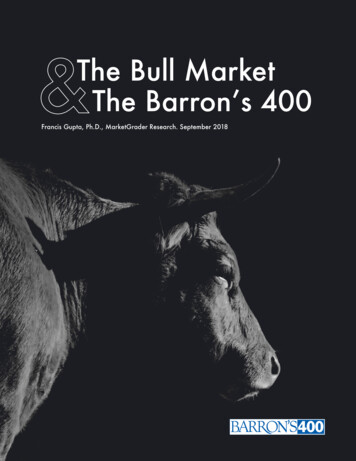
Irrespective of what the market is going to do, we are certain that the B400 will stay true to itsphilosophy of implementing its tried and tested methodology of selecting 400 stocks every six monthsbased on the fundamentals of the companies given the current financial and economic environment.The B400 has implemented this disciplined approach to reconstitute the index since its inception onDecember 31, 1997 and has continued doing so through two market cycles. The results speak forthemselves: over the 20½ year period ending August 31, 2018, the B400 has had a total cumulative gainof 836.8% while the S&P 500 has grown by 312.0% — an outperformance greater than 500 percentagepoints.6Bull Market Total Cumulative Return B400 vs. BenchmarksMarch 1, 2009 Through August 31, 2018500%450%400%Barron's 400 Index: 454%S&P 500 Index: 382%Russell 1000 Index: 389%350%Russell 1000 Value: 325%300%Russell 2000 Index: 410%Russell 1000 Growth: 457%Russell 2000 Value: 359%250%Russell 2000 Growth: 461%S&P MidCap 400 Index: 426%200%Russell MidCap Index: -14Feb-15Feb-16Feb-17Feb-18Source: Bloomberg.6Go to www.marketgrader.com/resources/pdf/B400 Factsheet 07172018.pdf to download the factsheet for the B400.Powered by MarketGrader Research6
The Barron’s 400 — Bull Market Performance in the Crosshairs Stock market watchers fall into two camps when discussing the start of the current bull market: those who believe it started in March 2009 and consequently is the longest running bull market in history, and those who argue that