Transcription
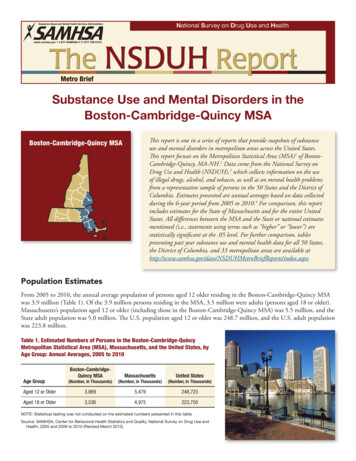
Metro BriefSubstance Use and Mental Disorders in theBoston-Cambridge-Quincy MSAThis report is one in a series of reports that provide snapshots of substanceuse and mental disorders in metropolitan areas across the United States.This report focuses on the Metropolitan Statistical Area (MSA)1 of BostonCambridge-Quincy, MA-NH.2 Data come from the National Survey onDrug Use and Health (NSDUH),3 which collects information on the useof illegal drugs, alcohol, and tobacco, as well as on mental health problemsfrom a representative sample of persons in the 50 States and the District ofColumbia. Estimates presented are annual averages based on data collectedduring the 6-year period from 2005 to 2010.4 For comparison, this reportincludes estimates for the State of Massachusetts and for the entire UnitedStates. All differences between the MSA and the State or national estimatesmentioned (i.e., statements using terms such as “higher” or “lower”) arestatistically significant at the .05 level. For further comparison, tablespresenting past year substance use and mental health data for all 50 States,the District of Columbia, and 33 metropolitan areas are available s/index.aspx.Boston-Cambridge-Quincy MSAPopulation EstimatesFrom 2005 to 2010, the annual average population of persons aged 12 older residing in the Boston-Cambridge-Quincy MSAwas 3.9 million (Table 1). Of the 3.9 million persons residing in the MSA, 3.5 million were adults (persons aged 18 or older).Massachusetts’s population aged 12 or older (including those in the Boston-Cambridge-Quincy MSA) was 5.5 million, and theState adult population was 5.0 million. The U.S. population aged 12 or older was 248.7 million, and the U.S. adult populationwas 223.8 million.Table 1. Estimated Numbers of Persons in the Boston-Cambridge-QuincyMetropolitan Statistical Area (MSA), Massachusetts, and the United States, byAge Group: Annual Averages, 2005 to 2010Age GroupBoston-CambridgeQuincy MSAMassachusettsUnited States(Number, in Thousands)(Number, in Thousands)(Number, in Thousands)Aged 12 or Older3,8695,479248,723Aged 18 or Older3,5364,975223,750NOTE: Statistical testing was not conducted on the estimated numbers presented in this table.Source: SAMHSA, Center for Behavioral Health Statistics and Quality, National Survey on Drug Use andHealth, 2005 and 2006 to 2010 (Revised March 2012).
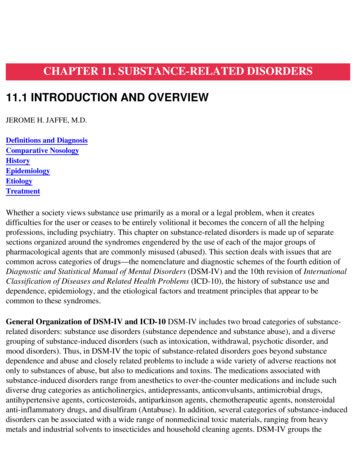
THE NSDUH REPORT: Metro BriefBoston-Cambridge-Quincy MSAIllicit Drug UseIn the Boston-Cambridge-Quincy MSA, an annual average of 587,000 persons aged 12 or older used anyillicit drug in the past year.5 This represents 15.2 percent of the MSA population and is lower than the ratefor the State of Massachusetts (16.7 percent) but is similar to the national rate (14.7 percent) (Figure 1). Therate of marijuana use in the past year was 12.6 percent, which was similar to the rate in Massachusetts buthigher than the national rate. The rate of nonmedical use of prescription-type pain relievers was lower in theBoston-Cambridge-Quincy MSA than in the State of Massachusetts (4.3 percent in the MSA vs. 5.3 percentin Massachusetts).Figure 1. Past Year Use of Selected Illicit Drugs for the Boston-Cambridge-Quincy Metropolitan Statistical Area(MSA), Massachusetts, and the United States among Persons Aged 12 or Older: Annual Averages, 2005 to idgeQuincy MSA10.78Massachusetts4.3a45.34.9United States0Any Illicit DrugMarijuanaPrescription-TypePain Relievers (Nonmedical)NOTE: For additional data, please see the tables available at index.aspx.abDifference between Boston-Cambridge-Quincy MSA estimate and Massachusetts estimate is statistically significant at the .05 level.Difference between Boston-Cambridge-Quincy MSA estimate and United States estimate is statistically significant at the .05 level.Source: SAMHSA, Center for Behavioral Health Statistics and Quality, National Survey on Drug Use and Health, 2005 and 2006 to 2010 (RevisedMarch 2012).2
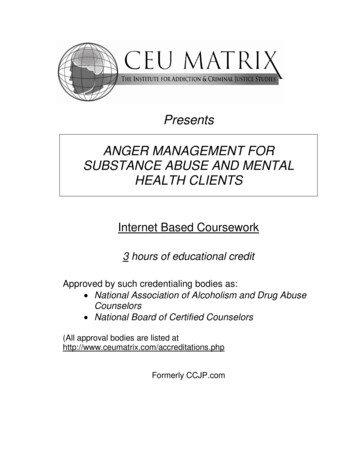
THE NSDUH REPORT: Metro BriefBoston-Cambridge-Quincy MSASubstance Use or Mental DisordersIn the Boston-Cambridge-Quincy MSA, 396,000 persons aged 12 or older were classified as having asubstance use disorder in the past year. The corresponding rate (10.2 percent) was similar to the rate inMassachusetts but was higher than the national rate (Figure 2).6 Among adults aged 18 or older in theBoston-Cambridge-Quincy MSA, 7.1 percent (249,000 adults) experienced a major depressive episodein the past year.7 This rate was similar to the rates in Massachusetts and in the Nation as a whole.Figure 2. Past Year Substance Use Disorder and Major Depressive Episode for the Boston-Cambridge-QuincyMetropolitan Statistical Area (MSA), Massachusetts, and the United States among Persons Aged 12 or Older(Except as Noted): Annual Averages, 2005 to dgeQuincy MSAMassachusetts4United States20Substance Use DisorderMajor Depressive Episode (Aged 18 or Older)NOTE: For additional data, please see the tables available at index.aspx.abDifference between Boston-Cambridge-Quincy MSA estimate and Massachusetts estimate is statistically significant at the .05 level.Difference between Boston-Cambridge-Quincy MSA estimate and United States estimate is statistically significant at the .05 level.Source: SAMHSA, Center for Behavioral Health Statistics and Quality, National Survey on Drug Use and Health, 2005 and 2006 to 2010 (RevisedMarch 2012).3
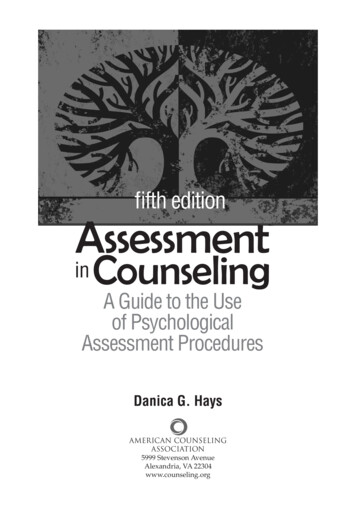
THE NSDUH REPORT: Metro BriefBoston-Cambridge-Quincy MSACigarette and Binge Alcohol UseIn the Boston-Cambridge-Quincy MSA, 18.6 percent of persons aged 12 or older smoked cigarettes in thepast month (Figure 3). The MSA rate of use was lower than the rates in Massachusetts and in the Nation. Inthe Boston-Cambridge-Quincy MSA, 23.9 percent of persons aged 12 or older participated in binge alcoholuse at least once during the past month,8 with similar rates in Massachusetts and in the Nation as a whole.Figure 3. Past Month Cigarette and Binge Alcohol Use for the Boston-Cambridge-Quincy Metropolitan StatisticalArea (MSA), Massachusetts, and the United States among Persons Aged 12 or Older: Annual Averages, 2005 onCambridgeQuincy MSA15Massachusetts10United States50Cigarette UseBinge Alcohol UseNOTE: For additional data, please see the tables available at index.aspx.abDifference between Boston-Cambridge-Quincy MSA estimate and Massachusetts estimate is statistically significant at the .05 level.Difference between Boston-Cambridge-Quincy MSA estimate and United States estimate is statistically significant at the .05 level.Source: SAMHSA, Center for Behavioral Health Statistics and Quality, National Survey on Drug Use and Health, 2005 and 2006 to 2010 (RevisedMarch 2012).4
THE NSDUH REPORT: Metro BriefBoston-Cambridge-Quincy MSAEnd Notes1. MSAs are geographical entities used by Federal agencies to collect, analyze, and publish statistical data. These areasare defined and updated periodically by the Office of Management and Budget (OMB). MSAs defined in this reportare based on updates made by OMB on December 1, 2009, to reflect Census Bureau population estimates for July1, 2007, and July 1, 2008. More details are provided at assets/bulletins/b10-02.pdf (Executive Office of the President, Office of Management and Budget, 2009).2. The Boston-Cambridge-Quincy MSA consists of Essex County, MA; Middlesex County, MA; Norfolk County, MA;Plymouth County, MA; Suffolk County, MA; Rockingham County, NH; and Strafford County, NH.3. NSDUH is an annual survey of the U.S. civilian noninstitutional population aged 12 or older in the 50 States andthe District of Columbia. The survey collects data by administering questionnaires to a representative sample ofthe population through face-to-face interviews at the respondent’s place of residence. NSDUH is sponsored by theSubstance Abuse and Mental Health Services Administration (SAMHSA) and is managed by SAMHSA’s Center forBehavioral Health Statistics and Quality (CBHSQ). For more information, see the 2010 NSDUH national findingsreport at ults.htm (CBHSQ, 2011a).4. All estimates shown in this report and the detailed tables used the corrected 2006-2010 data files that were updatedto account for errors found in Pennsylvania (2006-2010) and Maryland (2008-2009). The erroneous Pennsylvaniaand Maryland data were removed and the remaining cases were reweighted in the years noted. No correctionswere needed for the 2005 data file. These estimates are based solely the weighted sample for each area (i.e., directestimates) and are weighted to represent the civilian noninstitutional population at the MSA, State, and nationallevels based on the selection probabilities (at each stage of selection), nonresponse adjustments, and adjustmentsto State- and national-level population estimates from the U.S. Census Bureau. However, no special adjustmentswere applied to adjust these weights to Census population estimates for the Boston-Cambridge-Quincy MSA.See Section A.3.3 of Appendix A in the 2010 NSDUH national findings report at ults.htm (CBHSQ, 2011a).5. Illicit drugs include marijuana/hashish, cocaine (including crack), heroin, hallucinogens, inhalants, or prescriptiontype psychotherapeutics used nonmedically. These estimates do not include data from new methamphetamine itemsadded in 2005 and 2006. See Section B.4.8 of Appendix B in the 2008 NSDUH national findings report at ts.htm (Office of Applied Studies [now CBHSQ], 2009).6. Substance use disorder is defined as dependence on or abuse of illicit drugs or alcohol based on definitions foundin the fourth edition of the Diagnostic and Statistical Manual of Mental Disorders (DSM-IV; American PsychiatricAssociation, 1994). See Section B.4.2 of Appendix B in the 2010 NSDUH national findings report at ults.htm (CBHSQ, 2011a).7. Major depressive episode is defined in DSM-IV (American Psychiatric Association, 1994) as a period of at least2 weeks when a person experienced a depressed mood or loss of interest or pleasure in daily activities and had amajority of specified depression symptoms. See Section B.4.4 of Appendix B in the 2010 NSDUH mental healthfindings report at http://www.samhsa.gov/data/NSDUH/2k10MH Findings/2k10MHResults.htm (CBHSQ,2011b).8. Binge alcohol use is defined as drinking five or more drinks on the same occasion (i.e., at the same time or within acouple of hours of each other) on at least 1 day in the 30 days prior to the survey.5
THE NSDUH REPORT: Metro BriefBoston-Cambridge-Quincy MSAReferencesAmerican Psychiatric Association. (1994). Diagnostic and statistical manual of mental disorders (4th ed.). Washington,DC: Author.Center for Behavioral Health Statistics and Quality. (2011a). Results from the 2010 National Survey on Drug Use andHealth: Summary of national findings (NSDUH Series H-41, HHS Publication No. SMA 11-4658). Rockville,MD: Substance Abuse and Mental Health Services Administration. Retrieved from ults.htmCenter for Behavioral Health Statistics and Quality. (2011b). Results from the 2010 National Survey on Drug Use andHealth: Mental health findings (NSDUH Series H-42, HHS Publication No. SMA 11-4667). Rockville, MD:Substance Abuse and Mental Health Services Administration. Retrieved from http://www.samhsa.gov/data/NSDUH/2k10MH Findings/2k10MHResults.htmExecutive Office of the President, Office of Management and Budget. (2009, December 1). Update of statistical areadefinitions and guidance on their uses (OMB Bulletin No. 10-02). Washington, DC: Author. Retrieved from assets/bulletins/b10-02.pdfOffice of Applied Studies. (2009). Results from the 2008 National Survey on Drug Use and Health: National findings(NSDUH Series H-36, HHS Publication No. SMA 09-4434). Rockville, MD: Substance Abuse and Mental HealthServices Administration. Retrieved from ts.htmU.S. DEPARTMENT OF HEALTH AND HUMAN SERVICESSubstance Abuse and Mental Health Services AdministrationCenter for Behavioral Health Statistics and Qualitywww.samhsa.gov/data6
Drug Use and Health (NSDUH), 3. which collects information on the use of illegal drugs, alcohol, and tobacco, as well as on mental health problems . from a representative sample of persons in the 50 States and the District of Columbia. Estimates presented are annual averages based on dat