Transcription
An introduction to EEGNeuroimaging workshopJuly 15, 2011Benjamin Files
The plan EEG Basics:– What does it measure?– What is it good for? DNI’s EEG equipmentMy advice for designing an EEG experimentA basic ERP analysisIf time permits: advanced topics
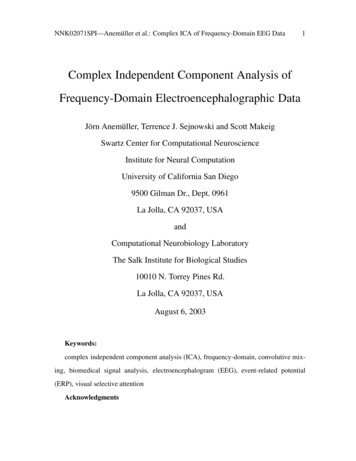
EEG measures electric potentialsFrom Luck, S.J., (2005). An Introduction to the Event-Related Potential Technique. Cambridge,MA: MIT Press
The signal is weak,so averaging is required Voltage relative to some time-locking event:Event-related potential (ERP) Frequency spectrum Time/frequency transform:– Event-related spectral perturbation (ERSP)– Inter-trial Coherence (ITC)
Event-related potential erpology: the study of how experimentalmanipulations change ERP componentlatency/amplitude– Making the connection b/w an ERP effect and a brain effectcan be tricky Recommended reading:– Luck, S. (2005). An Introduction to the Event-RelatedPotential Technique: The MIT Press, Cambridge MA. Some “Gotchas” while reading ERP papers:–––––Not everyone uses the same reference electrodeSometimes negative is upBeware of spatial claimsCherry-picking is standard practiceBeware of biased measuresLuck, S. J., Hillyard, S. A., Mouloua, M., Woldorff, M. G., Clark, V. P., & Hawkins, H. L. (1994). Effectsof spatial cuing on luminance detectability: psychophysical and electrophysiologicalevidence for early selection. Journal of Experimental Psychology: Human Perception andPerformance, 20(4), 887-904.
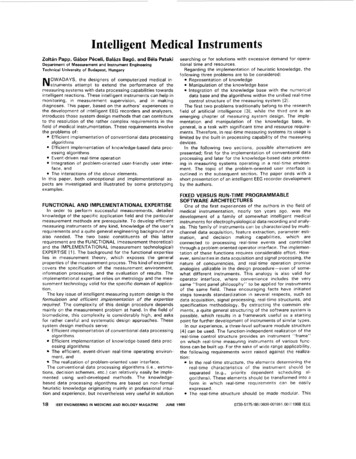
Frequency Spectrum SSVEP Traditionalfrequency bands:Andersen, S. K., Hillyard, S. A., & Müller, M. M. (2008). Attention facilitatesmultiple stimulus features in parallel in human visual cortex.Current Biology, 18(13), 1006-1009.– Delta (1-4 Hz)– Theta (4-8 Hz)– Alpha (8-12 Hz)– Beta (12-24 Hz)– Gamma ( 30 & up)
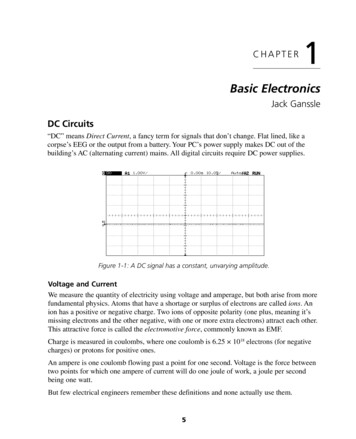
Time/Frequency
The strength of EEG is timing EEG has very high temporal resolution(typically 2 ms) EEG is best suited to hypotheses about timeand frequency.– Speed of processing– Relative order of processes– Temporal relationships (correlation, functionalconnectivity)
EEG can measure amplitude
Amplitude can be tricky to interpret
EEG can provide spatial informationScalp TopographySource localizationPonton, C. W., Bernstein, L. E., & Auer, E. T. (2009). Mismatch negativity withvisual-only and audiovisual speech. Brain Topography, 21(3-4), 207215.
End of EEG Basics! EEG measures electric potentials EEG signals can be used in many ways:– ERP– Frequency– Time/Frequency EEG is best-suited to hypotheses about time EEG can provide spatial information
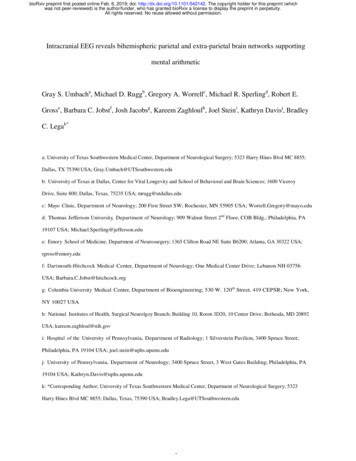
DNI EEG equipment: CapsTwo caps, medium and small.Cap layout, modified 10-20 system.AFz ground, vertex refDrop electrodes: EOG*, mastoids, EMG(?)Also some maglink capsPhoto 1: http://www.neuroscan.com/EpilepsyPlatforms.cfm
DNI EEG equipment: Headbox, Amps
DNI EEG equipment: Prep Options“Quik-Gel” (Gloopy off-white paste)“Quik-Cel” (sponges electrolyte) Pros: Pros:– Can achieve very lowimpedance– Long-lasting– Pain-free, fast prep– Tidy Cons: Cons:– Messy– Subject discomfort– Uneven quality/shelf lifeImages from neuroscan.com–––––Higher impedanceLonger setupSalt bridging more likelySponges dry outResults depend on subject’shair type
Advice for designing an experiment Have a solid time-locking signalHave a hypothesis about or including timeYou’ll need a lot of trials for averagingBreak your experiment into short blocksBuild in lots of time for breaks
ERP analysis overview Available softwareThe general workflowDemo: EDITDemo: EEGLAB
Available Software: EDIT EDIT is commercial software from Neuroscan– Requires a hardware license dongle EDIT strengths:– Fairly easy point & click interface– Handles arbitrarily large files (*)– Has an associated scripting language (tcl) EDIT weaknesses:––––Hodge-podge of outdated methodsFills up your hard diskClosed sourceWeak user community
Available Software: EEGLAB EEGLAB is free software from SCCN (ucsd)– From the web: http://sccn.ucsd.edu/eeglab/ EEGLAB strengths–––––Decent GUIRuns in MATLABOpen sourceStrong user groupLots of advanced methods EEGLAB weaknesses– Very RAM intensive– Developers very focused on ICA and T/F analyses
Demo analysis Thanks to Farhan Baluch for supplying demodata The example data:– Visual stimulus– Only posterior electrodes (21)– Vertex reference– 1000 Hz, 32 bits– Recorded here
General Workflow Pre-process your CNT file*– Filtering, eyeblink artifact reduction EpochBaseline correctArtifact rejectAverageExport measure of interest
Demo using EDIT: A CNT file
The action is in the transforms menu
Transforms - epoch
Set sort criteria
An epoched file (*.eeg)
Baseline correction
Epoch 1
Epoch 3
Artifact Rejection
After artifact rejection
averaging
There’s your ERP
Right-click - butterfly plot
Export for hypothesis testing
Here’s an area report
Demo using EEGLABMatlab: eeglab
File import data from neuroscan .cnt
32 bits!
Help tells you how to do it with scripts
Now the data’s in.
Tools extract epochs
You can choose to overwrite, save,rename etc.
It knows baseline correction is next
Check number of sweeps etc.
Tools reject data epochs reject extreme values
Epochs are marked for rejection, withthe offending electrode(s) highlighted
Plot channel erp image(many plots are unavailable w/o locations)
See help messages forwhat all these mean
All this & more in CLI(EEG struct holds everything)
Use CLI to get a butterfly plot figure; plot(EEG.times,mean(EEG.data,3),'b')
Advanced topics Permutation TestingUsing all your electrodesIndependent Components AnalysisSource analysis
Permutation testing Null hypothesis:– There is NO DIFFERENCE betweendatasets A and B Logic:– If there is no difference, re-assigning data points from set A to B(and vice-versa) should not affect the outcome of any test Procedure:– Relabel datapoints to create pseudo-sets of A & B– Compare a statistic (e.g. t) for the actual dataset to that samestatistic for your pseudo-sets– If the proportion of pseudo-sets generating a test statistic moreextreme than your actual statistic is low (less than p), reject thenull hypothesis
Example:100 ‘deviant’ trials1000 ‘standard’ trialsCreate pseudo-sets by takingall 1100 trials and randomlyassigning 100 to be called‘deviant’.Compute my measure (here,GFP difference) on 2000 relabelingsCompare the null distributionto my actual resultNichols, T. E., & Holmes, A. P. (2002). Nonparametricpermutation tests for functional neuroimaging:a primer with examples. Human Brain Mapping,15(1), 1-25.
Using all your electrodes Global Field Potential– Measures overall amount of activity at a time-point– Spatial RMS Topographic Dissimilarity– Summary of how different a pair of topographic mapsare– Controls for differences in GFPMurray, M. M., Brunet, D., & Michel, C. M. (2008). Topographic ERP analyses: astep-by-step tutorial review. Brain Topography, 20(4), 249-264. BSS/ICA– Finds spatial filters with recurring activity patterns
Independent Components Analysis Various methods exist:– Infomax, jader, sobi All seek spatial patterns in the EEG data thatoccur together Assumes observations result from a linearmixture of (unknown) sources
Source Localization Two problems– Inverse problem: Given these observations, what were thesources?– Forward problem: Given a source, what will theobservations be? The solutions? Make assumptions. (Choose a model)– Spherical shell, 1-dipole– Finite element model, source current density Using standard methods, spatial resolution is low (onthe order of 2-3 cm)– Fancy methods can achieve much higher spatial resolution(on the order of a few mm)
Check out Brainstorm http://neuroimage.usc.edu/brainstorm/ Very user-friendly
Jul 15, 2011 · EEG measures electric potentials From Luck, S.J., (2005). An Introduction to the Eve