Transcription
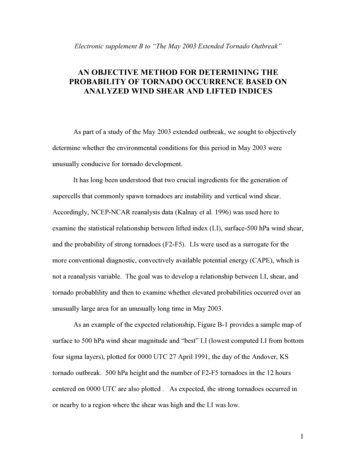
Electronic supplement B to “The May 2003 Extended Tornado Outbreak”AN OBJECTIVE METHOD FOR DETERMINING THEPROBABILITY OF TORNADO OCCURRENCE BASED ONANALYZED WIND SHEAR AND LIFTED INDICESAs part of a study of the May 2003 extended outbreak, we sought to objectivelydetermine whether the environmental conditions for this period in May 2003 wereunusually conducive for tornado development.It has long been understood that two crucial ingredients for the generation ofsupercells that commonly spawn tornadoes are instability and vertical wind shear.Accordingly, NCEP-NCAR reanalysis data (Kalnay et al. 1996) was used here toexamine the statistical relationship between lifted index (LI), surface-500 hPa wind shear,and the probability of strong tornadoes (F2-F5). LIs were used as a surrogate for themore conventional diagnostic, convectively available potential energy (CAPE), which isnot a reanalysis variable. The goal was to develop a relationship between LI, shear, andtornado probablility and then to examine whether elevated probabilities occurred over anunusually large area for an unusually long time in May 2003.As an example of the expected relationship, Figure B-1 provides a sample map ofsurface to 500 hPa wind shear magnitude and “best” LI (lowest computed LI from bottomfour sigma layers), plotted for 0000 UTC 27 April 1991, the day of the Andover, KStornado outbreak. 500 hPa height and the number of F2-F5 tornadoes in the 12 hourscentered on 0000 UTC are also plotted . As expected, the strong tornadoes occurred inor nearby to a region where the shear was high and the LI was low.1
Next, the relationship between tornado occurrence and wind shear and instabilitywas quantified. Inside an area over the Midwest (the blue box in panel c of Fig. B-1),each 2.5 degree2 grid box was either classified as strong tornadic (at least one F2 tornado occurred between 1800 UTC and 0600 UTC) or nontornadic (no F2 occurred)for each day in April and May from 1979 to 2002. The shear and LI were also noted atthese grid points. Figure B-2 provide a scatterplot of the nontornadic samples (panel a)and the tornadic samples (panel b). An estimate of the normalized probability density isalso plotted over the data. As expected, tornadoes more commonly occur at highershears and lower LIs than nontornadic events. The maximum probability density fornontornadic events was at approximately LI -2 and shear 13 ms-1, while themaximum density for tornadic events was at LI -5 and shear 22 ms-1. There weresome occurrences of tornadoes at positive LIs. These may be cases where the mesoscaleenvironment at the time of the tornado was less stable than the large-scale 0000 UTCanalysis. Another possibility is a poor analysis; humidity and surface temperaturenecessary for the LI calculation are notoriously difficult to analyze correctly.Nonetheless, the data appeared to support the hypothesis that analyzed shear andLI might be able to be used to discriminate between tornadic and nontornadic conditions.Accordingly, we developed a logistic regression model (Wilks 1995) to predict theconditional probability of a F2 tornado given the analyzed 0000 UTC shear and LI. Thelogistic regression model is of the formP (Tornado LI, shear) 1.0 – 1.0 / (1.0 exp (b0 b1*shear b2*LI ) )2
Using the 1979-2002 data (without cross validation), the logistic regression was used topredict the regression coefficients b0, b1, and b2. The resulting probability model oftornado probabilities as a function of shear and LI is shown in panel c of Fig. B-2. Asexpected, tornado probabilities increase as LI decreases and shear increases. Panel c ofFig. B-1 illustrates the predicted probability of tornadoes on the day of the Andover, KStornado outbreak. Figure B-3 shows that the tornado probabilities are quite reliable.While section 2 of the accompanying Bulletin article demonstrates that the May2003 tornado outbreak was unusually large and sustained, it would be useful to quantifywhether the environmental conditions supporting tornado development were anomalouslyconducive over a large region for a long time during May 2003. This can now beevaluated using the probability model. Let’s choose a probability threshold of 2.5percent as indicating a significantly elevated risk of a strong tornado, which isapproximately 3.5 times larger than the climatological probability. The fraction of gridpoints that have this elevated risk (inside the blue box in panel c of Fig. B-1) werecalculated, and a time series of this fraction was plotted (Fig. 9 in the Bulletin article).The time series shows that since 1979 no other period other than in early May 2003 had astring of 9 straight days where the fractional coverage of elevated risk was greater than0.2. This week in May 2003 did indeed have a sequence of days where shear and LI wereclimatologically anomalous over a large region. But the time series also suggests thatperiods of several days of sustained tornado-favorable conditions may be more frequentin recent years than they were back in the 1980’s.However, the notion that sustained tornado outbreaks are happening morefrequently is not supported by the observational data. Figure B-4 provides a time series3
of the fraction of 2.5ox2.5o grid boxes that had strong tornadoes. This time series ofactual tornadoes appears to be more stationary, with no evidence that the areal extent orfrequency of severe tornado outbreaks is increasing. Note from comparing the two timeseries that the large outbreaks generally correspond to situations where the fractionalcoverage of high tornado probability was large, but there are also frequent occurrenceswhere a large area of high probability existed but tornadoes did not occur (the two timeseries correlate at 0.45). Figure B-5 provides an example of such a “false alarm.”Tornado probabilities for this case day were high in southern Missouri, but tornadoes didnot occur. It does not appear that the errors are due to a faulty reanalysis; Skew-T data atthis time (Fig. B-6) supports the analysis of large shear and low LI’s. Obviously, thereare more factors that play a role in tornadogenesis than merely adequate shear andinstability, such as the presence or absence of mesoscale boundaries, convectiveinhibition, etc.ReferencesKalnay, E., and co-authors, 1996: The NCEP/NCAR 40-year reanalysis project. Bull.Amer. Meteor. Soc., 77, 437-472.Wilks, D.S., 1995: Statistical Methods in the Atmospheric Sciences. Academic Press,467 pp.4
Figure B-1: (a) Surface to 500 hPa wind shear magnitude and best (lowest 4 sigma layer)lifted index from NCEP-NCAR reanalysis on 0000 UTC 27 April 1991. (b) 500 hPaheight and the number of F2-F5 tornadoes in 2.5ox2.5o box for 12 hours centered on 0000UTC. (c) Probability of F2 tornado in 2.5ox2.5o box in 12-hour window centered on0000 UTC, determined from logistic regression model based on shear and LI (see Fig. B2 and associated discussion).5
Figure B-2: (a) Scatterplot of nontornadic or non-severe tornadic events as function ofLI and shear. Points taken from box in Fig. 2b for every day in April and May from 1979to 2002. (b) As in (a), but for tornadic events. (c) Logistic regression model of tornadoprobability as a function of shear and LI.6
Figure B-3. Reliability of tornado “forecasts” based on analyzed shear and LI. Insethistogram provides the frequency of issuance for each of the six binned forecasts,indicating that most of the time less than 1% probability is issued (379,871 forecasts withsuch a probability) but extreme probabilities are issued only very rarely (829 total). Datafrom April-May 1979 to 2002 using grid boxes inside blue box in Fig. B-1c.7
Figure B-4: As in Fig. 9, but for the fraction of grid boxes that had F2 tornadoes.8
Figure B-5: As in Fig. A-1, but for 0000 UTC 10 April 2001.9
Figure B-6: Skew-T from Springfield, MO on 0000 UTC 10 April 2001. Courtesy ofUniversity of Wyoming Atmospheric Sciences web site.10
Next, the relationship between tornado occurrence and wind shear and instability was quantified. Inside an area over the Midwest (the blue box in panel c of Fig. B-1), each 2.5 degree2 grid box was either classified as strong tornadic (at least one F2 tornado occurred betwee