Transcription
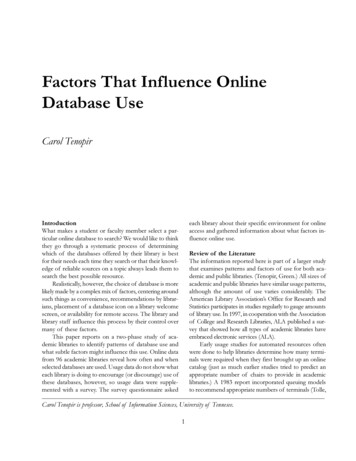
Factors that Influence Online Database Use1Factors That Influence OnlineDatabase UseCarol TenopirIntroductionWhat makes a student or faculty member select a particular online database to search? We would like to thinkthey go through a systematic process of determiningwhich of the databases offered by their library is bestfor their needs each time they search or that their knowledge of reliable sources on a topic always leads them tosearch the best possible resource.Realistically, however, the choice of database is morelikely made by a complex mix of factors, centering aroundsuch things as convenience, recommendations by librarians, placement of a database icon on a library welcomescreen, or availability for remote access. The library andlibrary staff influence this process by their control overmany of these factors.This paper reports on a two-phase study of academic libraries to identify patterns of database use andwhat subtle factors might influence this use. Online datafrom 96 academic libraries reveal how often and whenselected databases are used. Usage data do not show whateach library is doing to encourage (or discourage) use ofthese databases, however, so usage data were supplemented with a survey. The survey questionnaire askedeach library about their specific environment for onlineaccess and gathered information about what factors influence online use.Review of the LiteratureThe information reported here is part of a larger studythat examines patterns and factors of use for both academic and public libraries. (Tenopir, Green.) All sizes ofacademic and public libraries have similar usage patterns,although the amount of use varies considerably. TheAmerican Library Association s Office for Research andStatistics participates in studies regularly to gauge amountsof library use. In 1997, in cooperation with the Associationof College and Research Libraries, ALA published a survey that showed how all types of academic libraries haveembraced electronic services (ALA).Early usage studies for automated resources oftenwere done to help libraries determine how many terminals were required when they first brought up an onlinecatalog (just as much earlier studies tried to predict anappropriate number of chairs to provide in academiclibraries.) A 1983 report incorporated queuing modelsto recommend appropriate numbers of terminals (Tolle,Carol Tenopir is professor, School of Information Sciences, University of Tennesee.1April 8 11, 1999, Detroit, Michigan
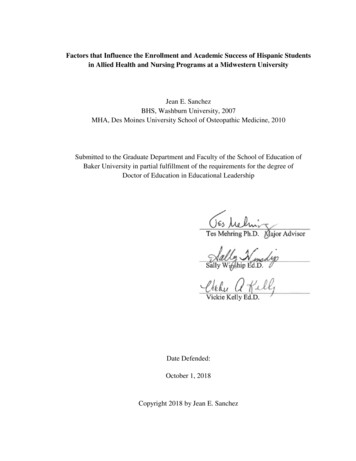
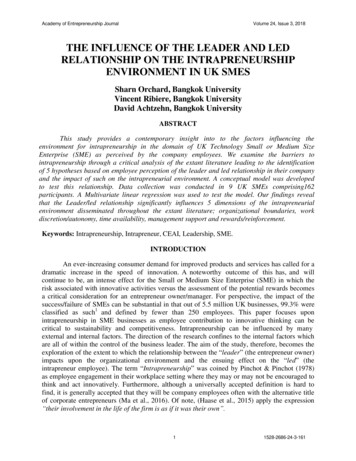
Carol Tenopir2Table 1. Carnegie Categories For Academic Institutions(Source: 2AABusTotalCarnegieClassBaccalaureate (Liberal Arts) Colleges IBaccalaureate Colleges IIMaster s (Comprehensive) IUniversities and CollegesMaster s (Comprehensive) IIUniversities and CollegesDoctoral Universities IDoctoral Universities IIResearch Universities IResearch Universities IIAssociate of Arts CollegesSchools of Business and Managementet al.). Turnstile counts were used to optimize referencedepartment staffing or pickup schedules for shelving.Turnstile counts show that peak usage periods in academic libraries correspond to the academic calendar anddaily class schedules (Murfin, McGrath.)Turnstile counts are not enough to see why a particular database is used. Librarians attitudes might beexpected to influence the amount of use an online database receives. Throughout the 1990s, I measured reference librarians attitudes toward electronic referenceproducts and changes in university reference services(Tenopir, Ennis). Reference rooms in libraries grewbusier throughout the decade. Many more workstations were added in libraries at the same time remoteNumber Surveysin Sample Received739532213access was made available. Users prefer electronic reference products, both from withinthe library and throughdial-up access, while library instruction classesnow most often focus onelectronic resources.1Methodology: Phase1 Usage Data32Measuring online usage is65more complex than turn156stile counts, sampling65workstation queues, or127even measuring access to33a single library s onlinecatalog. To get both re9658mote and in-houseonline activity for selected commercial databases frommany libraries, a major database producer andaggregator provided me with usage data for all of itsonline databases. This database aggregator providesonline access to many bibliographic, full text, and directory databases, 38 of which were used by one ormore academic libraries in this study.This database aggregator provides over 100 database titles, many of which contain overlapping information that is aimed at different audiences. For example,the same journals and magazines may be available in anindexing only version, a full text version, or a combination version. Versions indexing thousands of titles maybe sold to university libraries; small colleges may preferTable 2. Simultaneous Users, All Databases, Academic Libraries by Carnegie ClassNo. ofUsers12510152566B197.899.299.9100.0100.0 B296.898.799.9100.0100.0 ACRL Ninth National ConferenceM194.596.999.199.799.899.9 Cumulative PercentCarnegie .0100.0100.0 100.0100.0 9.9100.0 AA96.198.299.8100.0100.0 Bus.90.594.999.3100.0100.0
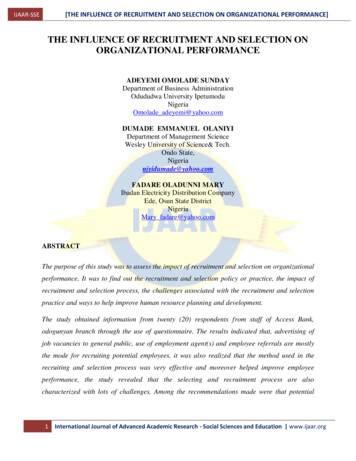
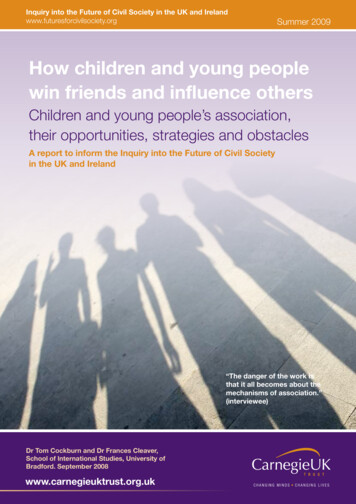
Factors that Influence Online Database Use3Methodology: Phase 2 QuestionnairesUsage data reveal typical patterns of usewithin classes of academic libraries, but0HDQ 6LPXOWDQHRXV 8VHUVversions with fewer, selected titles. Rarely does the samedo not identify why or how the specific environmentlibrary purchase overlapping titles, although a library maymight influence online use. To begin to answer thepurchase separate current and backfile versions or choosequestions of how and why, information beyond usa combined version. Some databases are subject speage data is needed. Information about unique envicific (business journals, for example); others are aimedronmental factors that may influence online use inat a general interest academic audience. For the purposesindividual libraries was sought by sending a questionof analysis, the 38 databases used by the libraries werenaire to each of the academic libraries for which weexamined in three different groupings: 1) all 38 datahad usage data. Fifty-eight libraries responded, for abases together; 2) eight databases that together coverreturn rate of 60%. Their distribution by Carnegiegeneral magazines and journals for academic librariesClass is shown in table 1.(including full text, indexing only, backfiles, and currentAnalyzed alone, the survey questions reveal muchfiles); 3) the single most heavily used database amongabout the different environments in academic librariesthese academic libraries (a current general magazine andand the role librarians play in influencing online use. Ajournal title.)final step will be to analyze the survey answers in conFrom a customer list of over 1200 libraries, a ranjunction with the usage pattern data.dom sample of 100 academic libraries in the U.S. andCanada was taken. From these, usable online usage dataAnalysis of Usage Patternswas available for 96 libraries. The 96 libraries cover evThe number of simultaneous users for all 38 databasesery Carnegie Class of parent academic institution, within all 96 libraries ranges from zero users (the mode andthe largest number from MI: Master s Universities andmedian) to 66 users (the mean is .28 and the standardColleges I (32 libraries). Table 1 shows how Carnegiedeviation is 1.36). Periods of high use follow clearly deClass was distributed in the study sample.fined patterns. Figures 1, 2 and 3 show the patterns ofOnline usage for every library is captured automatiuse aggregated for all databases, but separated by classcally by the database provider in five-minute intervals 24of library. Although the range and exact number of ushours a day. Even with a random sampleof only 96 libraries, a year s worth of dataFigure 1. Average Simultaneous Use Patterns by Time of Daywould thus yield over 10 million data pointsAcademic Libraries by Carnegie Classfor every database. For this study, usage % data were sampled once per hour (on eachhalf-hour), from the hours of 8 a.m. to% midnight, for a period of 6 months (July to December.)1 Still, over 281,000 data0 points per database are included in thissample of academic libraries.0 Usage data reveal how many simul ' taneous users are logged on to any onedatabase at any of the sampled times.' Time stamps on the data allow us to draw patterns that show average numbers of5 users by time of day, day of the week,and day of the month for each class of5 library and each database or databasegroup. %XV /RFDO RXUApril 8 11, 1999, Detroit, Michigan
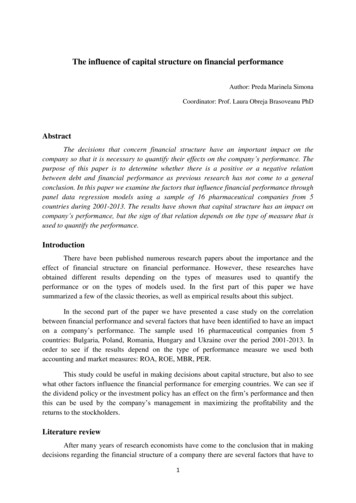
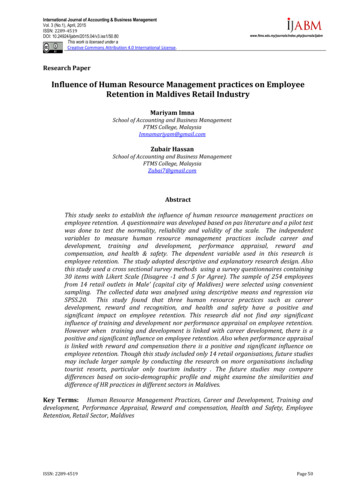
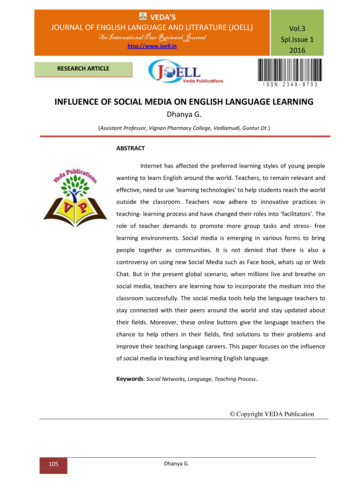
Carol Tenopir4Figure 2. Average Simultaneous Use Patterns by Day of Week,Academic Libraries by Carnegie Class % % 0 0HDQ 6LPXOWDQHRXV 8VHUV0 ' ' 5 5 %XV 68102178(:('7 8)5,6 7'D\ RI :HHNFigure 3. Average Simultaneous Use Patterns by Month,Academic Libraries by Carnegie Class % % 0 0 0HDQ 6LPXOWDQHRXV 8VHUV ' ' 5 5 %XV 0RQWKACRL Ninth National Conference ers varies by class of library, the patternsof use, including peaks and valleys, are quitesimilar. Not surprisingly, the busiest time foronline research in or from academic libraries is between 10 a.m. and 5 p.m., Mondaysand Tuesdays, in November. (It is likely thatApril and May would also be high usemonths.)Patterns of use for eight general databases together show similar patterns of use(figures 4, 5, and 6.) (The mode and median are still zero, but the mean is .56 andstandard deviation is 2.15.) The patterns ofuse for the one most heavily used generaldatabase are very similar, so are not presented here. Amounts of use are higher andvary more, however, with a mean of .84 simultaneous users and a standard deviationof 2.77 (the mode and median are still zero.)Averages do not show the true impactof multiple users on workstations, onlineports, and staff. Patterns do a better job, byhelping to identify times of heavy demand.Another way to show impact is to measurehow often multiple users are logged on.Tables 2 and 3 show how many simultaneous users are logged on at any one timeon any single database, aggregated first forall databases and secondly for the eight general interest databases. Unlike usage of alibrary s catalog, simultaneous usage of anyone reference databases is relatively uncommon. Providing access to only one user fora general research database, for example,would be satisfactory 80.8% of the time inresearch libraries (R2) and over 95% of thetime in the smaller baccalaureate colleges(B1). If five simultaneous users could beaccommodated for a database, users wouldbe accommodated 99.8% of the time in B1libraries and 94.8% of the time in R2 institutions (table 3).The single most used database in theselibraries was also analyzed alone to mitigateany effects on the data from seldom-usedfiles such as backfiles. Table 4 shows thesimultaneous use figures for the generalmagazine/journal database used the most
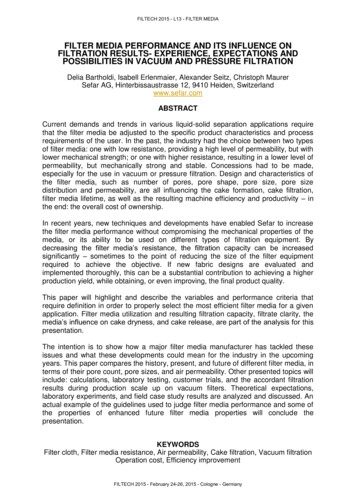
Factors that Influence Online Database Use % % 0 0 0HDQ 6LPXOWDQHRXV 8VHUVAnalysis of QuestionnairesThe 58 libraries that responded to our questionnaire offer a variety of electronic mediafor end user searching. Over 90% offer CDROM, commercial online, and World WideWeb access. Many provide access to severalcommercial online services. Seventy-twopercent provide both in-house and remoteaccess (table 5).Approximately 95% of the libraries thatresponded to my survey offer access on tenor more workstations to the databases provided by the company for which I have usage data, but only 7% have workstationsdedicated to these databases. Multipurposeworkstations that allow access to the library sonline catalog and other online databases arethe rule.Librarians believe that the databasesanalyzed in this study are some of the mostpopular among library users. The largestnumber of libraries (44.8%) reported theseare the most popular databases. An additional 20.7% believe these databases ranksecond in popularity. Some libraries activelypromote one or more of these databases or,at least, make those databases easier to find.Of the libraries that responded to the survey, 62% note these specific databases onthe library system s main menu, 21% postsigns that promote them, 57% provide handouts that describe them, and over 79% offer training that specifically mentions thiscompany s databases. Once a user logs in orsits down at a workstation, it requires just 13 steps to reach the databases in 83% of thelibraries (table 6.)Close ties with academic classes shouldalso influence how much a database is used.Over 72% of the libraries said all of thedatabases from this company have subjectmatter related to academic classes. AlthoughFigure 4. Average Simultaneous Use Patterns by Time ofDay, Magazines and Journals for AcademicLibraries, Academic Libraries by Carnegie Class' ' 5 5 %XV /RFDO RXUFigure 5. Average Simultaneous Use Patterns by Day of Week,Magazines and Journals for Academic Libraries,Academic Libraries by Carnegie ClassJ % % 0 0 0HDQ 6LPXOWDQHRXV 8VHUVin these libraries. Clearly databases that areexpected to be used by a wide variety of students and faculty and have general currentinterest appeal will attract more simultaneoususers.5' ' 5 5 %XV 68102178(:('7 8)5,6 7'D\ RI :HHNApril 8 11, 1999, Detroit, Michigan
Carol Tenopir6Figure 6. Average Simultaneous Use Patterns by Month,Magazines and Journals for Academic Libraries,Academic Libraries by Carnegie Class % % 0 0 0HDQ 6LPXOWDQHRXV 8VHUV ' ' 5 5 %XV 0RQWKmany librarians don t know for sure if the databases arementioned in academic classes, 64% report that they arementioned specifically and 55% said there are specificclass assignments that require use of the databases.Conc
for every database. For this study, usage data were sampled once per hour (on each half-hour), from the hours of 8 a.m. to midnight, for a period of 6 months (July to December.)1 Still, over 281,000 data points per database are included in this sample of academic libraries. Usage data reveal how many simul-taneous users are logged on to any one